A Function of Freedom and Constraints

In June, a colleague invited me into his classroom to teach a Desmos modelling task — Predicting Movie Ticket Prices — in his Math 12 class. Students experienced exponential functions earlier in the course. We were curious about whether his students would apply what they knew about exponential functions to a task situated outside of an exponential functions unit — a task not having to do with textbook contexts of half-life, bacteria, or compound interest. They did. And they deepened their understanding of how change by a common ratio appears in exponential equations (vs. change by a common difference in linear equations). They did this within 45 minutes of a 75-minute class. So my colleague let me try out another, less sexy, task — one adapted from MARS. This task, like much of Math 12, is about naked functions; no real-world context here. Nat Banting’s closing keynote at #NWmath reminded me of it. Watch Nat’s talk; view his slides.

functions

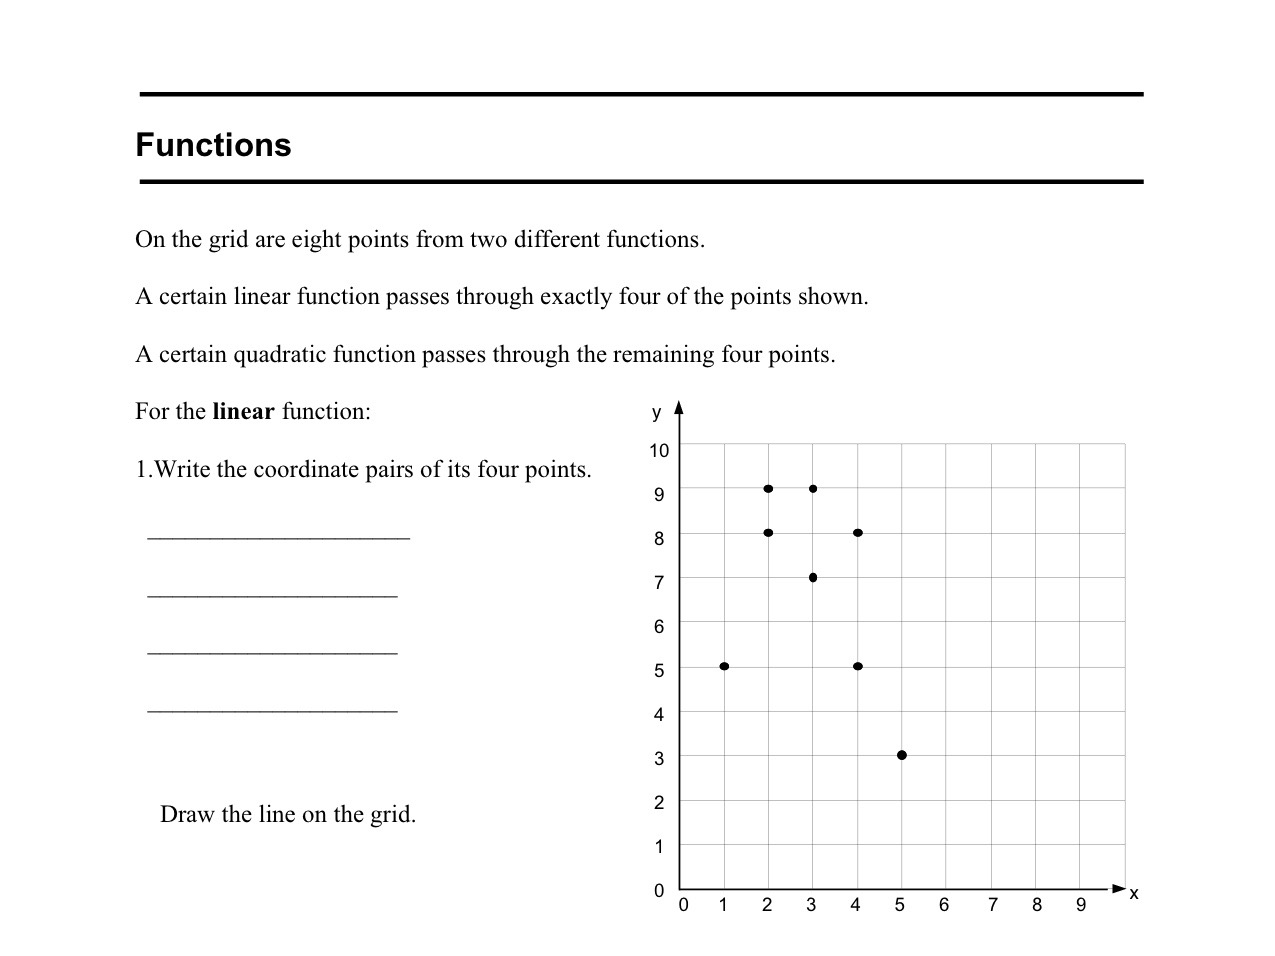
The original MARS task above is closed: two functions, one linear and one quadratic, each passing through four points. I wanted to open it up so I changed the prompt: “A set of functions pass through the points shown. What could the equations for the functions be?” Also, I removed one of the points — (5, 3) — to allow for different solutions of two functions. The thinking is that open questions encourage a variety of approaches. And then, from fifteen pairs of students:

fA

I anticipated this. The points scream linear and quadratic. They are sources of coherence. I had lowered the floor but no Rileys entered y = 5, y = 7, y = 8, y = 9. The problem wasn’t problematic. I had raised the ceiling but no one wrestled with equations for sinusoidal or polynomial or radical or rational functions. The freedom within my open question didn’t bring about new and diverse ideas. To support creativity — mathematical creativity! — I had to introduce a source of disruption, a constraint“A set of nonlinear functions pass through the points shown. What could the equations for the functions be?”

A student could have used the linear nature of absolute value functions to get around my nonlinear constraint — a bit of a Riley move? — but no one did.

fC

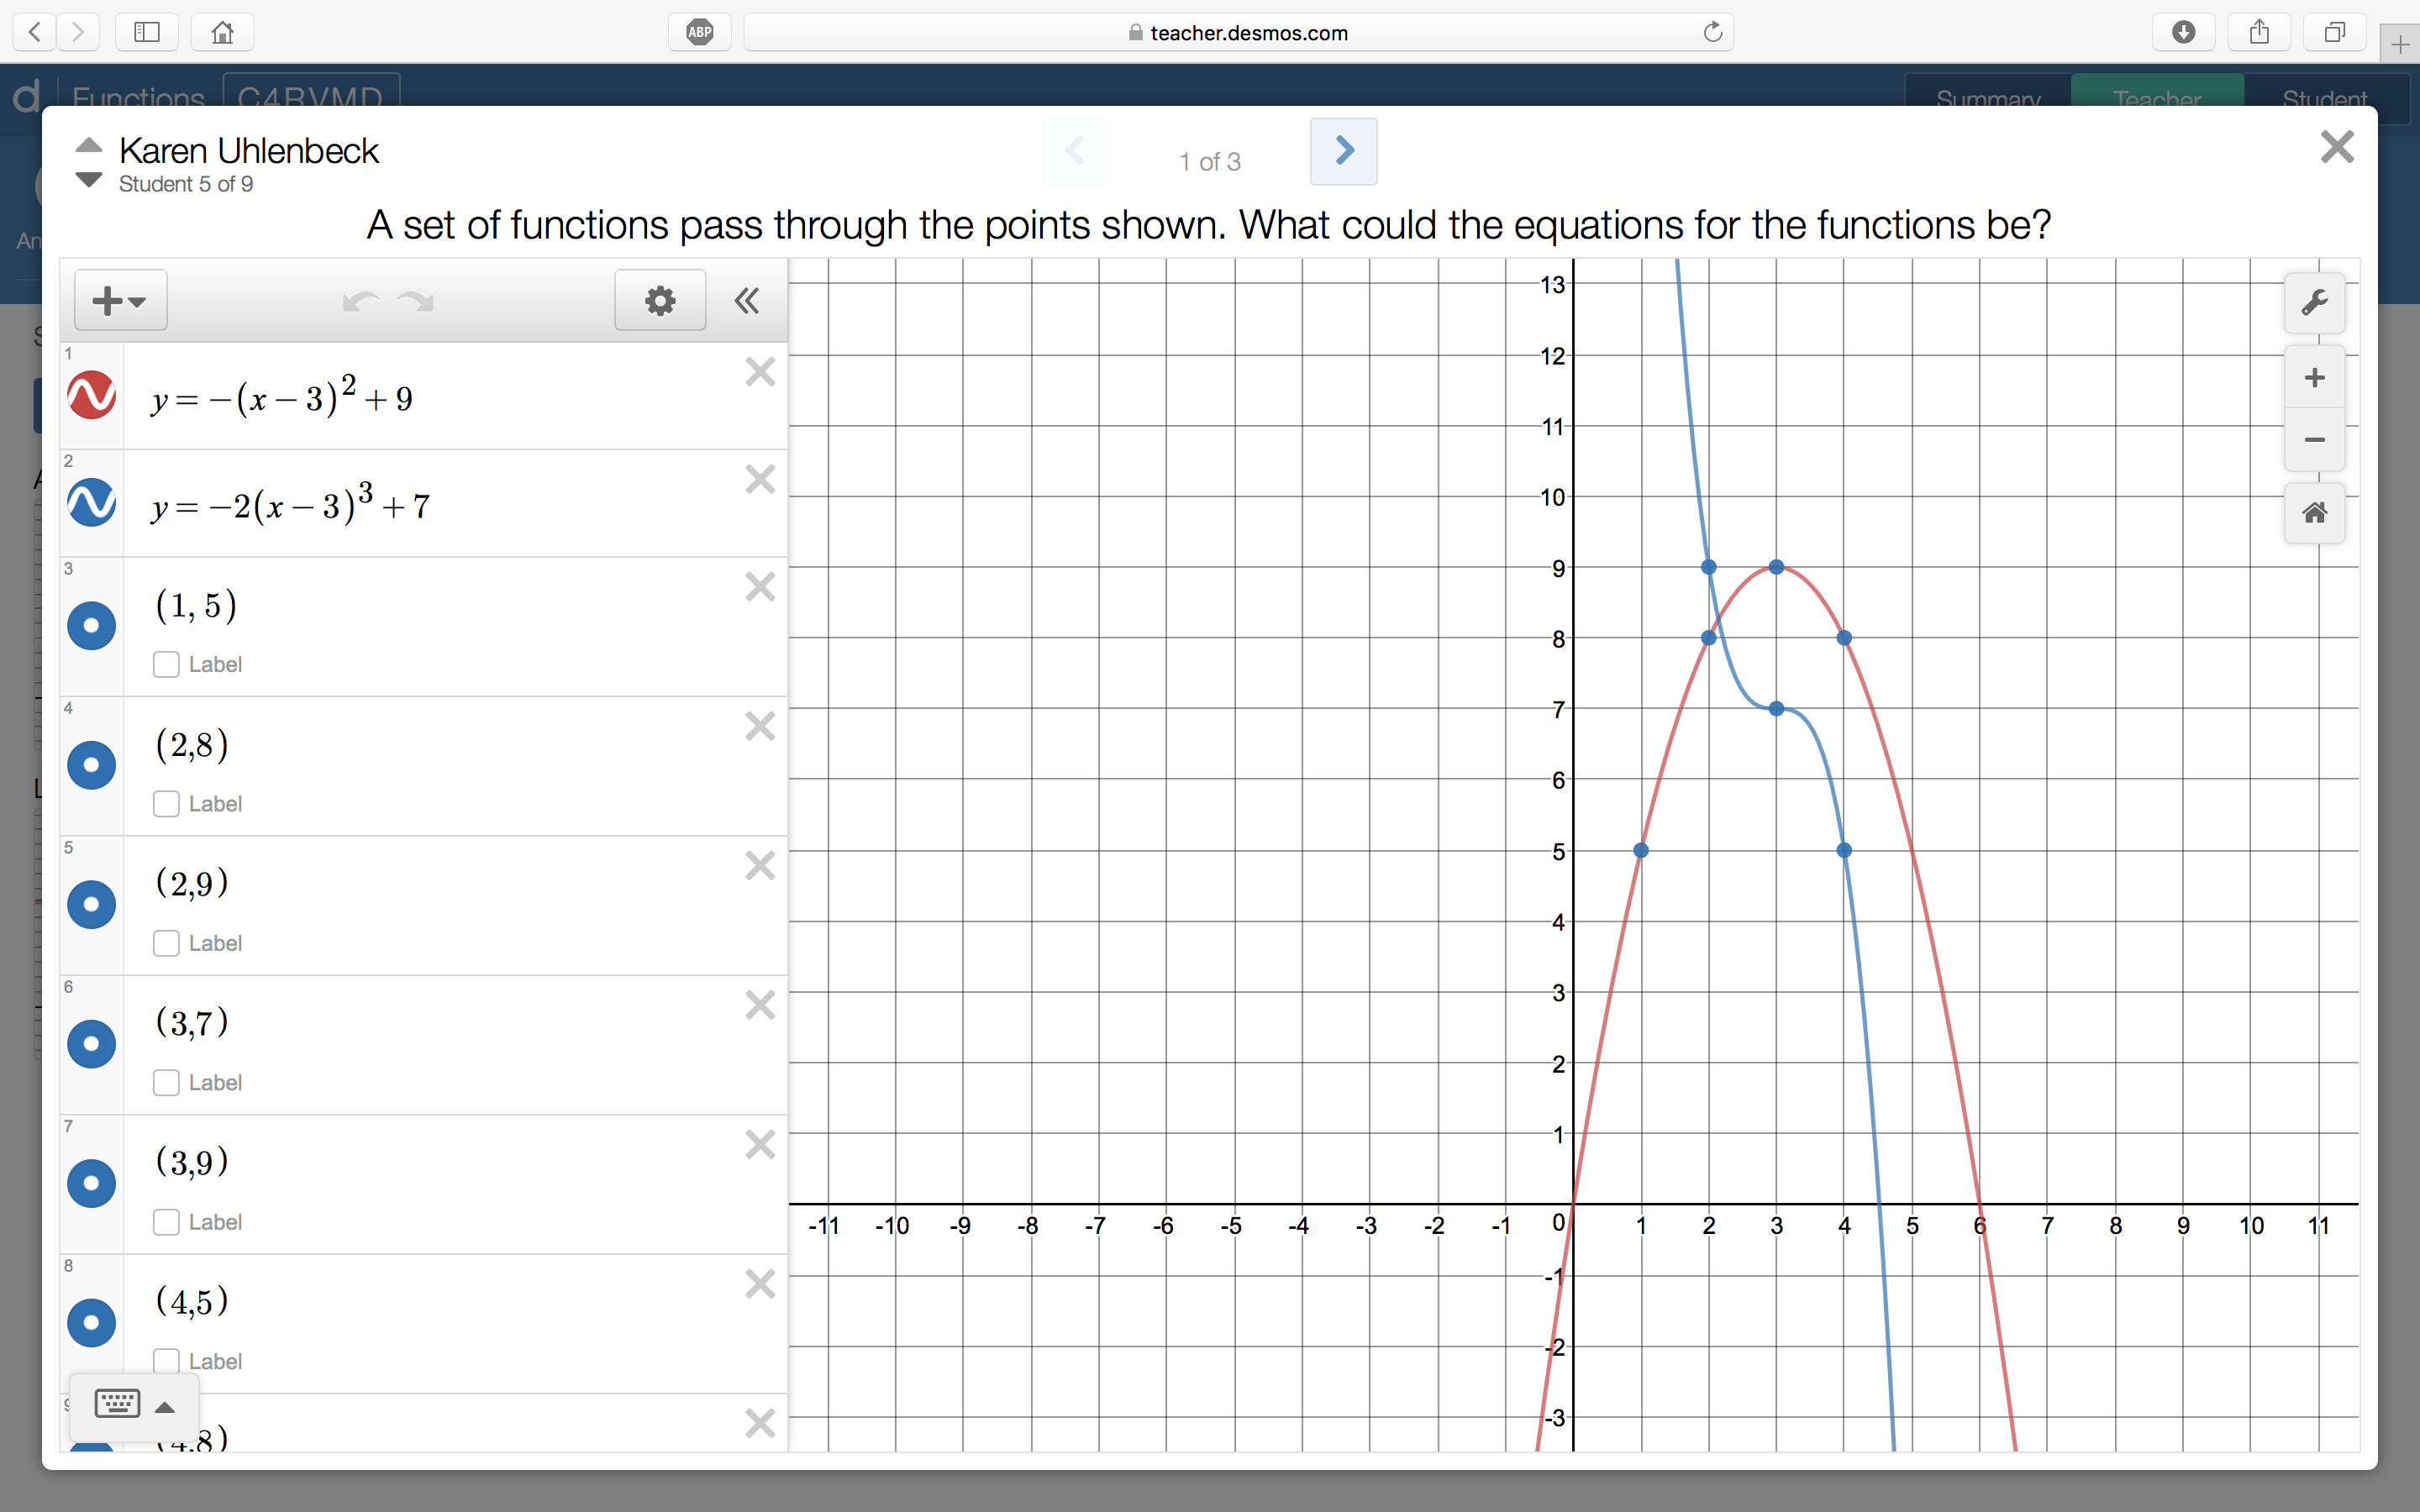
Instead, some students picked up on the symmetry of two new possible parabolas:

fB

Writing the equation of the second parabola — finding the parameters a and q — presented more of a problem.

Others bent the line; they saw the middle of its three points as the vertex of a cubic function that had been vertically stretched and reflected:

fE

Some saw four compass points and wrote an equation of a circle. This led to a function vs. not a function conversation: “Does that count?” Others saw a sine function that passed through three of these four points. There were “close enough” solutions — great for Coin Capture but not quite passing through the given points:

I didn’t anticipate this. Students weren’t as constrained by “pass through” as I was. Also, they were motivated to capture the points using only two functions, as before.

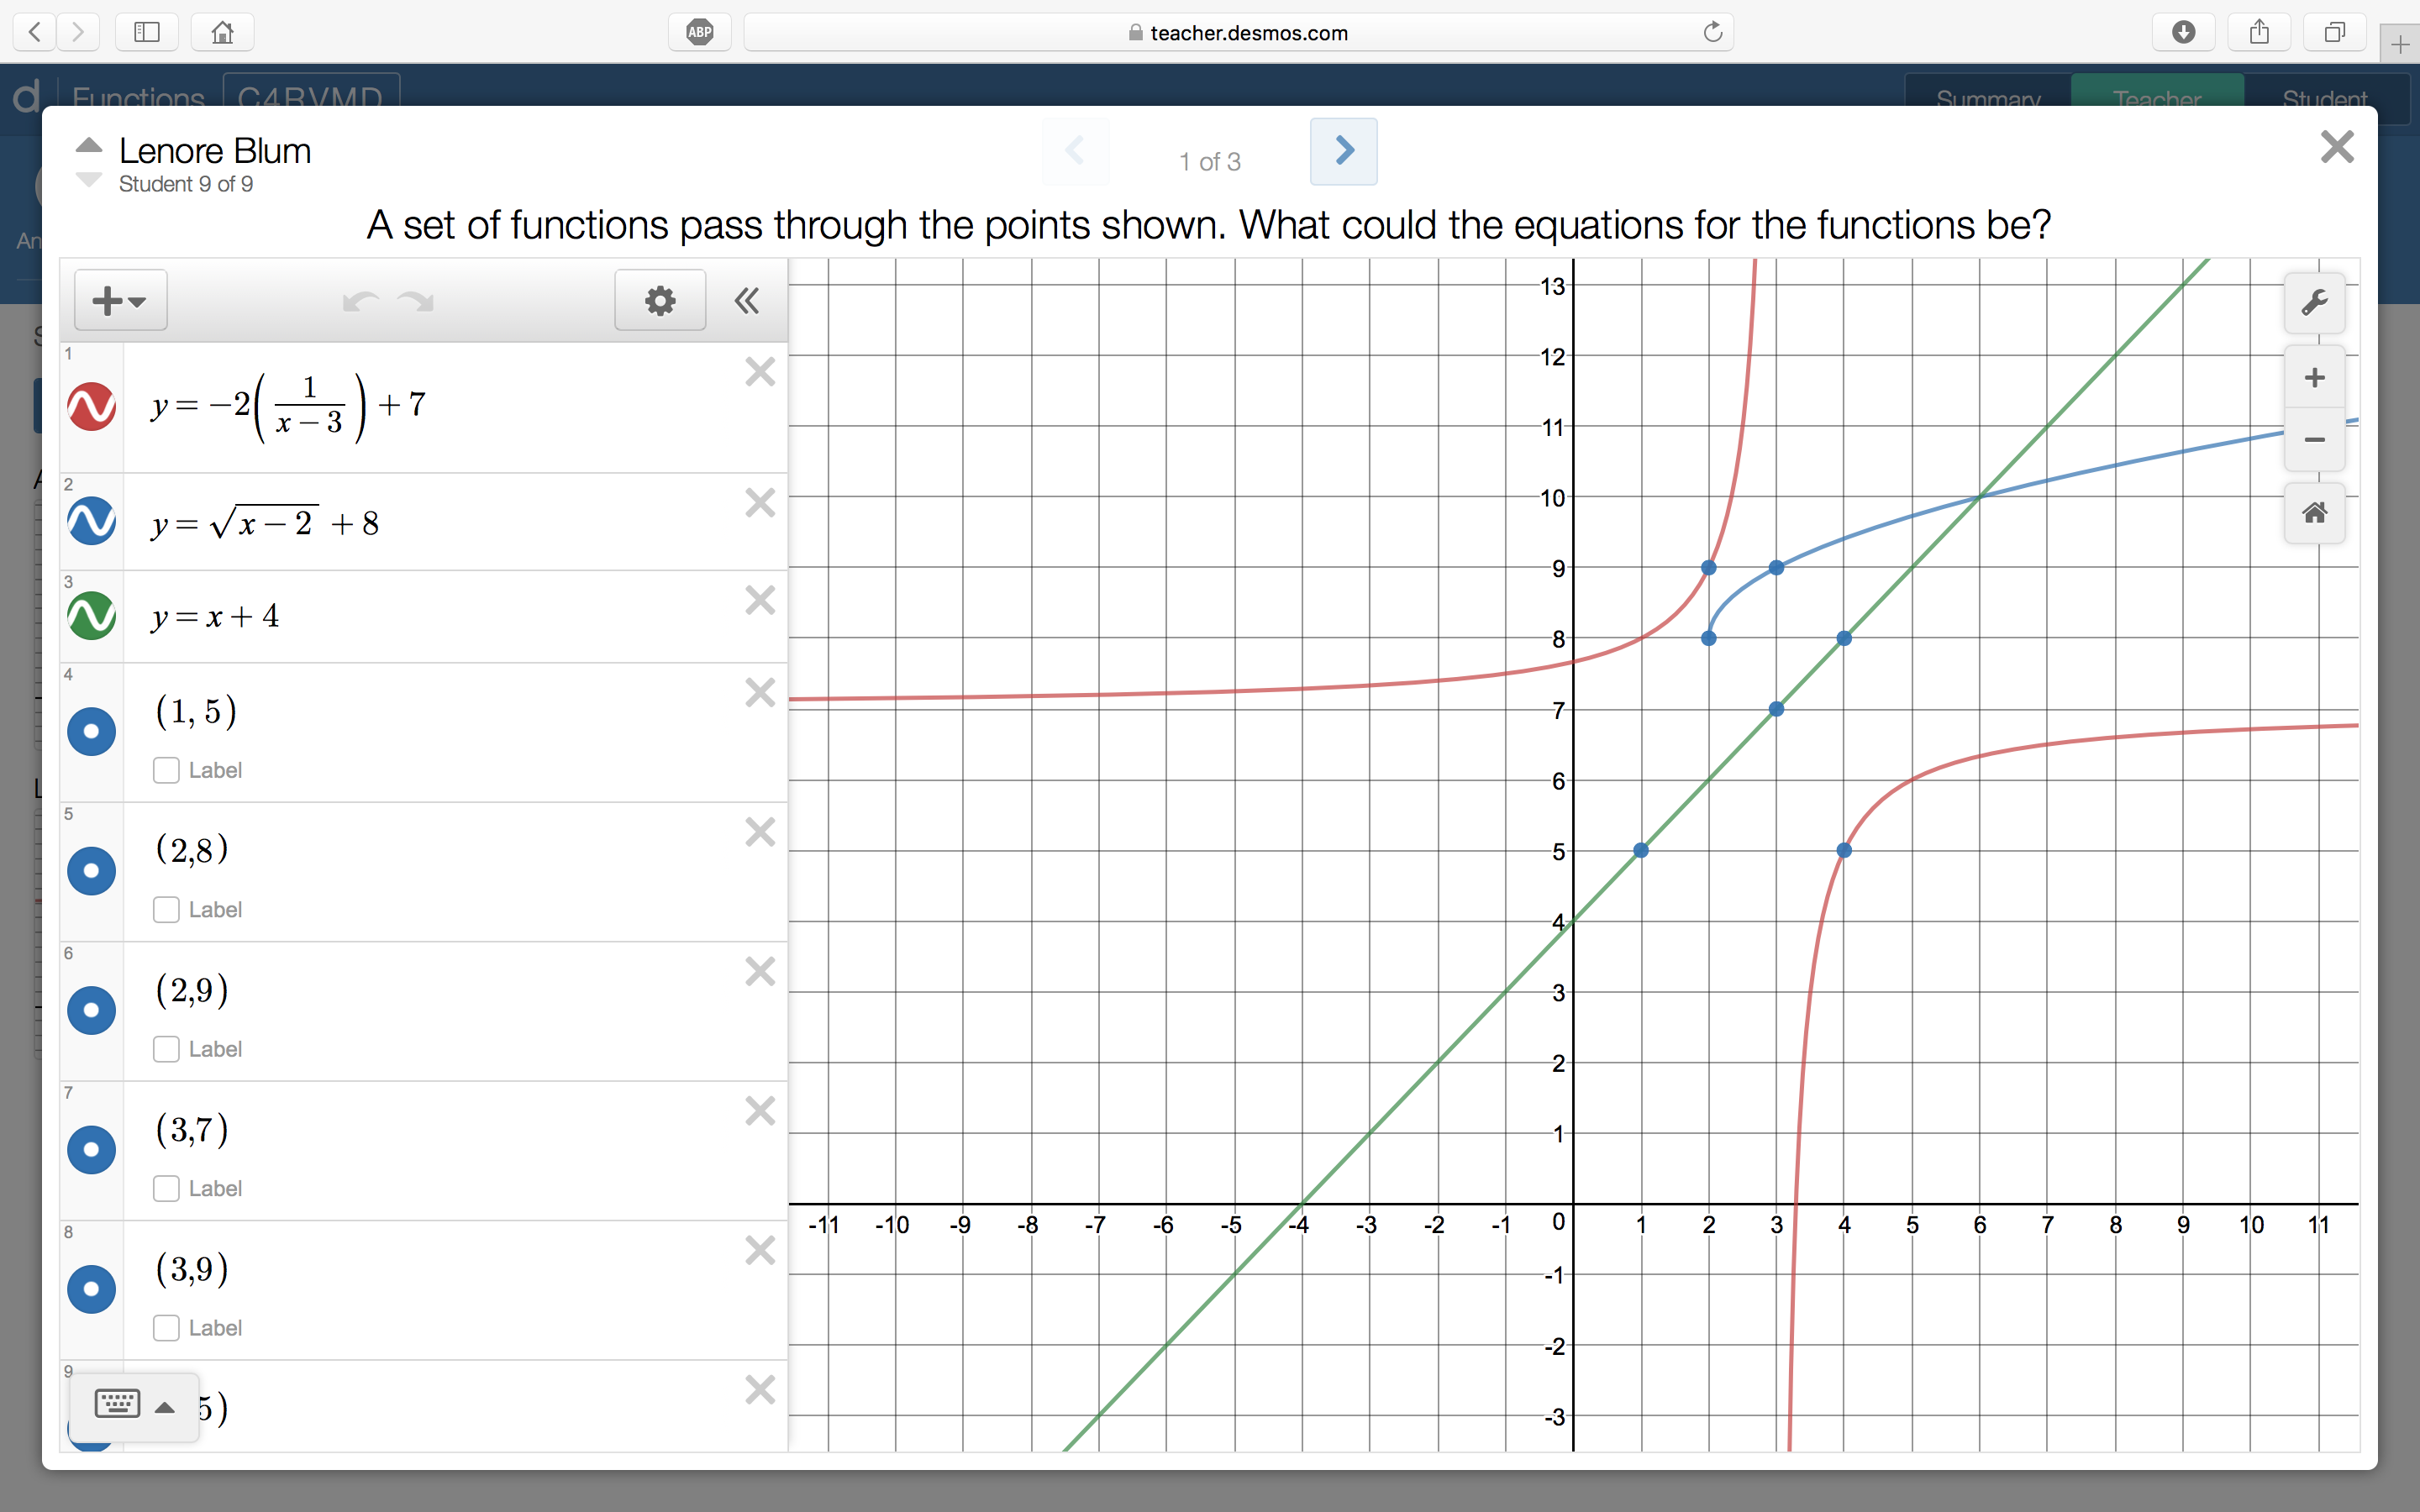
With more time, I could have shifted constraints again: “A set of functions pass through the points shown. What could the equations for the functions be? (P.S. The graph of at least one of them has an asymptote.)” This would have triggered exponential and logarithmic or rational functions. (Even without introducing this constraint, we noticed at least one student playing with rational functions at the end of class.)

Above, there’s evidence to support Nat’s #NWmath conjecture: “Shifting constraints triggered new mathematical possibilities.” My (more) open question didn’t cut it. The student thinking — and conversations — that I had hoped for only emerged when freedom “sloshed against” constraints.

Desmos activity

Update

Edited & published in BCAMT’s Vector 62(2).

Northwest Mathematics Conference 2012

I was asked to post my presentation slides and I promised to have them up this weekend. If you were not in attendance, they probably don’t make a lot of sense. If you were in attendance, I probably didn’t make a lot of sense.

Some of the activities that I shared were my own; other activities were my renditions of the works of masters.

Some quick links:

The Masters
Fawn Nguyen’s Barbie Bungee & Follow Up on Friday Bubbles
Andrew Stadel’s Estimation 180
Kate Nowak’s Absolute Value Both Rigorous and in Context

Also, I blogged about K8’s activity in this post: Teachers Make Excellent Pirates – Two Treasures from Blogs I Follow.

Me
The more sides you have, the smarter you are.
Math Picture Book Post #2: Calvin Can’t Fly
Hey, I just met you and I wanna rock your gypsy soul
Revisiting GeoGebra

I haven’t blogged about the linear/quadratic patterns activity (yet), but here are some similar posts: Linear Functions – Concretely, Pictorially, Symbolically (my first post) & Revisiting Pictorial Representations of Linear Functions.

Special thanks to Eddi Vulic for being my straight man (“What’s that in the pudding?”) and for pointing out my mispronunciation of Nguyen. Oh well, at least this probably didn’t leave the room…

Oh crap.

I’ll leave you with this:

Mystery Transformation

A Principles of Math 12 learning outcome states “It is expected that students will describe and sketch 1/f(x) using the graph and/or the equation of f(x)”. In my classes, students were more likely to ask ‘the question’ at the beginning of this lesson than during any other lesson.

Over the years, I simplified my explanation. Three steps:

  1. asymptotes
  2. signs (i.e., if f(x) is greater than zero, then 1/f(x) will be greater than zero)
  3. invariant points (and other important points)

Most of my students were able to successfully sketch reciprocal functions. I had successfully prepared them for the provincial exam. Still, I wasn’t satisfied with this lesson. My students weren’t learning mathematics, they were just following directions – following my steps.

Together, Marc Garneau and I created the activity below, probably inspired by this book.

Warm-up:

  1. How is the blue graph related to the red graph?
  2. Write an expression to represent this transformation.
  3. The point (5, 3) is on the graph of y = f(x).
    What point must be on the graph of y = -f(x)?

Activity:

  1. Have students work in groups of 3-4. Give each student in the group one of six cards.
  2. Have students record any observations they make about the graphs that are on their cards.
  3. Have students take turns sharing their observations. Encourage them to look for similarities and differences.
  4. Ask students to describe, in words, how the blue graph is a transformation of the red graph. Ask students to write an expression that represents this transformation. (The extra 2-3 cards can be used to test and confirm ideas.)
  5. Have students share their strategies with the class.


Discussion:

Sunita Punj invited us into her class to try out this activity. (Thanks again, Sunita!) Her students made some key observations, such as:

  • “There’s an asymptote at the x-intercepts”
  • “When the y is 1 or -1, it stays the same.”
  • “Points on the red graph that are 2 spaces up become points on the blue graph that are 0.5 spaces up.”

Sunita’s students were then able to use this information to discover that the blue graph could be obtained from the red graph by taking the reciprocal of the y value. I enjoyed listening to, and participating in, the mathematical conversations that were happening at each table.

  • “Is that always true?”
  • “I have a theory…”
  • “But why don’t the blue graphs touch the dotted lines?”

Students were not simply following directions. Nobody asked ‘the question’. (Still, if there is a real-world application here, I’d love to learn about it.)

There may be limited opportunities in Math 8-12 to have students identify a ‘mystery transformation’. However, I think it’s worth exploring the bigger idea – giving students questions and answers and then asking them to talk about how the answers may have been determined.