My last series of posts centered on standards-based assessment, which for several years has been the focus of much of my work with teachers. I’ve been somewhat dragged into this work. I think–a lot–about my experiences in my own classroom and the changes that I would make if I was to return. Assessment would come way down that list. It’s not that I had assessment figured out–I didn’t–but that shifts in other practices would take precedence. Throughout my SBA series, I addressed the same content learning standard: systems of linear equations. This got me thinking about one particular pedagogical do-over that I’d like to have.
A “concept-based” (and “competency-driven”) curriculum would highlight that solving a system requires finding an ordered pair (or set of ordered pairs) that satisfies both equations. In my classroom, I talked about this idea: “There are infinitely many pairs of numbers that make the first equation true. Also, there are infinitely many pairs that make the second equation true. But, there is only one pair that makes both equations true!” My students listened to this essential understanding; they didn’t experience it. Students as spectators.
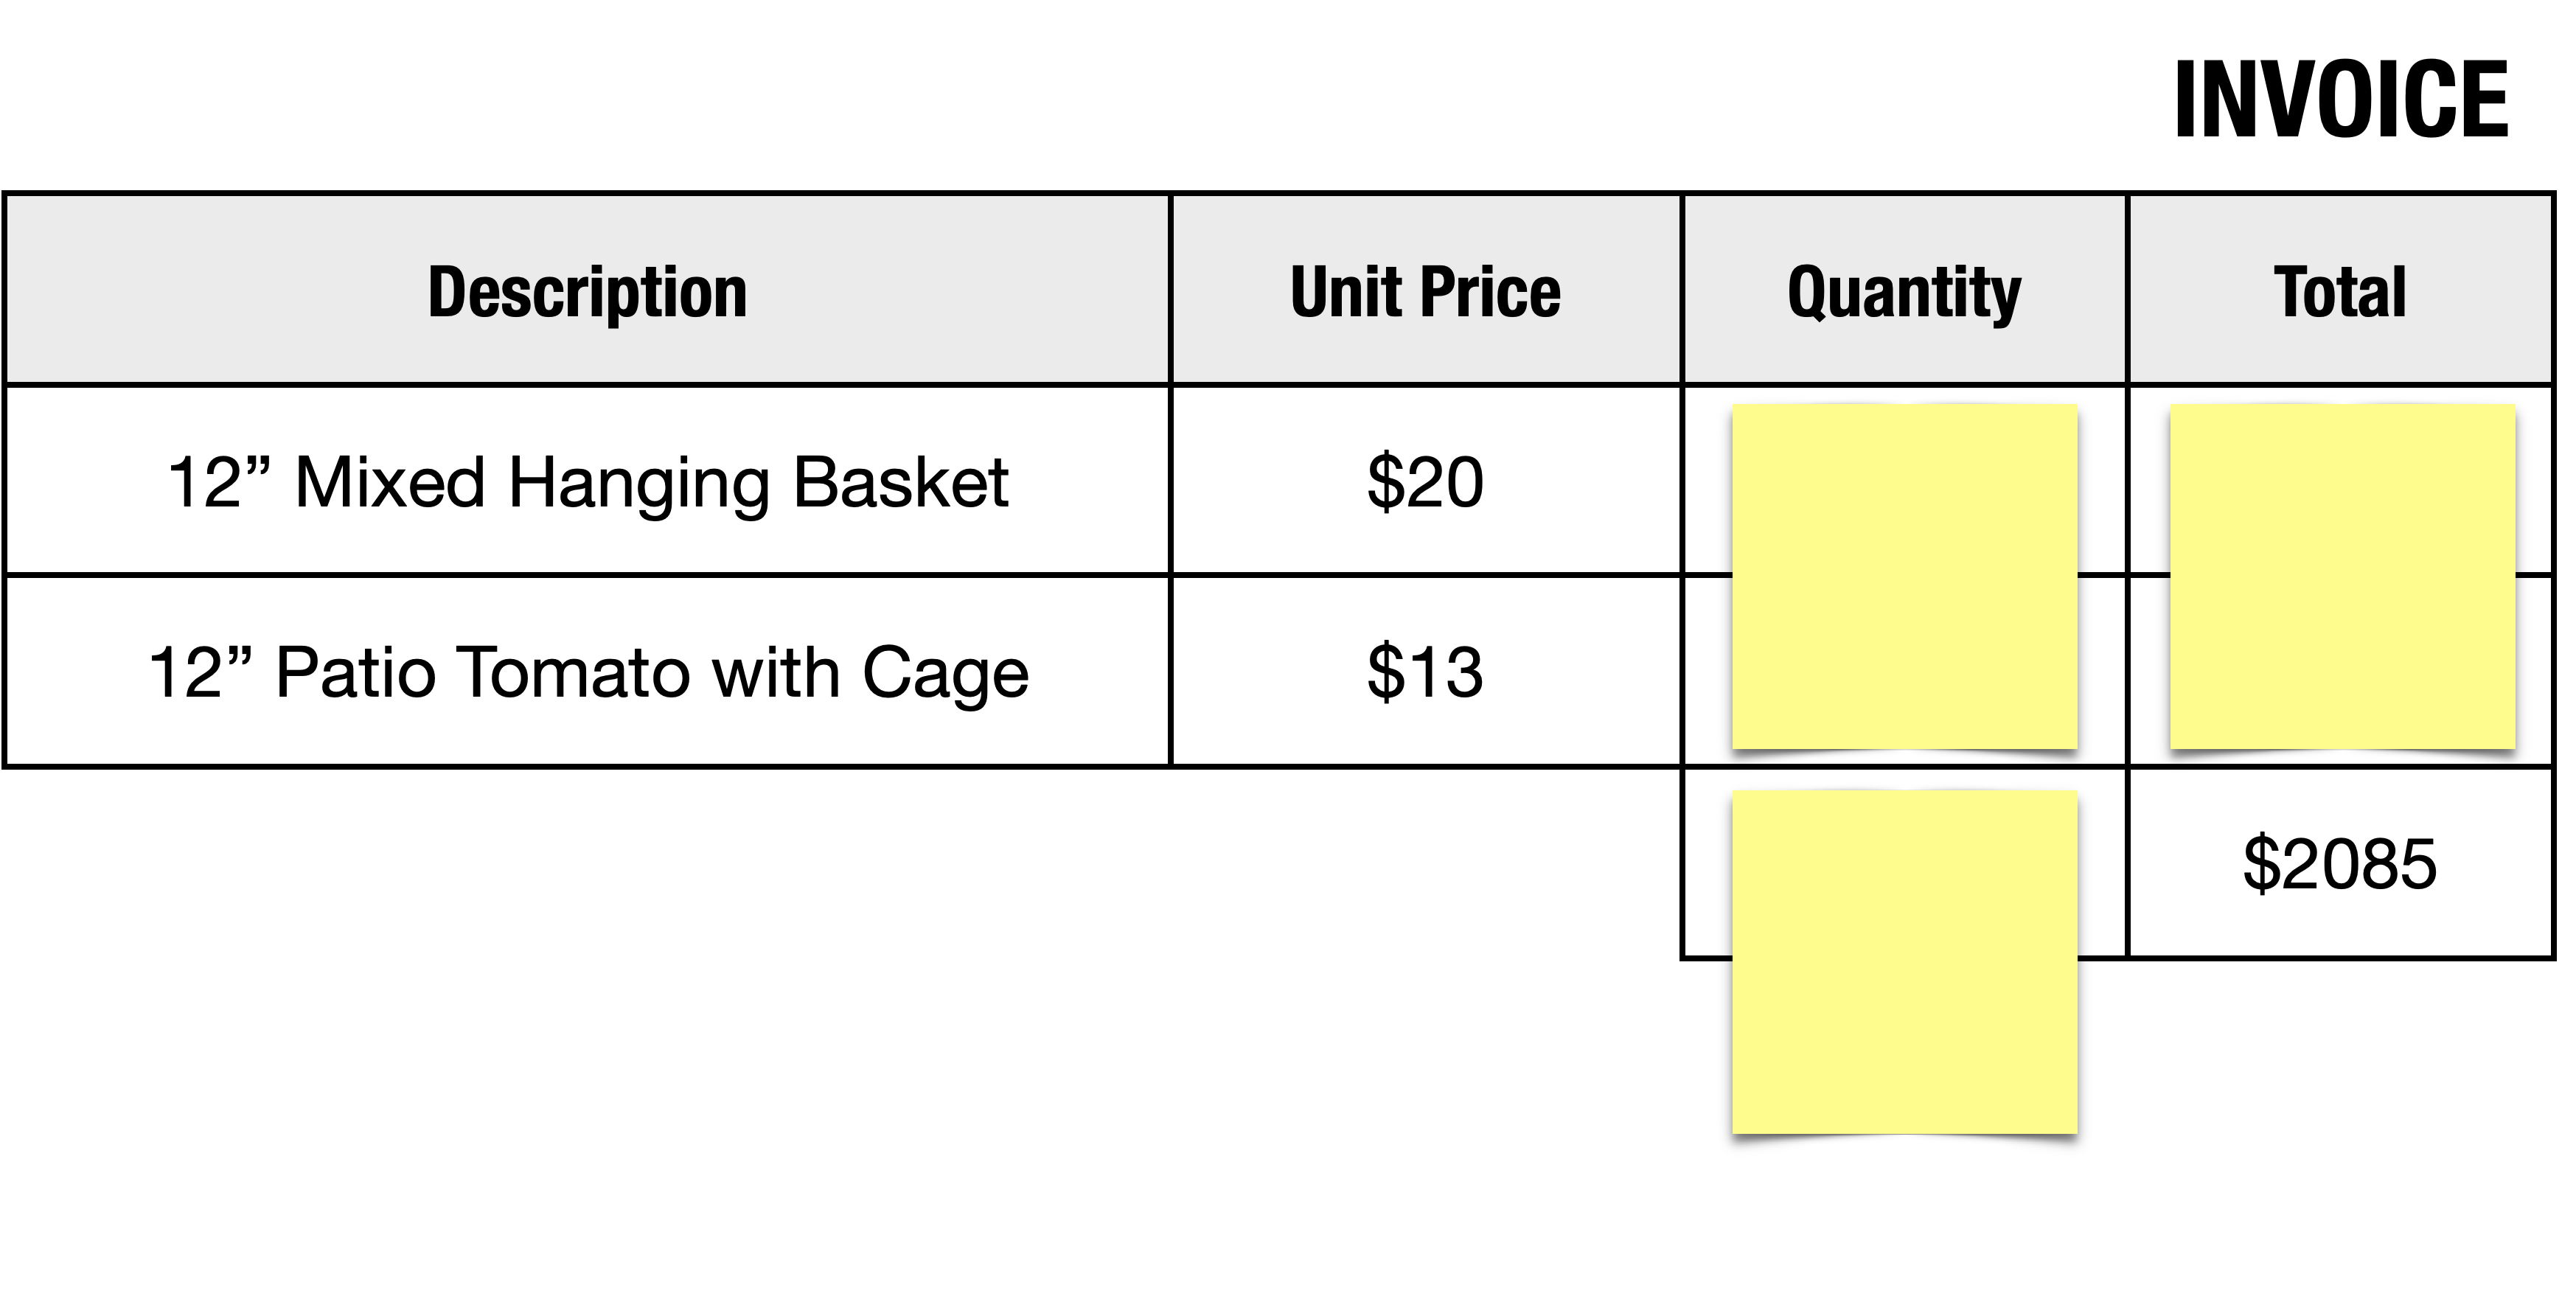
A few years ago, the PAC at my kids’ school organized a plant sale fundraiser in time for Mother’s Day. Hanging baskets at one price, patio vegetables at another.
Simply translating this scenario into a word problem (like this one) doesn’t lead to students experiencing the big idea. Our actions, not posters, must communicate that “Learning takes patience and time.” A more patient problem-solving experience…
Give students time to play with possibilities: “What is a large/small amount that the PAC could make? What amounts could they not make?” etc.
Slowly reveal information. Remove one sticky note. How many of each did they sell?
Students will come to see, either within small–and visibly random–groups or through whole-class crowdsourcing, that there are many possibilities.
Remove another sticky note to reveal more information.
Students will observe that the eight (whole number) possibilities have become one. That is, they’ll experience the big idea about systems for themselves.
Remove a third sticky note. Ask “How confident are you?” This creates a need for students to check their work beyond catching incorrect calculations.
Remove the last sticky note.
In my Systems of Linear Equations videos from Surrey School’s video series for parents, I chose to apply this approach to a non-contextual naked-number problem.
Because of this choice, I might decide to use the plant sale scenario as an assessment item.
Tell students that the PAC has made the claim above. Ask “Do you agree? Why or why not? Convince the PAC.”
Admittedly, I haven’t added much to Dan Meyer’s systems of equations makeover from more than five years ago. (Man, I miss math ed blogs!) These ideas about teaching still interest me much more than “Is this Developing or Proficient?” For more patient problem solving see:
It’s time to report out. How would you translate the following into a proficiency level, letter grade, or percentage? What would you assign to Aaron, Blake, and Denise?
Gradebook at time of first Learning Update
If your reporting policy requires a proficiency level (e.g., Grades K-9 in BC), analyze the data and make a judgement. To me, Aaron has demonstrated Extending, Denise Developing. Blake has also demonstrated Developing. Or Partial. I’m waffling.
What if this was your gradebook for Math 10? In BC, you may use proficiency scales but must provide letter grades and percentages. In this post, I’ll propose a solution–admittedly flawed–to this problem. But first, a bit about why this is a problematic practice…
Percentage Problems
Think of a student who has achieved 80% in Math 10. Describe their level of performance.
Got it? Great! Now do 79% and 81%.
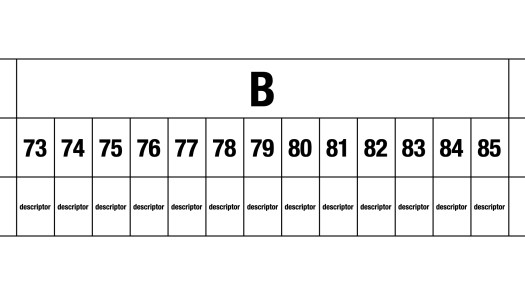
Don’t stop! Finish the Bs.
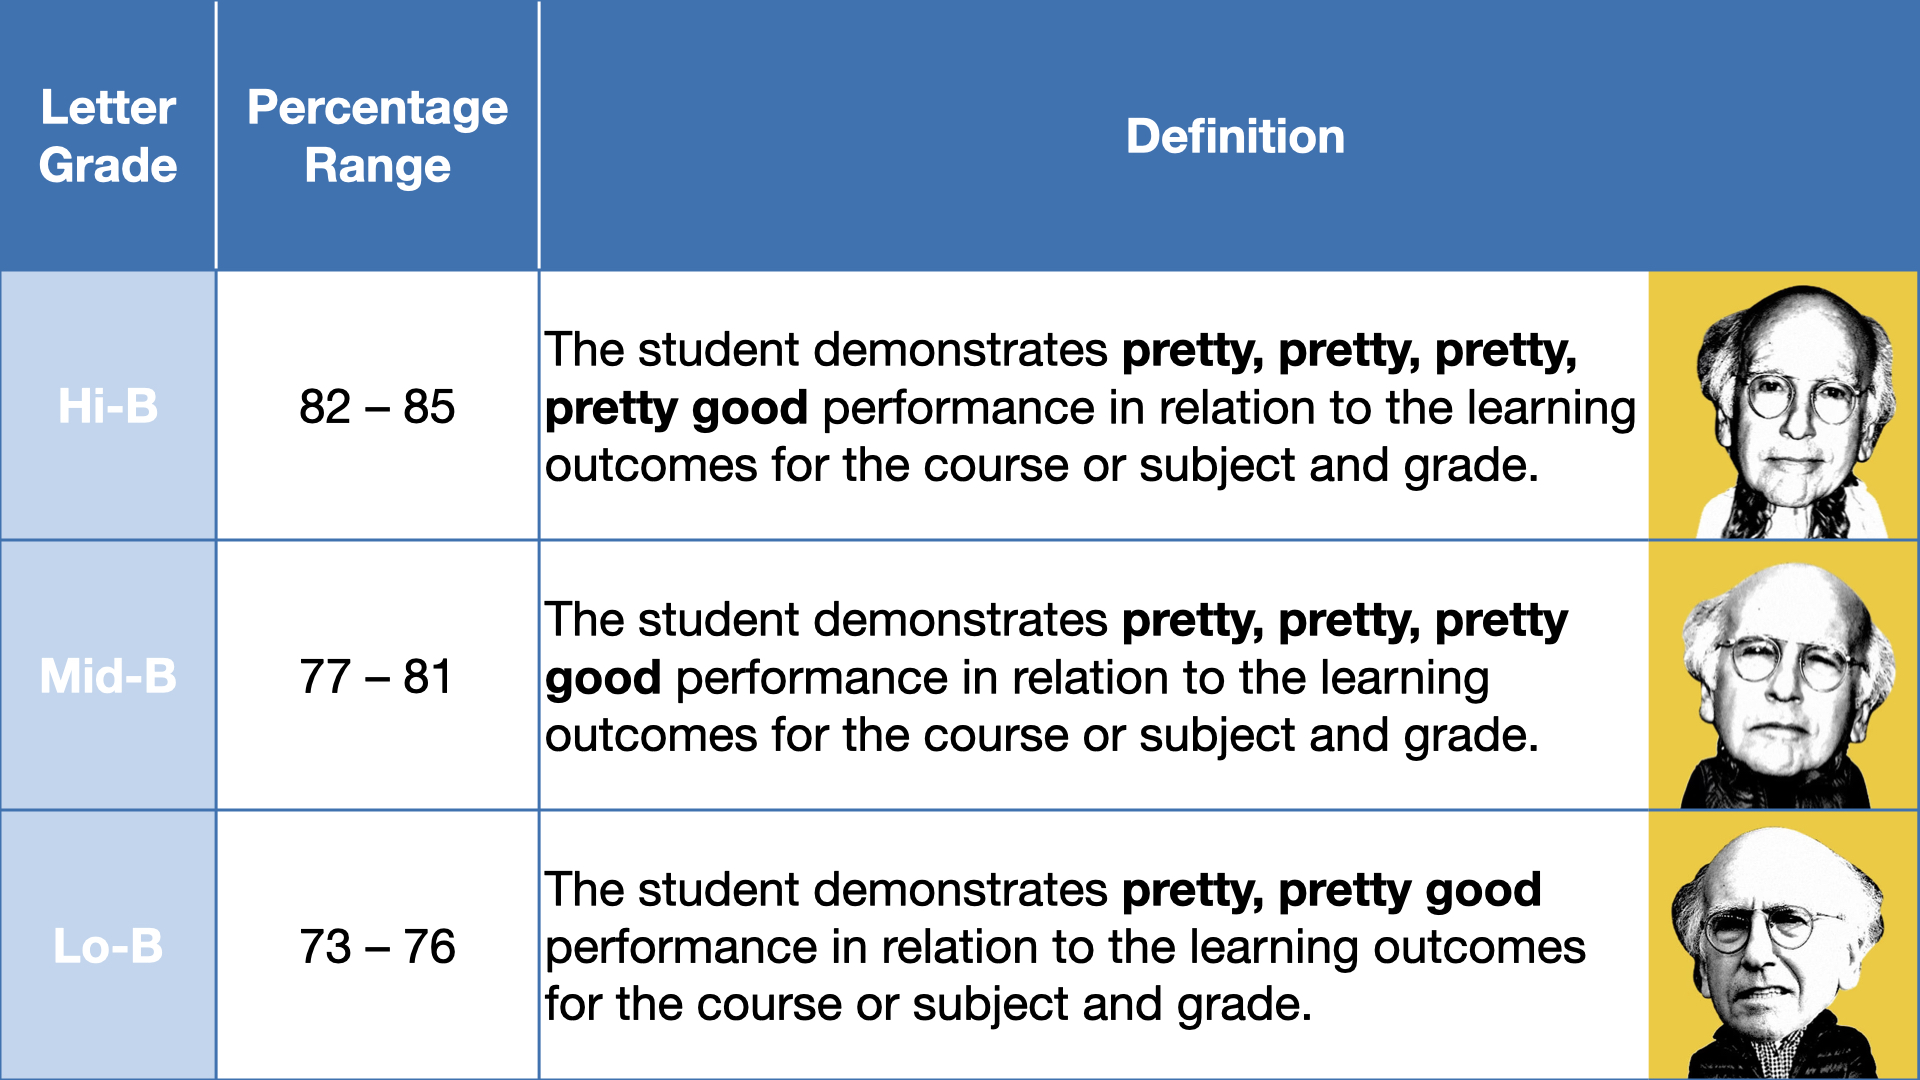
A letter grade and percentage mandate suggests a difference between 73% and 85%–both Bs in BC. Quantitatively? Sure. In the point-gathering paradigm, 73% leaves almost twice as many points on the table as 85% (i.e., the “Lo-B, Hi-B” refrain).
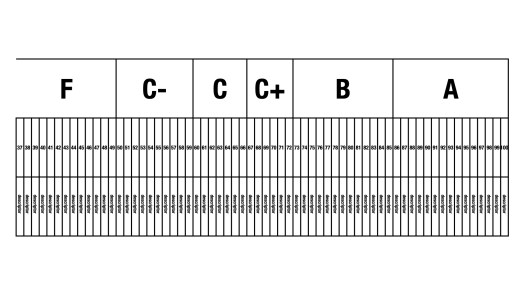
But qualitatively? Not really. See the Ministry of Education’s letter grade definitions:
F; 0 – 49; The student has not demonstrated, or is not demonstrating, minimally acceptable performance in relation to the learning outcomes for the course or subject and grade. Policy Development Background & Rationale Document (PDF)
There are not thirteen (85 − 73 + 1) variations on very good. Three is a stretch:
NB: pretty good < good
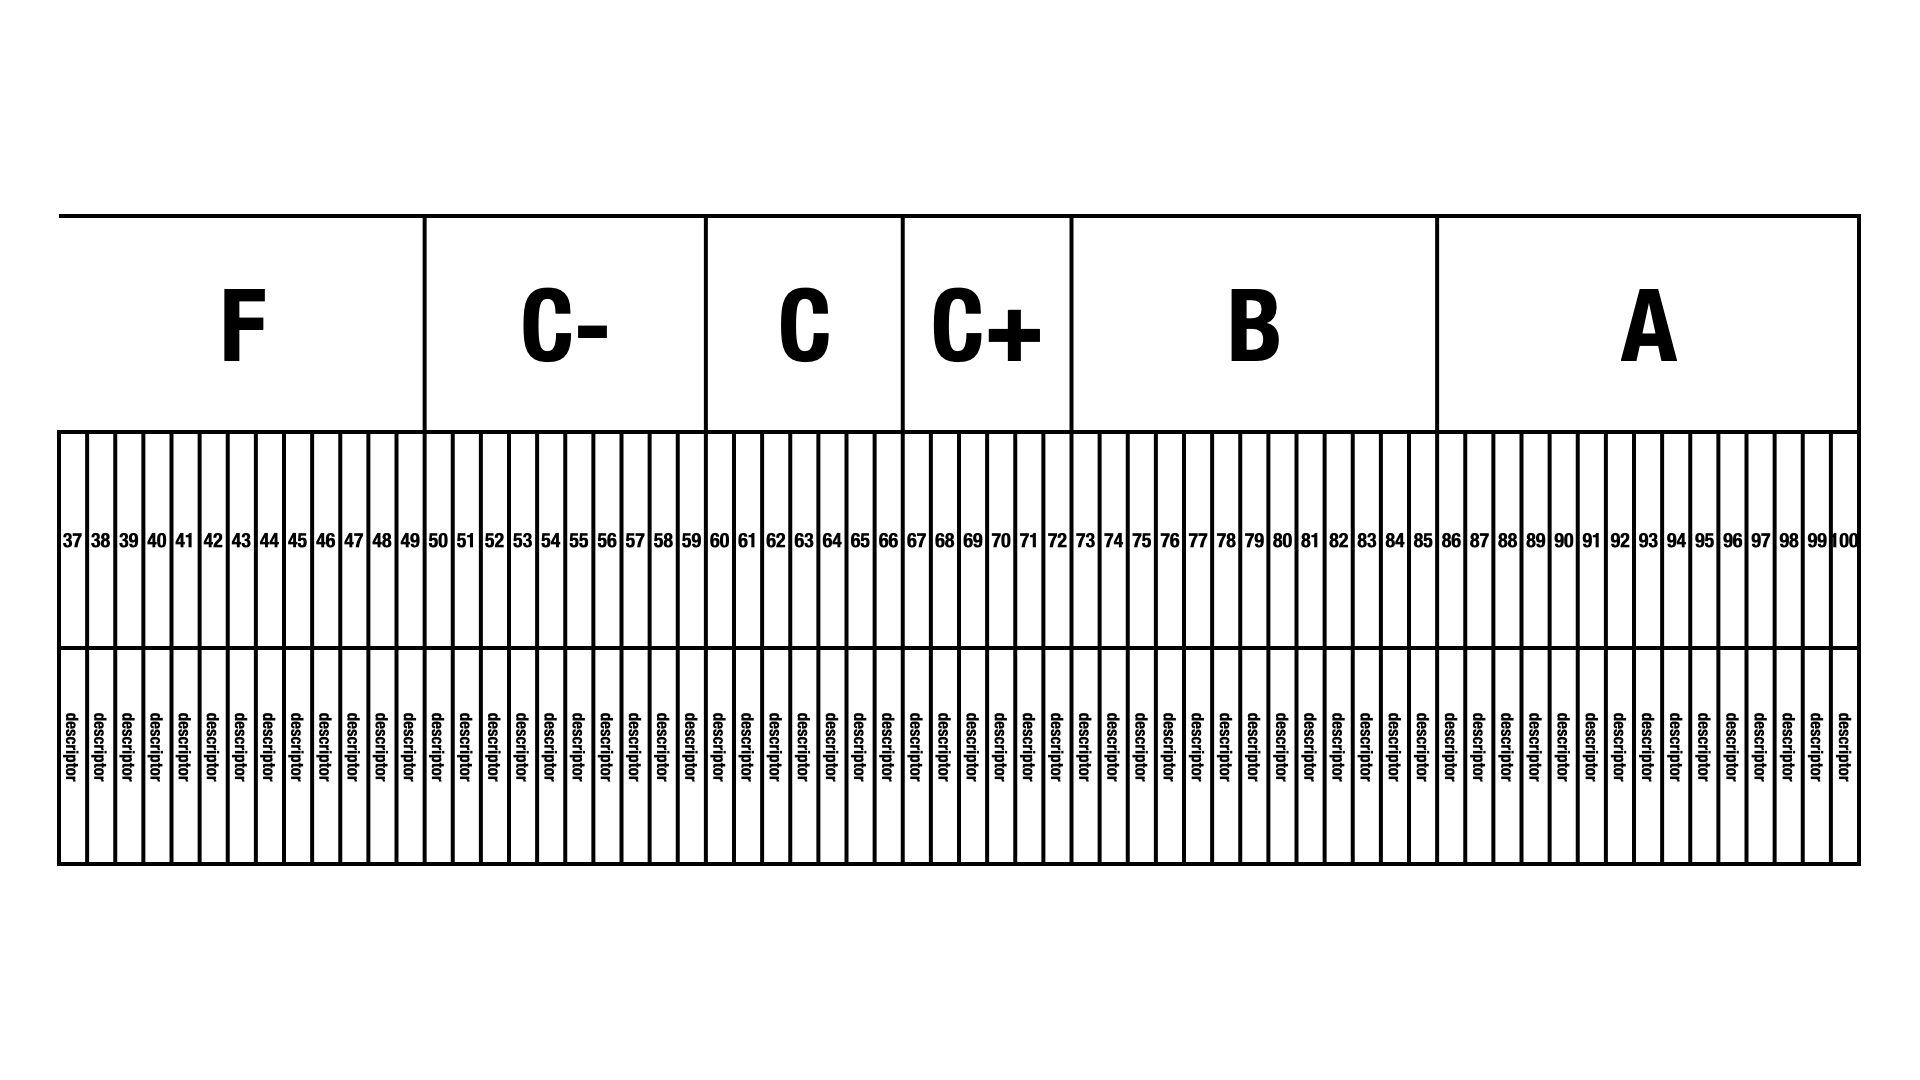
Extend the table. Write distinctly different descriptors of all levels, from 86% up to 100%, 72% down to 0%.
0-36 didn’t fit.
You can’t. Whereas letter grades differentiate six levels of performance, percentages differentiate one hundred one. No teacher can be that precise (or accurate). Like objectivity and consistency, precision is a myth.
Standards-based assessment is not designed to produce percentages. Proficiency scales are not numbers! Still, teachers–of Grades 10-12 only–are required to report out a number. So, holding my nose…
Imperfect Solutions
🔴 1-2-3-4
To turn the data into a number, values need to be assigned to proficiency levels (e.g., Emerging = 1, Developing = 2, Proficient = 3, Extending = 4). Students receive a value on each outcome. The numerator takes together these values from all of the outcomes; the denominator is the greatest sum that is possible. Aaron, Blake, and Denise receive 83% (B), 63% (C), and 48% (F), respectively.
Student Navigation Tool
This feels… off. Denise demonstrated partial (Developing) or complete (Proficient) understanding of seven of ten learning outcomes. Nevertheless, she is failing. This is because a 1-2-3-4 scale is harsh. One-out-of-four (i.e., 25%) for Emerging isn’t just a failing grade; it’s an unforgiving one. Also, two-out-of-four (i.e., 50%) for Developing leaves no wiggle room. Developing is more than a minimal pass.
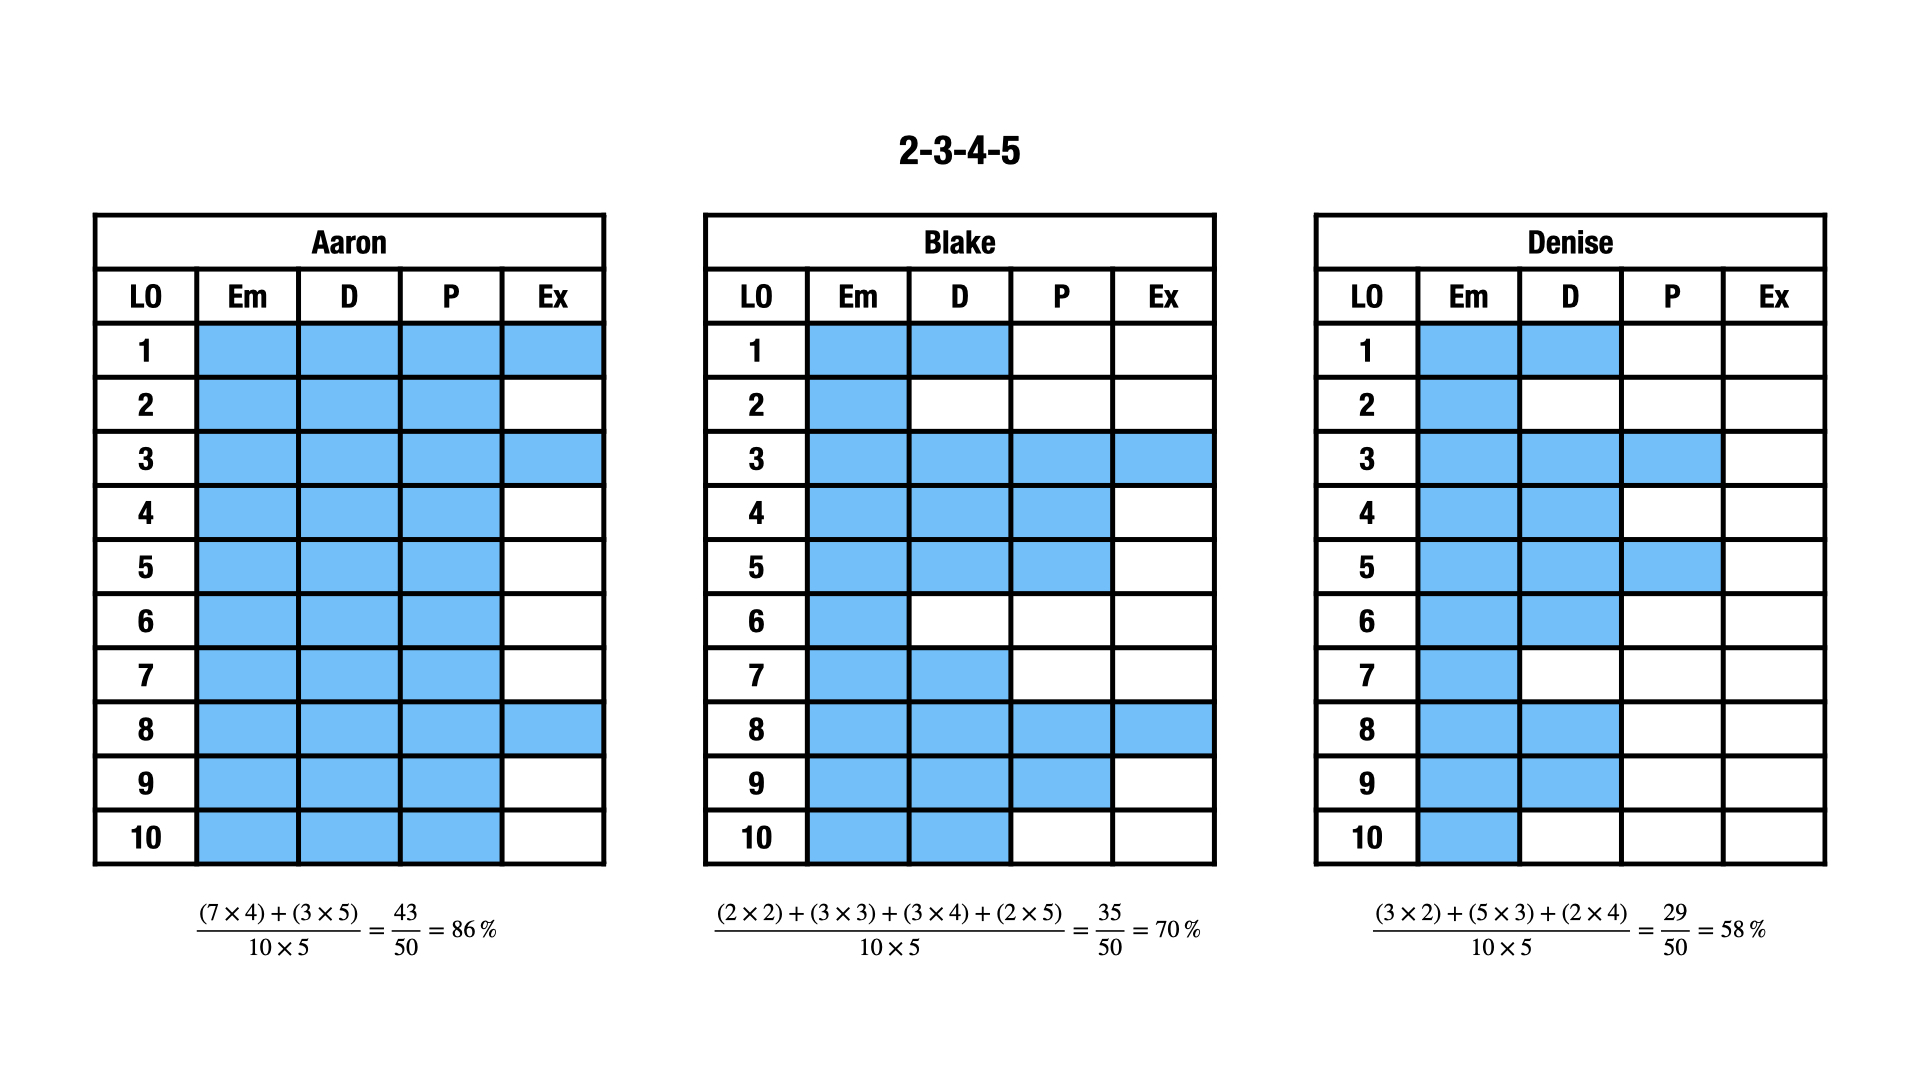
🟡 2-3-4-5
A 2-3-4-5 scale feels more accurate. Aaron, Blake, and Denise now receive 86% (A), 70% (C+), and 58% (C-), respectively.
Student Navigation Tool
Note that Denise is now passing. I really like the example of Aaron since it illustrates that Extending is not “the new A.” To achieve an A, Aaron demonstrated Proficient in all, Extending in (just) a few. Further, Blake’s C+ feels fair. To “award” Blake a B, I’d want to see additional evidence of their proficiency (i.e., new data points at Developing in outcomes 2 or 6 or Proficient in outcomes 1, 7, or 10).
If 2-3-4-5 doesn’t work, play with 3-4-5-6. Or 46-64-85-100. And if you want to give some outcomes more weight than others, do so. For example, you can double values from solve systems algebraically.
Averaging
Conversations about averaging do not always offer nuance. The takeaway can be that averaging is just… wait for it… mean. Averaging across different outcomes–see above–is more than okay. It’s averaging within the same outcome that can be punitive. Let’s revisit the gradebook:
Gradebook at time of first Learning Update
For the sake of simplicity, I skipped a crucial step. These letters are not single data points. For example, prior to “it’s time to report out,” Denise’s “P” on the third learning outcome might have been “Em, Em, D, P, P.” Averaging would drag Denise down to Developing; she’d be stuck to her initial struggles. In the end, Denise demonstrated–successively–a Proficient level of understanding in relation to this learning outcome. That’s what matters, that’s what counts.
The fact that she didn’t know how to do something in the beginning is expected–she is learning, not learned, and she shouldn’t be punished for her early-not-knowing.
There is a sentiment in BC that using tests and quizzes is an outdated assessment practice. However, these are straightforward tools for finding out what students know and can do. So long as students face learning standards like solve systems of linear equations algebraically, test items like “Solve: ; ” are authentic. Rather than eliminate unit tests, teachers can look at them through different lenses; a points-gathering perspective shifts to a data-gathering one. Evidence of student learning can take multiple forms (i.e., products, observations, conversations). In this post I will focus on products, specifically unit tests, in part to push back against the sentiment above.
In the previous post, I constructed proficiency scales that describe what students know at each level. These instruments direct the next standards-based assessment practice: designing assessment items. Items can (1) target what students know at each proficiency level or (2) allow for responses at all levels.
Target What Students Know at Each Level
Recall that I attached specific questions to my descriptors to help students understand the proficiency scales:
This helps teachers too. Teachers can populate a test with similar questions that reflect a correct amount of complexity at each level of a proficiency scale. Keep in mind that these instruments are intended to be descriptive, not prescriptive. Sticking too close to sample questions can emphasize answer-getting over sense-making. Questions that look different but require the same depth of knowledge are “fair game.” For example:
Prompts like “How do you know?” and “Convince me!” also prioritize conceptual understanding.
Allow For Responses at All Levels
Students can demonstrate what they know through questions that allow for responses at all levels. For example, a single open question such as “How are 23 × 14 and (2x + 3)(x + 4) the same? How are they different?” can elicit evidence of student learning from Emerging to Extending.
Nat Banting’s Menu Math task from the first post in this series is an example of a non-traditional assessment item that provides both access (i.e., a “low-threshold” of building a different quadratic function to satisfy each constraint) and challenge (i.e., a “high-ceiling” of using as few quadratic functions as possible). A student who knows that two negative x-intercepts pairs nicely with vertex in quadrant II but not with never enters quadrant III demonstrates a sophisticated knowledge of quadratic functions. These items blur the line between assessment and instruction.
Note that both of these items combine content (“operations with fractions” and “quadratic functions”) and competencies (i.e., “connect mathematical concepts to one another” and “analyze and apply mathematical ideas using reason”). Assessing content is my focus in this series. Still, I wanted to point out the potential to assess competencies.
Unit Tests
Teachers can arrange these items in two ways: (1) by proficiency level then learning outcome or (2) by learning outcome then proficiency level. A side-by-side comparison of the two arrangements:
Teachers prefer the second layout–the one that places the learning outcome above the proficiency levels. I do too. Evidence of learning relevant to a specific standard is right there on single page–no page flipping is required to reach a decision. An open question can come before or after this set. The proficiency-level-above-learning-outcome layout works if students demonstrate the same proficiency level across different learning outcomes. They don’t. And shouldn’t.
There’s room to include a separate page to assess competency learning standards. Take a moment to think about the following task:
What could equations ① and ② have been? What else? How do you know?
Initially, I designed this task to elicit Extending-level knowledge of solve systems of linear equations algebraically. In order to successfully “go backwards,” a student must recognize what happened: equivalent equations having opposite terms were made. The p-terms could have been built from 5p and 2p. This gives for ① and for ②. (I’m second-guessing that this targets only Extending; for ① and for ② works too.) This task also elicits evidence of students’ capacities to reason and to communicate–two of the curricular competencies.
Teacher Reflections
Many of the teachers who I work with experimented with providing choice. Students self-assessed their level of understanding and decided what evidence to provide. Most of these teachers asked students to demonstrate two proficiency levels (e.g., the most recent level achieved and one higher). Blank responses no longer stood for lost points.
Teachers analyzed their past unit tests. They discovered that progressions from Emerging to Proficient (and sometimes Extending) were already in place. Standards-based assessment just made them visible to students. Some shortened their summative assessments (e.g., Why ask a dozen Developing-level solve-by-elimination questions when two will do?).
The shift from grading based on data, not points, empowered teachers to consider multiple forms (i.e., conversations, observations, products) and sources (e.g., individual interviews, collaborative problem solving, performance tasks) of evidence.
In my next post, I’ll describe the last practice: Determining Grades (and Percentages). Again, a sneak peek:
Update
Here’s a sample unit test populated with questions similar to those from a sample proficiency scale:
Note that Question 18 addresses two content learning standards: (1) solve systems of linear equations graphically and (2) solve systems of linear equations algebraically. Further, this question addresses competency learning standards such as Reasoning (“analyze and apply mathematical ideas using reason”) and Communicating (“explain and justify mathematical ideas and decisions”). The learning standard cells are intentionally left blank; teachers have the flexibility to fill them in for themselves.
Note that Question 19 also addresses competencies. The unfamiliar context can make it a problematic problem that calls for (Problem) Solving. “Which window has been given an incorrect price?” is a novel prompt that requires Reasoning.
These two questions also set up the possibility of a unit test containing a collaborative portion.
[E]valuation is a double edged sword. When we evaluate our students, they evaluate us–for what we choose to evaluate tells our students what we value. So, if we value perseverance, we need to find a way to evaluate it. If we value collaboration, we need to find a way to evaluate it. No amount of talking about how important and valuable these competencies are is going to convince students about our conviction around them if we choose only to evaluate their abilities to individually answer closed skill math questions. We need to put our evaluation where our mouth is. We need to start evaluating what we value.
Liljedahl, P. (2021). Building thinking classrooms in mathematics, grades K-12: 14 teaching practices for enhancing learning. Corwin.
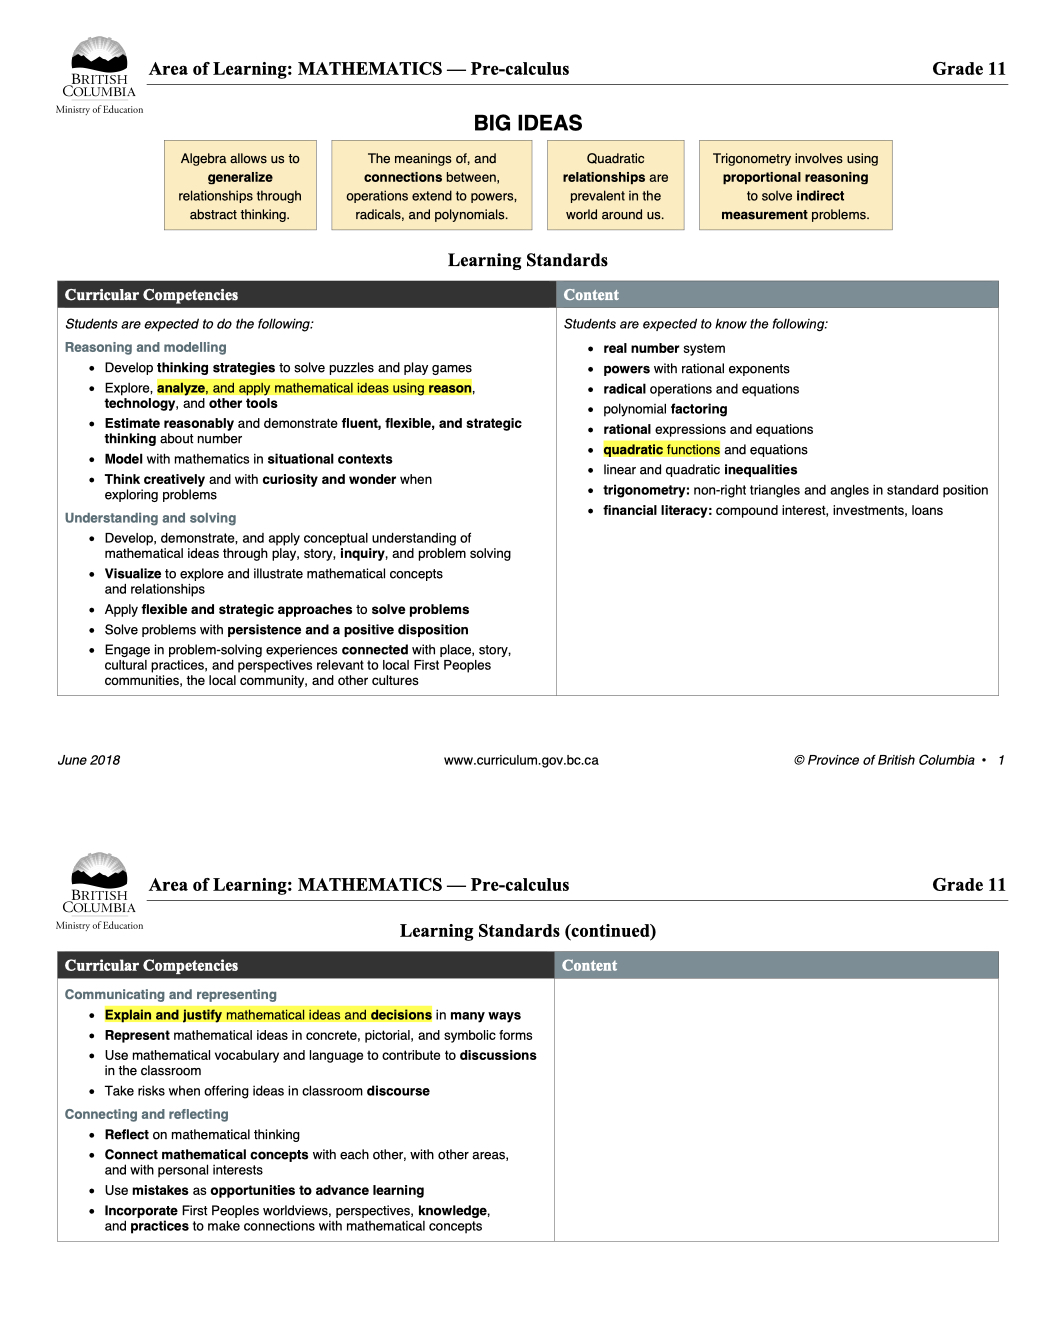
BC’s reporting order requires teachers of Grades K-9 to use proficiency scales with four levels: Emerging, Developing, Proficient, and Extending. Teachers of Grades 10-12 may use proficiency scales but must provide letter grades and percentages. Proficiency scales help communicate to students where they are and where they are going in their learning. But many don’t. When constructing these instruments, I keep three qualities in mind…
Descriptive, Positive, Progressive and Additive
Descriptive
BC’s Ministry of Education defines Emerging, Developing, Proficient, and Extending as demonstrating initial, partial, complete, and sophisticated knowledge, respectively. Great. A set of synonyms. It is proficiency scales that describe these depths with respect to specific learning standards; they answer “No, really, what does Emerging, or initial, knowledge of operations with fractions look like?” Populating each category with examples of questions can help students–and teachers–make sense of the descriptors.
Positive
Most scales or rubrics are single-point posing as four. Their authors describe Proficient, that’s it. The text for Proficient is copied and pasted to the Emerging and Developing (or Novice and Apprentice) columns. Then, words such as support, some, and seldom are added. Errors, minor (Developing) and major (Emerging), too. These phrases convey to students how they come up short of Proficient; they do not tell students what they know and can do at the Emerging and Developing levels.
Progressive and Additive
BC’s Ministry of Education uses this phrase to describe profiles of core competencies: “[Profiles] are progressive and additive, and they emphasize the concept of expanding and growing. As students move through the profiles, they maintain and enhance competencies from previous profiles while developing new skills.”
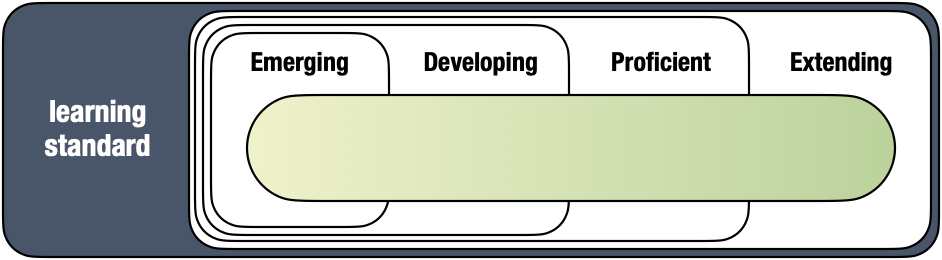
I have borrowed this idea and applied it to content learning standards. It was foreshadowed by the graphic organizer at the end of my previous post: Extending contains Proficient, Proficient contains Developing, and Developing contains Emerging. (Peter Liljedahl calls this backward compatible.) For example, if a student can determine whole number percents of a number (Proficient), then it is assumed that they can also determine benchmark percents (i.e., 50%, 10%) of a number (Emerging). A move from Emerging to Proficient reflects new, more complex, knowledge, not greater independence or fewer mistakes. Students level up against a learning standard.
Emerging and Extending
The meanings of two levels–Emerging to the left and Extending to the right–are open to debate. Emerging is ambiguous, Extending less so. Some interpretations of Extending require rethinking.
Emerging
“Is Emerging a pass?” Some see Emerging as a minimal pass; others interpret “initial understanding” as not yet passing. The MoE equivocates: “Every student needs to find a place on the scale. As such, the Emerging indicator includes both students at the lower end of grade level expectations, as well as those before grade level expectations. […] Students who are not yet passing a given course or learning area can be placed in the Emerging category.” Before teachers can construct proficiency scales that describe Emerging performance, they must land on a meaning of Emerging for themselves. This decision impacts, in turn, the third practice of a standards-based approach, designing assessment items.
Extending
A flawed framing of Extending persists: above and beyond. Above and beyond can refer to a teacher’s expectations. The result: I-know-it-when-I-see-it rubrics. “Wow me!” isn’t descriptive.
Above and beyond can also refer to a student’s grade level. Take a closer look at the MoE’s definition of Extending: “The student demonstrates a sophisticated understanding of the concepts and competencies relevant to the expected learning [emphasis added].” It is Math 6 standards, not Math 8 standards, that set forth the expected learning in Math 6. When reaching a decision about proficiency in relation to a Math 6 outcome, it is unreasonable–and nonsensical–to expect knowledge of Math 8 content.
Characterizing Extending as I can teach others is also problematic. Explaining does not ensure depth; it doesn’t raise a complete understanding of a concept to a sophisticated understanding. Further, I can teach others is not limited to one level. A student may teach others at a basic complexity level. For example, a student demonstrates an initial understanding of add and subtract fractions when they explain how to add proper fractions with the same denominator.
Example: Systems of Linear Equations
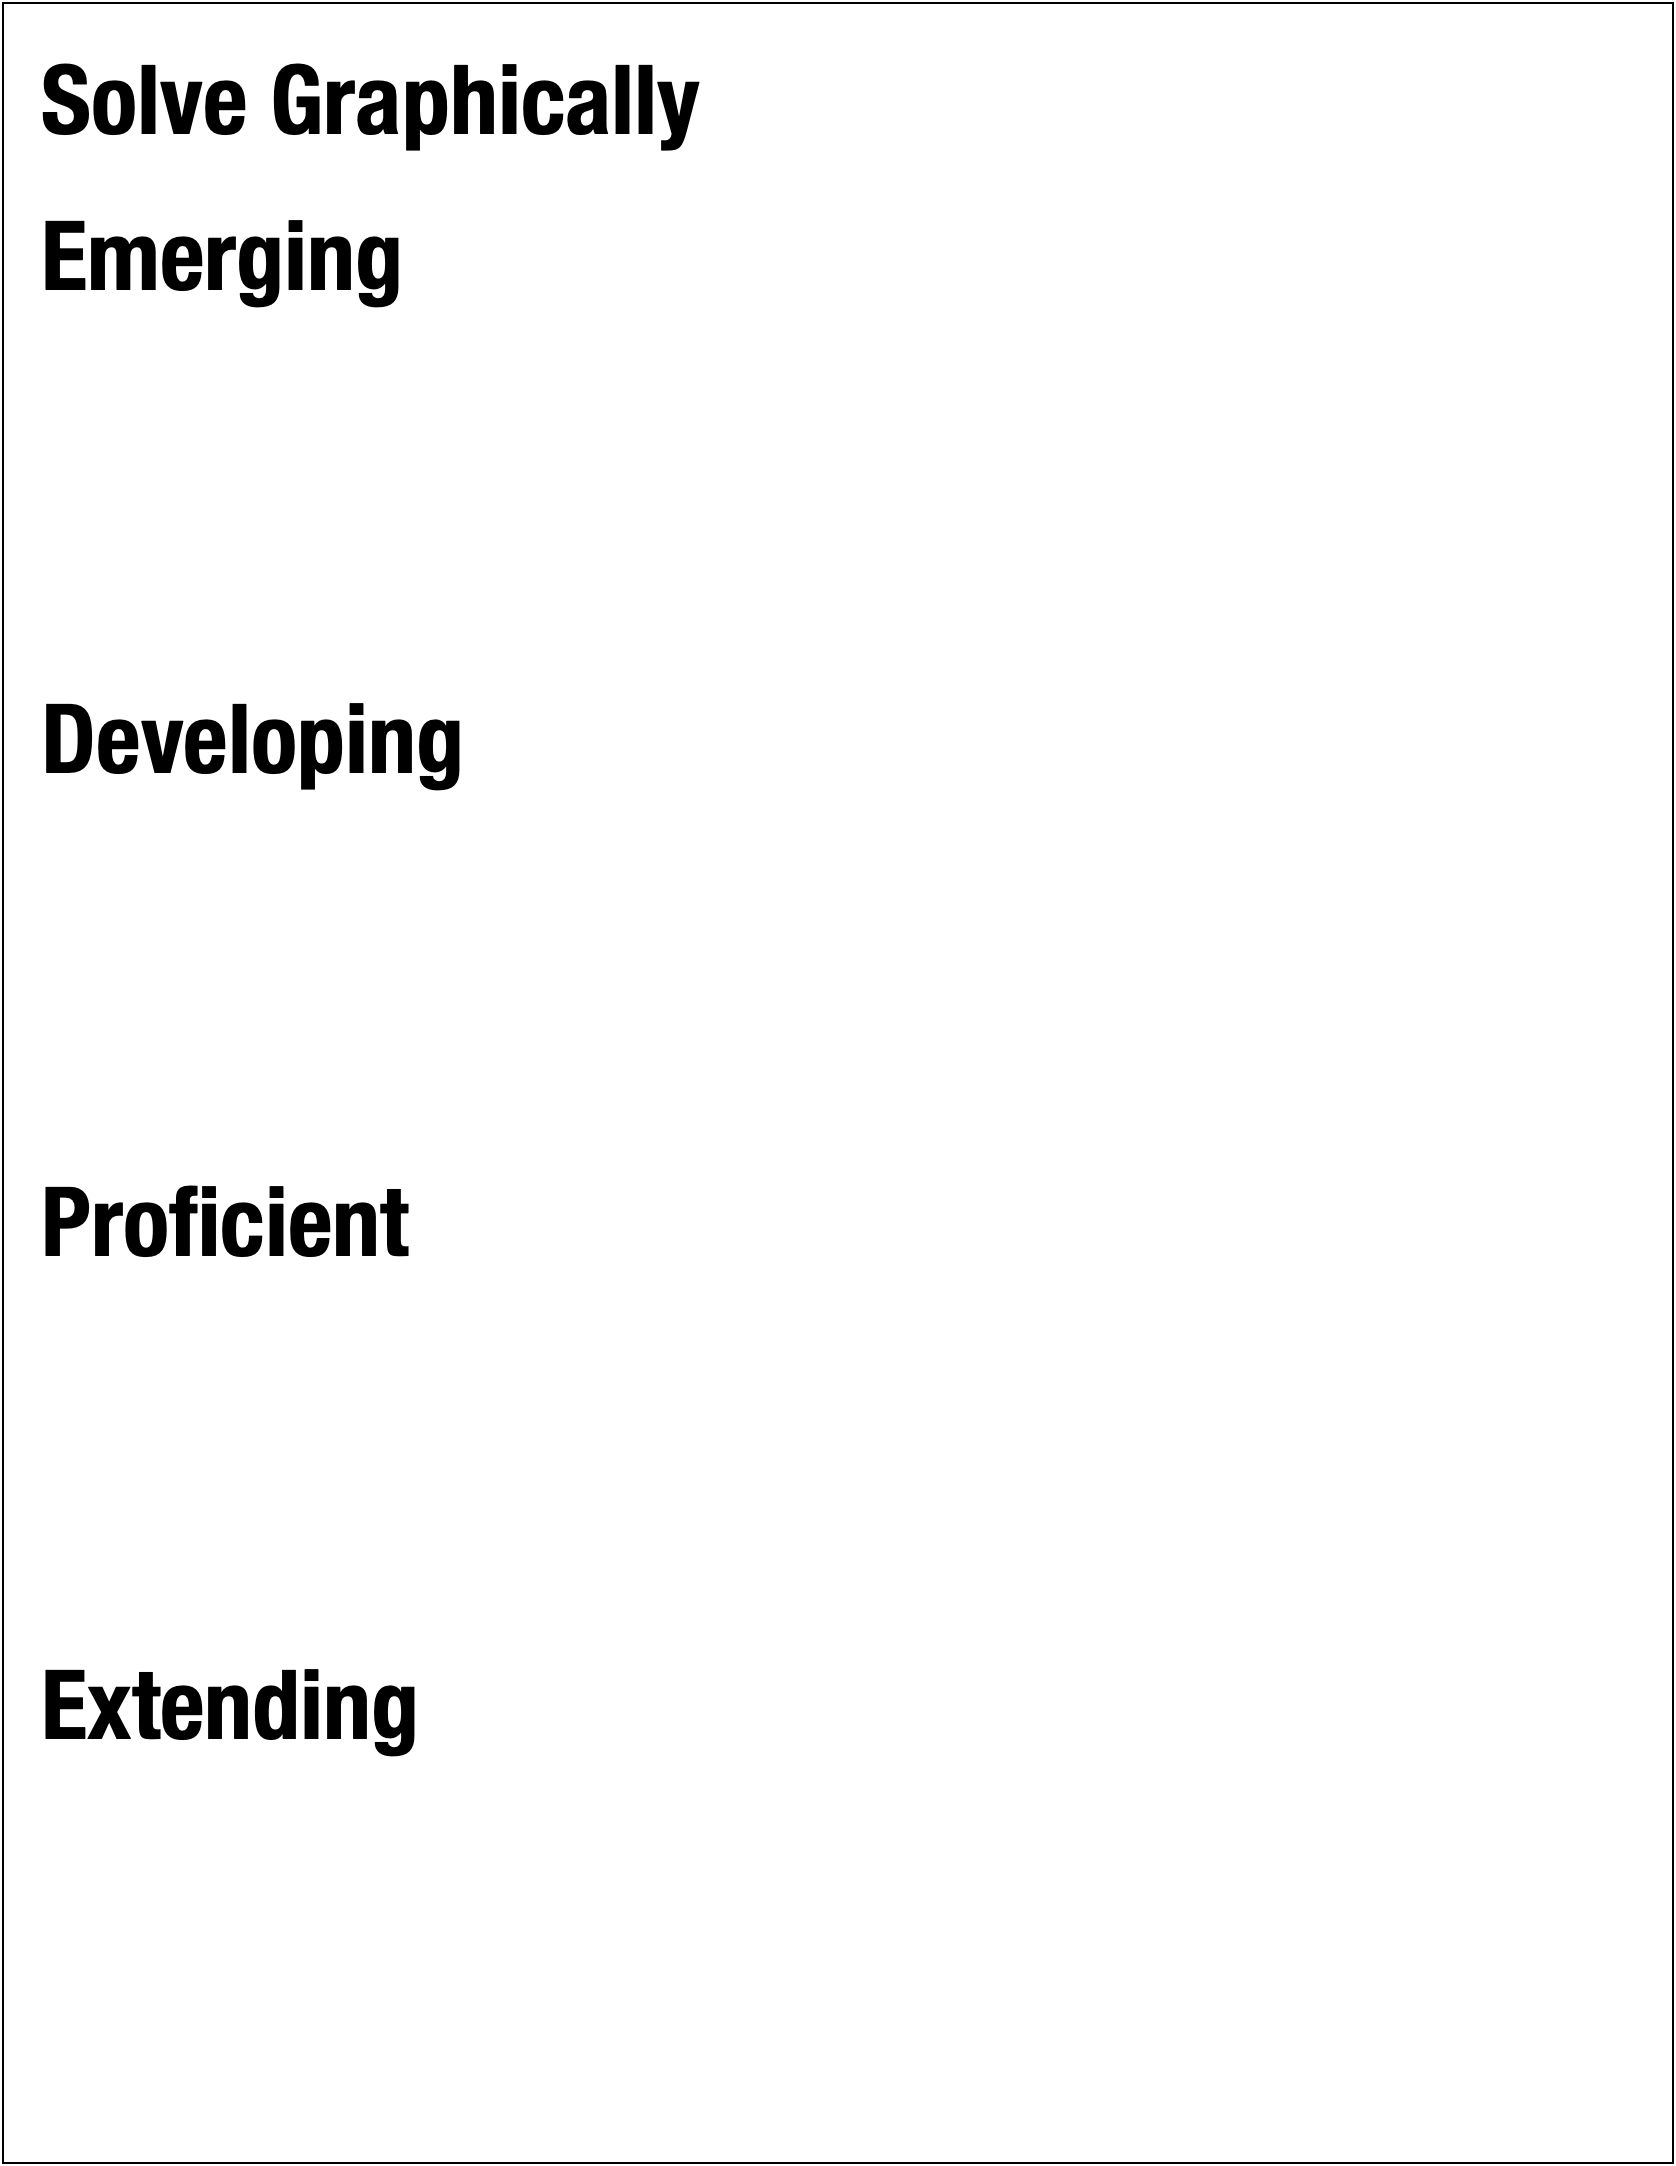
In my previous post, I delineated systems of linear equations as solve graphically, solve algebraically, and model and solve contextual problems. Below, I will construct a proficiency scale for each subtopic.
Note that I’ve attached specific questions to my descriptors. My text makes sense to me; it needs to make sense to students. Linear, systems, model, slope-intercept form, general form, substitution, elimination–all of these terms are clear to teachers but may be hazy to the intended audience. (Both logarithmic and sinusoidal appear alongside panendermic and ambifacient in the description of the turbo-encabulator. Substitute nofer trunnions for trigonometric identities in your Math 12 course outline and see if a student calls you on it on Day 1.) The sample questions help students understand the proficiency scales: “Oh yeah, I got this!”
Some of these terms may not make sense to my colleagues. Combination, parts-whole, catch-up, and mixture are my made-up categories of applications of systems. Tees and hoodies are representative of hamburgers and hot dogs or number of wafers and layers of stuf. Adult and child tickets can be swapped out for dimes and quarters or movie sales and rentals. The total cost of a gas vehicle surpassing that of an electric vehicle is similar to the total cost of one gym membership or (dated) cell phone plan overtaking another. Of course, runner, racing car and candle problems fall into the catch-up category, too. Textbooks are chock full o’ mixed nut, alloy, and investment problems. I can’t list every context that students might come across; I can ask “What does this remind you of?”
My descriptors are positive; they describe what students know, not what they don’t know, at each level. They are progressive and additive. Take a moment to look at my solve-by-elimination questions. They are akin to adding and subtracting quarters and quarters, then halves and quarters, then quarters and thirds (or fifths and eighths) in Math 8. Knowing implies knowing .
Emerging is always the most difficult category for me to describe. My Emerging, like the Ministry’s, includes not yet passing. I would welcome your feedback!
Describing the Extending category can be challenging, too. I’m happy with my solve graphically description and questions. I often lean on create–or create alongside constraints–for this level. I’m leery of verb taxonomies; these pyramids and wheels can oversimplify complexity levels. Go backwards might be better. Open Middle problems populate my Extending columns across all grades and topics.
My solve algebraically… am I assessing content (i.e., systems of linear equations) or competency (i.e., “Explain and justify mathematical ideas and decisions”)? By the way, selecting and defending an approach is behind my choice to not split (👋, Marc!) substitution and elimination. I want to emphasize similarities among methods that derive equivalent systems versus differences between step-by-step procedures. I want to bring in procedural fluency:
Procedural fluency is the ability to apply procedures accurately, efficiently, and flexibly; to transfer procedures to different problems and contexts; to build or modify procedures from other procedures; and to recognize when one strategy or procedure is more appropriate to apply than another.
Note that my model and solve contextual problems is described at all levels. Apply does not guarantee depth of knowledge. Separating problem solving–and listing it last–might suggest that problem solving follows building substitution and elimination methods. It doesn’t. They are interweaved. To see my problem-based approach, watch my Systems of Linear Equations videos from Surrey School’s video series for parents.
Next up, designing assessment items… and constructing proficiency scales has done a lot of the heavy lifting!
For several years, standards-based assessment (SBA) has been the focus of much of my work with Surrey teachers. Simply put, SBA connects evidence of student learning with learning standards (e.g., “use ratios and rates to make comparisons between quantities”) rather than events (“Quiz 2.3”). The change from gathering points to gathering data represents a paradigm shift.
In this traditional system, experience has trained students to play the game of school. Schools dangle the carrot (the academic grade) in front of their faces and encourage students to chase it. With these practices, schools have created a culture of compliance. Becoming standards based is about changing to a culture of learning. “Complete this assignment to get these points” changes to “Complete this assignment to improve your learning.” […] Educators have trained learners to focus on the academic grade; they can coach them out of this assumption.
In BC, content learning standards describe what students know and curricular competency learning standards describe what students can do. Describe is generous–more like list. In any mathematical experience a student might “bump into” both content and competency learning standards. Consider Nat Banting’s Quadratic FunctionsMenu Math task:
Think about the following ten “design specifications” of quadratic functions:
A.
Two negative x-intercepts
B.
Vertex in quadrant II
C.
Never enters quadrant III
D.
Vertex on the y-axis
E.
Positive y-intercept
F.
No x-intercepts
G.
Never enters quadrant I
H.
Has a minimum value
I.
Horizontally stretched
J.
Line of symmetry enters quadrant IV
You could build ten different quadratic functions to satisfy these ten different constraints.
Instead, build a set of as few quadratic functions as possible to satisfy each constraint at least once. Write your functions in the form y = a(x − p)2 + q.
Which constraints pair nicely? Which constraints cannot be paired?
Is it possible to satisfy all ten constraints using four, three, or two functions?
Describe how and why you built each function. Be sure to identify which functions satisfy which constraints.
Students activate their knowledge of quadratic functions. In addition, they engage in several curricular competencies: “analyze and apply mathematical ideas using reason” and “explain and justify mathematical ideas and decisions,” among others. Since the two are interwoven, combining competencies and content (i.e., “reason about characteristics of quadratic functions”) is natural when thinking about a task as a learning activity. However, from an assessment standpoint, it might be helpful to separate the two. In this series, I will focus on assessing content.
The content learning standard quadratic functions and equations is too broad to inform learning. Quadratic functions–nevermind functions and equations–is still too big. A student might demonstrate Extending knowledge of quadratic functions in the form y = a(x − p)2 + q but Emerging knowledge of completing the square, attain Proficient when graphing parabolas but Developing when writing equations.
Operations with fractions names an entire unit in Mathematics 8. Such standards need to be divided into subtopics, or outcomes. For example, operations with fractions might become:
add and subtract fractions
multiply and divide fractions
evaluate expressions with two or more operations on fractions
solve contextual problems involving fractions
Teachers can get carried away breaking down learning standards, differentiating proper from improper fractions, same from different denominators, and so on. These differences point to proficiency levels, not new outcomes. Having too many subtopics risks atomizing curriculum. Further, having as many standards as days in the course is incompatible with gathering data over time. I aim for two to four (content) outcomes per unit.
In Foundations of Mathematics and Pre-calculus 10, systems of linear equations can be delineated as:
solve graphically
solve algebraically
model and solve contextual problems
My solve algebraically includes both substitution and elimination. Some of my colleagues object to this. No worries, separate them.
In my next post, I’ll describe constructing proficiency scales to differentiate complexity levels within these learning standards. Here’s a sneak peek:
The puck drops next week on the 2021-22 NHL season. As a hockey fan and mathematical modelling aficionado, I’m looking forward to watching Alex Ovechkin chase Wayne Gretzky’s goal record–a record I used to think was unbreakable. I was in good company:
TSN posted the above back in November of last year. Since then, Ovi went on to do two things:
score 24 more goals (in a COVID-shortened season)
sign a five-year, $47.5 million contract extension with the Caps
The question is less “Will ‘The Great Eight’ catch ‘The Great One’?” and more “When will he do it?” Still fun to watch but not as interesting as “Will he or won’t he?” It was uncertainties–since made certain by the offseason signing–that made it interesting, made it open to debate. There’s a takeaway for math class here.
Permit me to time travel. It’s November, 2020. Our known knowns, at that time:
Wayne Gretzky is the leading goal scorer in NHL history
Gretzky played in 1487 games (20 seasons)
Gretzky scored 894 goals in his career
Gretzky retired in ’99; he was 38
Alex Ovechkin has played in 1152 games (15 seasons)
Ovechkin sits at 706 goals
Ovi’s contract will expire at the end of the 2020-21 season; he will be 35
Known unknowns:
Ovechkin’s future goal-scoring pace
years remaining in Ovi’s career
where those years will be spent (i.e., NHL or KHL)
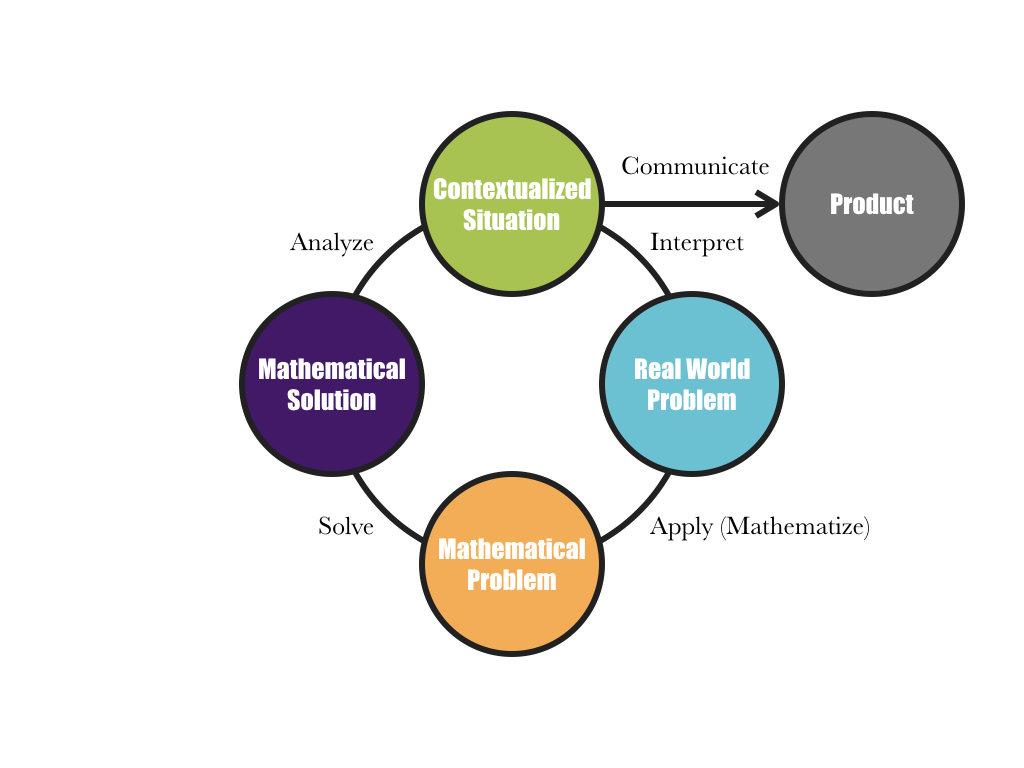
In BC, teachers–in all areas of learning!–are being asked to embed numeracy tasks in their classrooms. Numeracy tasks are solved using five processes–Interpret, Apply (Mathematize), Solve, Analyze, and Communicate. Outside of BC, this is called the mathematical modelling cycle.
Interpret
Here’s how BC defines Interpret:
Students are able to read and decode a range of situational contexts by identifying the real-world problems to be solved. Given insufficient or excess information, students will need to decide what information is relevant to solve the problem. This process is about students making decisions. Situational contexts may require students to identify constraints and ambiguities, and decide on next steps.
At this stage, students must understand the scenario and determine what the important variables are. Students must also make–and state–assumptions. Here, they are required to make assumptions about my unknowns above. Unfortunately–for teachers not hockey fans–Ovechkin’s new contract resolves some of these ambiguities.
Apply (Mathematize)
Students are able to identify and activate their mathematical understanding by translating real-world problems into mathematical problems (mathematizing). This process involves choosing a mathematical tool, determining how to organize the information, and creating relationship(s) in order to represent the real-world problem. (Students will need to flexibly use mathematical tools for a host of real- world problems.)
Here, that mathematical tool is likely averages/unit rates. “Likely” because students make the call about what calculations or methods to use. They may decide to use linear functions, which gives a clearer picture of the problem:
Students are able to solve mathematical problems through a variety of approaches and representations. Students may also need to check mathematical solutions to determine if their solutions make mathematical sense.
Ovechkin trails Gretzky by 188 goals (894 – 706). Again, talking November, 2020. We can play with possibilities. For example, if Ovi goes on to play four more seasons, then he’d need to score more than 47 goals per season. Or, if he continues to score at about 0.6 goals per game, then he’d need to play in a little over 300 more games.
(For readability, I’m jumbling Solve and Analyze. Solve looks more like or . Math minus context.)
Analyze
Students are able to interpret mathematical solutions in context, such that the solutions are reasonable within the situational contexts. Students may need to assess the practicality and possible limitations of solutions, identify possible improvements to an approach, or identify other situations to which solutions can be applied. In doing so, students consider how contextual factors may affect the results. For example, students may reflect on their solutions to assess risks and address social, ethical, and environmental implications.
Students do not need to be hockey fans to check if their mathematical solutions make sense in this context. A search on NHL dot com and some familiarity with scoring being part of sportsball will suffice. You don’t have to be Chi-Chi Rodríguez to approach Fawn’s putt-putt problem.
Communicate
Students are able to clearly and precisely construct valid logical arguments to defend their decisions and assumptions, explain the tools and approaches they used, and present their solutions in context. This may require students to make recommendations and use a variety of ways (e.g., tables, graphs, diagrams, equations, symbols) to visibly represent their thinking and solution.
Some students might recognize the flaws in considering averages, especially for a skater approaching 40. For example, suppose Ovechkin plays six more seasons and averages 32 goals per season. At first glance, this feels reasonable. But it hides that he will need to outperform the average at the beginning to offset a decline at the end. It might be better to consider–and discuss–the set {42, 40, 35, 30, 25, 20}.
* * ** *** ***** ******** *************
“Ruins” in this post’s title might be a tad rough. Taking away students’ control of an important variable–the number of seasons Ovechkin will play–might push this from numeracy/modelling task to word problem (if one skate wasn’t hanging the line before). It limits how they can tinker with relationships between quantities. Still, there’s space for multiple strategies and justifications (e.g., goals per season or goals per game); there’s an opportunity for students to develop mathematical autonomy.
Alex Ovechkin is already the greatest goal-scorer in NHL history. Attaining the record is beside the point. This argument demands a different mathematical model: era-adjusted goals. But that’s for another time…
Recommended
Wolf, N. B. (2015). Modeling with mathematics: Authentic problem solving in middle school. Heinemann.
In my previous post, I shared some of the principles that guided Marc and me when creating a series of math videos for parents (Mathematics 6 & 7; 8–10): make it visual, make it conceptual, and make it inviting. In this way, we also set out to make these videos representative of math class. It was our hope that they presented parents with a view into their child’s classroom (“window”). Further, we hoped that Surrey teachers saw their classrooms in what was reflected (“mirror”). In that spirit, several videos in this summer’s collection included an open-middle problem.
[M]ost math problems begin with everyone having the same problem and working toward the same answer. As a result, the beginning and ending are closed. What varies is the middle. Sometimes a problem’s instructions tell students to complete a problem using a specific method (a closed middle). Other times, there are possibly many ways to solve the problem (an open middle). Problems with open middles tend to be much more interesting and lead to richer conversations.
Robert Kaplinsky
Visual depiction of problems with a closed beginning, open middle, and closed ending from Dan Meyer
This use of open-middle to describe problems has always irked me. There, I said it. To me, open- vs. closed-middle is not a characteristic of a problem itself. Robert argues that a problem’s instructions can close a problem’s middle. Agreed! But I go a step further. There are other ways through which students are told to use a specific method. It’s us. For example, consider a boilerplate best-buy problem. The middle is wide open! Doubling, scaling up, common multiples, unit rates — dollars per can or cans per dollar — and marginal rates are all viable strategies. However, we close the middle when we give this task after demonstrating how to use unit prices to determine best deals (i.e., “now-you-try-one” pedagogy). If students — and teachers! — believe that mathematics is about plucking numbers to place into accepted procedures then they are unlikely to experience the rich “open-middleness” of this task, regardless of its instructions. It’s no accident that the book’s introduction is titled “What Does an Open Middle Classroom Look Like?”
Most of the problems posted on the open middle site involve number — or digit — tiles. But I get why Robert didn’t go with “Number Tile Math.” The boxes in 25 × 32 = ⬚⬚⬚ and 63 − 28 = ⬚⬚ give each a fill-in-the-blanks answer-getting feel. The routine nature misses the problem-solving mark (despite their open middles). So, “open-middle” as an adjective for problems it is. Besides, math class could use more openness, which needn’t come at the end for problems to be interesting and conversations to be rich.
When I look at an Open Middle problem from the site, the mathematical goal of the teacher who created the problem isn’t always clear to me. (The same is true, by the way, of wodb.ca.) What is the deep conceptual understanding that they anticipate their students will develop by working on the problem? What ideas will emerge? What misconceptions might be addressed? Throughout Open Middle Math, Robert describes how Open Middle problems can give us X-ray vision into our students’ mathematical understanding. Similarly, he provides readers with X-ray vision into his thinking during the process of creating these problems. Below, I’ll share a few of the open-middle problems from our video series (plus some that ended up on the cutting room floor) as well as a peek behind the curtain into my thinking.
I think that the number tiles add an element of play to these problems. The tiles are forgiving. Make a mistake? No biggie, just move ’em around. (The decision to show an initial misstep in the first animation above was deliberate.) This upholds our third principle: make it inviting.
These two sample tasks above highlight the role of students’ prior knowledge in solving open-middle problems. My assumption here is that teachers have not “proceduralized” these problems — that students have not been provided with predetermined solution pathways (e.g., “First, list all the factors of the constant term c. Then, …”). Note the open end of the second problem. The intent of my animation is to convey that there are infinitely many solutions. The problem presents students with an opportunity to generalize.
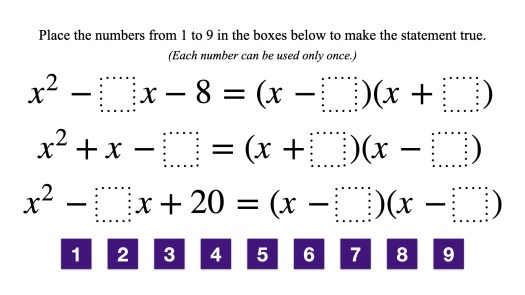
Each of these problems can be classified as Depth of Knowledge Level 2 (Skill/Concept). In both, students need a conceptual understanding of factoring x2 + bx + c where b and c are given. The second requires pattern-sniffing (or logic). I created a third problem that asks students to think about these two equations — and a third — simultaneously.
set of equations
Note that x − 4 could be a factor of each trinomial. However, students need to determine where to put 4 so that the other digits can be placed in the remaining boxes. This twist might not be enough to raise it to DOK 3 (Strategic Thinking). Roughly speaking, Robert’s DOK 2 problems involve making statements true. Sometimes it’s satisfying an equation, sometimes it’s satisfying a condition (e.g., a system of equations having no solution). Robert’s DOK 3 problems call for optimizing a result — least, greatest, closest to.
In my Math 9 Polynomials video, I pose the following open question in the style of Marian Small: Two trinomials add to 3x2 + 7x + 6. What could they be? Here’s a problem, adapted from Open Middle Math, that also tackles adding polynomials:
adding polynomials
Both tasks can help reveal students’ understanding of combining like terms and manipulating coefficients and exponents. (In Task 1, I specify that the two polynomials be trinomials. This rules out responses such as (3x2) + (7x + 6) that sidestep like terms.) Task 2 is much more likely to show what students know about additive inverses, although a small tweak to Task 1 (e.g., Two trinomials add to 3x2+ 7x + 6. What could they be?) bridges this gap.
Integers
I include one open-middle problem in the application section of each of my Math 7 integer videos:
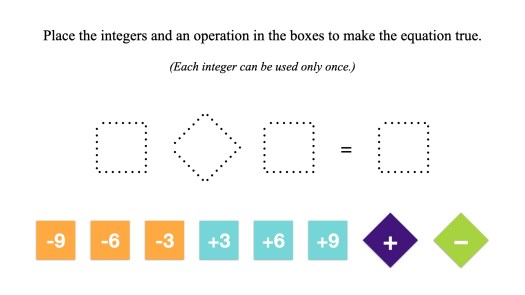
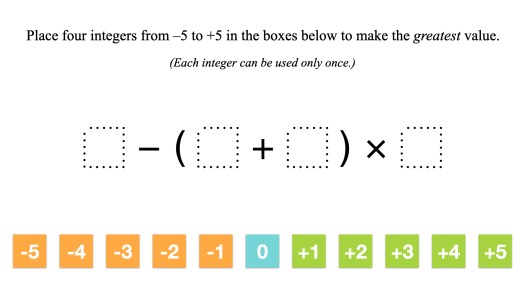
adding and subtracting integersorder of operations with integers
Note that the first is DOK 2 whereas the second is DOK 3. Maybe. I don’t want to quibble. What matters more than the differences between DOK 2 and 3 is that these questions require a deeper understanding than DOK 1 problems such as Evaluate: (−9) + (+3) or Evaluate: (+3) − [(−5) + (−4)] × (+5).
In the first video, I ask “How might finding one solution help you find more? How are some of the solutions related to one another?” These questions aren’t answered in the video — an exercise left to the viewer. Here are just some of the ideas that I would anticipate to emerge in an Open Middle classroom discussion:
addition and subtraction facts are related
e.g., (+6) + (+3) = +9 and (+9) − (+3) = +6 belong to the same “fact family”
this relationship extends from whole numbers to integers
e.g., (−6) + (−3) = −9 and (−9) − (−3) = −6 also form a fact family
subtracting a number can be thought of as adding it’s opposite
e.g., if (+6) + (+3) = +9 makes the equation true then so, too, does (+6) − (−3) = +9
swapping the number being subtracted (subtrahend) and the number it is subtracted from (minuend) changes the sign of the result (difference)
e.g., (+9) − (+3) is equal to positive 6 whereas (+3) − (+9) is equal to negative 6
Order of operations is a natural fit for optimization problems. In the second video, the intent of my answer animation is to communicate my mathematical reasoning. Once more, note that I show a couple of slight missteps and revisions to my thinking.
order of operations with integers (solution)
In addition to performing the operations in the correct order, students must think about how to maximize sums and minimize products. They must consider how subtracting a number increases the result. See one of Marc’s Math 7 decimal videos for another open-middle order of operations example.
Percents
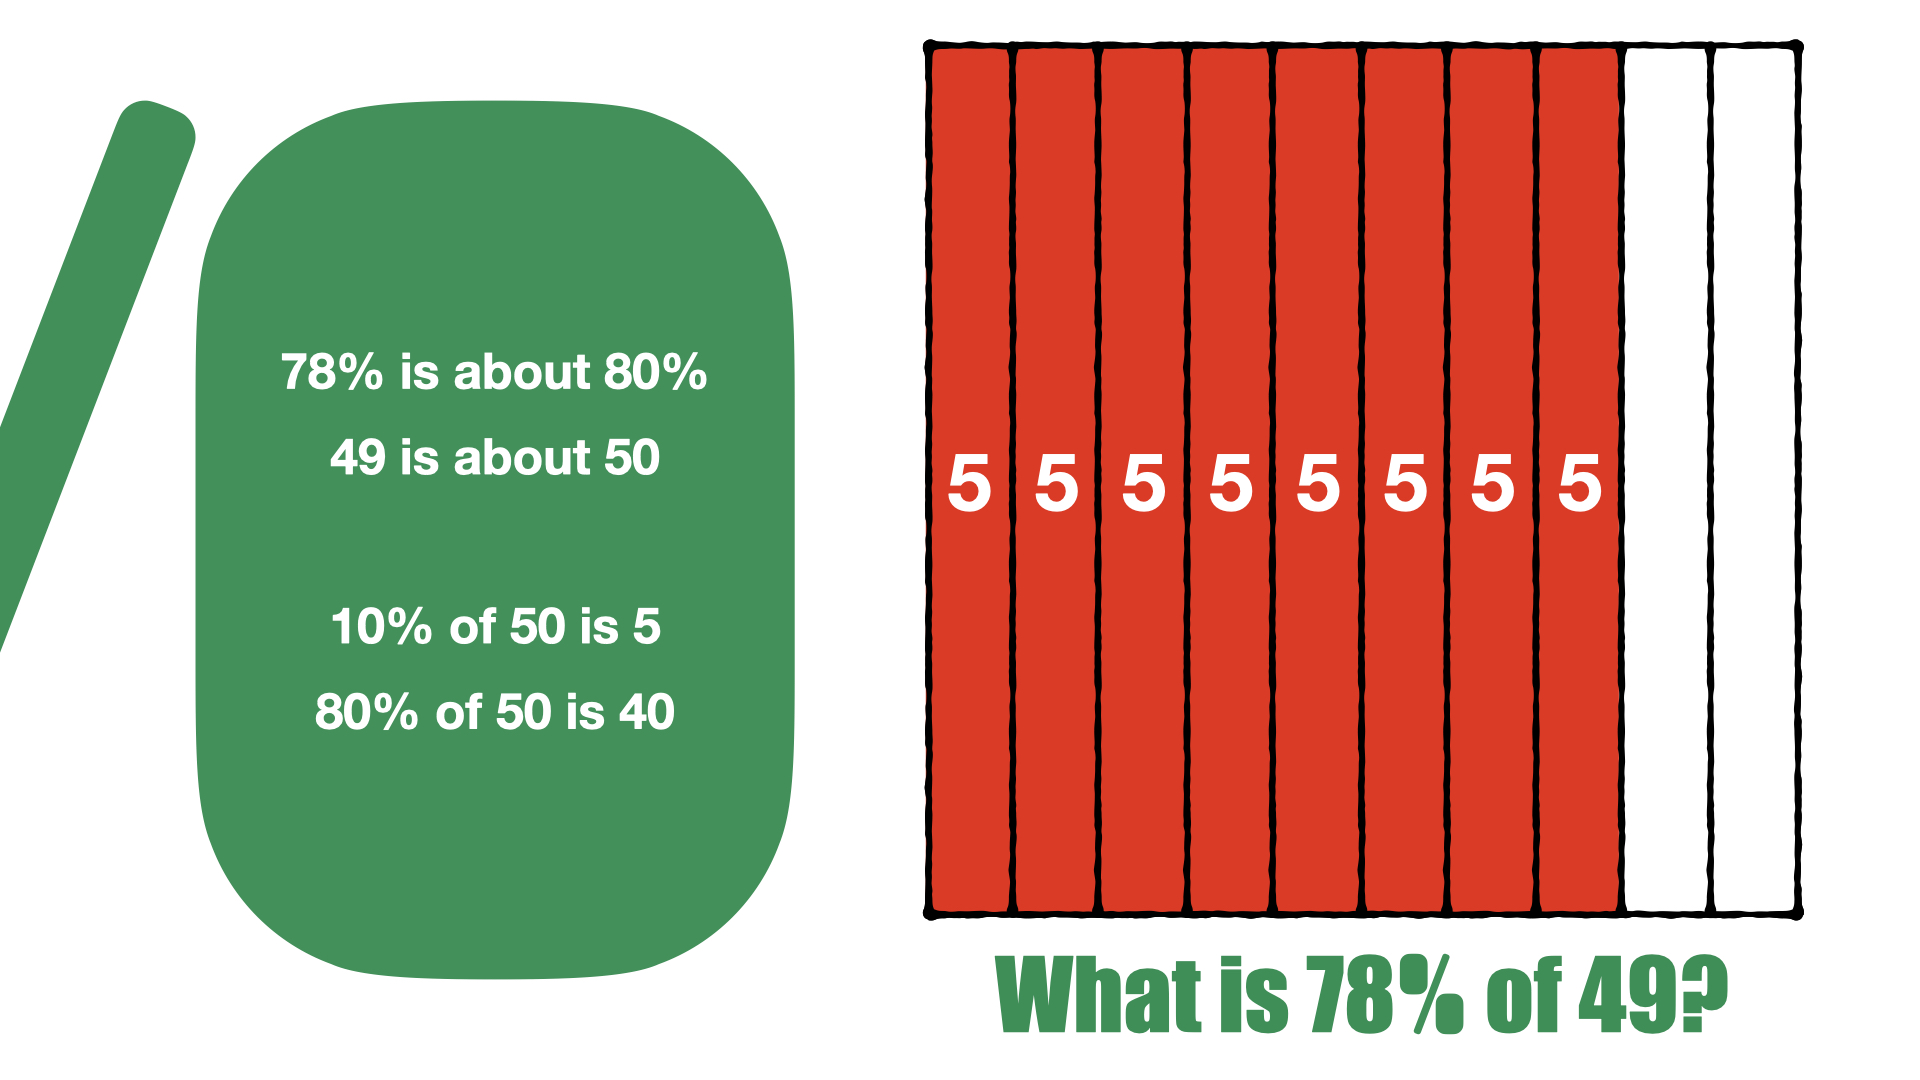
I did not include an Open Middle problem in my Math 7 Percents video. Rather, I chose to present a percents number talk: Estimate 78% of 49. Note that I show two strategies: one that makes use of quarters…
75% of 48
… and another that utilizes tenths.
80% of 50
Because there are many ways to solve this problem, it can be thought of as a having an open middle despite it not having number tiles. A third, interesting, solution pathway can be taken. Instead of 78% of 49, we can estimate 49% of 78: 50% — or one-half — of 78 is 39. The idea that x% of y is equal to y% of x should emerge from the following:
commutative percents
It’s for this reason that I did not add the constraint Each number can be used only once. You can always add it later, which should bring about doubling and halving — and tripling and “thirding”!
x% of y is equal to 2x% of y/2; x% of y is equal to kx% of y/k
I like that the double number line problem below incorporates estimation; both 20 and 25 per cent are perfectly reasonable estimates. Also, it embraces our first principle — make it visual — which is largely missing from my other open-middle examples.
I wrestle a bit with whether or not to include the “only once” constraint. Does it enhance the problem above? I guess that it necessitates more practice; disqualifying 25% of 64 is 16 does compel students to seek out 25% of 68 is 17 or 25% of 76 is 19. But concentrating on unique tens and units digits of parts and wholes is irrelevant to percents. Again, you can always add this constraint later. (Update: Check out this slick Desmos activity from @TimBrzezinski!)
What might a DOK 3 Open Middle percent problem look like? Below is a possibility — or three! — that uses Robert’s optimization approach. (I haven’t played with the dollar value amounts so treat them as placeholders.)
percent discounts
Open Middle Math is a must read that will help you implement these engaging tasks. Whether you’re new to Open Middle problems or think you know all about ’em, you’ll love the glimpse into how Robert designs opportunities for students to persevere in problem solving and for teachers to gain insights into what students really understand.
This summer, Marc and I made several videos designed to help parents understand what mathematics their children are learning. As well, we wanted to give parents a feel for how their children are learning in their math classes. We added Mathematics 6 & 7 videos to the previous summer’s 8 & 9 collection. The work of producing videos for Foundations of Mathematics and Pre-calculus 10 is well underway; I expect to add two more videos–Solving Systems of Linear Equations Graphically & Algebraically–this week. Although intended for parents, we believe that this series could be a helpful resource for teachers, especially those having to teach in an online or blended environment due to COVID-19.
In this post, I’ll share some of the principles that guided us when creating the videos. This’ll be a peek behind the curtain of interest more to educators than to parents.
Make it visual.
Math is visual. Videos are visual. So math videos should be visual. It is disappointing how often makers of digital content fail to take full advantage of visual aspects available to them. The animation of symbolic representations–line-by-line equation solving or drawing little arrows to show the distributive property–should not be the extent to which content is presented visually. It’s ballsy to sell this to educators as visual if that’s all you’ve got. By “make it visual,” I mean include images and animations that help viewers make sense of the mathematics at hand or the context in which the mathematics is situated. For example, we show that 2:3 is equivalent to 8:12 by repeatedly extending a black-red-red-red-black pattern of beads; we don’t describe two candles with different heights and different rates at which they burn, we show it–so long as we can figure out how to do it in Keynote.
Mathematics 6: Ratios & Percents (1/2)Foundations of Mathematics & Pre-calculus 10: Systems of Linear Equations (1/2)
I once watched a short video to fix an issue with my dishwasher. I carefully followed the directions, pausing the video at each step along the way. But no one is ever going to mistake me for a handyman! I don’t really understand how dishwashers work. I couldn’t connect the problem to any knowledge of the machine’s mechanical or electrical systems. If the solution shared online didn’t work, I was hooped. And even though I was successful, my procedure for fixing my dishwasher was useless for fixing my washing machine, let alone a different make and model of dishwasher. This skill–long-forgotten, by the way–didn’t transfer from one household appliance to another.
But it didn’t matter. I set out that morning to make one small repair, not become an appliance repair technician. Mathematics is different. The emphasis in math class must be on sense-making, not answer-getting. The same should be true of math videos. In our videos, we attempt to always address the why.
Conceptual understanding means seeing mathematics as a coherent whole rather than isolated procedures. Digital content can support students in developing conceptual understanding by creating opportunities for them to connect models and representations. For example, we ask learners to connect multiplying binomials to what they already know about multiplying two-digit numbers (i.e., an area model, partial products, the distributive property).
Of course, procedural fluency is important. Effective mathematics teaching focuses on the development of both conceptual understanding and procedural fluency. However, procedural fluency depends and builds on a foundation of conceptual understanding.
For example, percents are presented as fanatical comparisons to 100. No part-whole-percent triangles or is-over-of-equals-percent-over-100 cross-products here. Relating percents to decimals does not appear until grade 7. So, in our Mathematics 6 video, the emphasis is on equivalency and benchmark percents (i.e., 50%, 25%, 75%; 10%, 20%, … , 90%).
Procedural fluency includes the ability to apply procedures flexibly. Throughout each video, multiple strategies are discussed. For example, see the strategies–and representations–used in this proportional pizza problem.
To bridge conceptual understanding and procedural fluency, we try to build on learners’ own mathematical ideas. For example, before the elimination method for solving systems of linear equations is introduced, viewers are first encouraged to solve a puzzle using their intuition. Then, they are presented with a pictorial representation of a solution to a problem. It’s at this time that algebraic symbols and notation appear:
(Note: Each row and column is a sum. None of that fries times Coke nonsense!)Foundations of Mathematics & Pre-calculus 10: Systems of Linear Equations (2/2)
Of course, we can build on viewers’ own ideas only to the extent to which they engage with and participate in the learning experiences that we design. This segues into our last principle…
Make it inviting.
I think that this is the right adjective. To me, inviting goes beyond accessible.
Other times, we used open middle problems. An open middle problem may have one correct answer but multiple ways of getting it. For example, there is an arrangement–or two–of number tiles that maximizes the expression below. The animated placement of the number tiles is meant to model one strategy and includes me making missteps and backtracking as I went along.
In addition to openness, we try to hold off on introducing formal symbols and notation early. For example, Two numbers add to 12. What could they be? comes before Solve the system x + y = 12 & y = 2x. (See also Burgers, Fries, and Cokes and Tees and Hoodies above.)
We believe that learners of mathematics should be active participants rather than passive spectators. There’s a tension between this belief and video. In our videos, we put a lot of trust in parents pressing pause when prompted. It’s in these moments that they “do” math, that they play, notice and wonder, solve problems, visualize, look for patterns, make conjectures, generalize, reason, explain, connect ideas, take risks, etc. We were limited by the medium–or our tech skills within this medium.
In a mathematics classroom–be it face-to-face or remote–this tension can be resolved. And this is one reason why we’re just as, if not more, excited about teachers using these videos. At the moments when we ask viewers to pause, students could be placed in visibly random groups or breakout rooms. Teachers are not limited by our prompts–or these moments. They can observe and adapt to what’s happening with their learners in the moment and ask How else might you have solved the problem/represented your thinking? What does this remind you of? How are these the same? How are they different? What would happen if… ? etc. There’s no need to “fake it” coming out of a pause as we had to do (e.g., “You might have noticed that…”).
These videos were intended to capture the big ideas or enduring understandings or key concepts of a topic–a whole chapter or unit. Although each clocks in at about twenty minutes, it would be inappropriate to have students experience an entire video in one sitting. Instead, a task or two clipped from a downloaded video could make up one day’s learning experience.
If you find this video series helpful, we’d love to hear from you. Drop a comment, question, or complaint in the comments.
Back in September, Wendell Pierce (The Wire, Treme, Suits, Selma, Jack Ryan, …) was the guest on Marc Maron’s WTF podcast. In it, he describes what he calls “the American aesthetic”:
… Jazz is based on the emulation of human dialogue. When you’re trading fours, you’re having a conversation. And improvisation that it comes from, it’s really the American aesthetic on display. Freedom within form. You have to honour the form of the music but, as a soloist, you have the right as an individual to go as far as you want to go. We’re a nation of laws but as an American we celebrate individuality. Honour the form, honour the laws but be yourself, be free. It’s a finite amount of notes with an infinite amount of combinations. Improvisation. And then that taught me how to act. Because it’s a finite amount of words but with an infinite amount of ways of saying them and an infinite amount of ways of having those words affect you. And that’s jazz and that’s what the American aesthetic is, unique to our experience…
–Wendell Pierce
I love this! It reminds me of the relationship between freedom and constraints in mathematics. In fact, Pierce goes on to connect freedom within form to two different proofs that land on the same truth in Trigonometry class. He argues “the two can coexist” when talking about Shakespeare or stand-up. Or, more importantly, when talking about the Constitution and John Lewis or police reform. It’s quite the “coffee run” and starts at about 1:04:20 below:
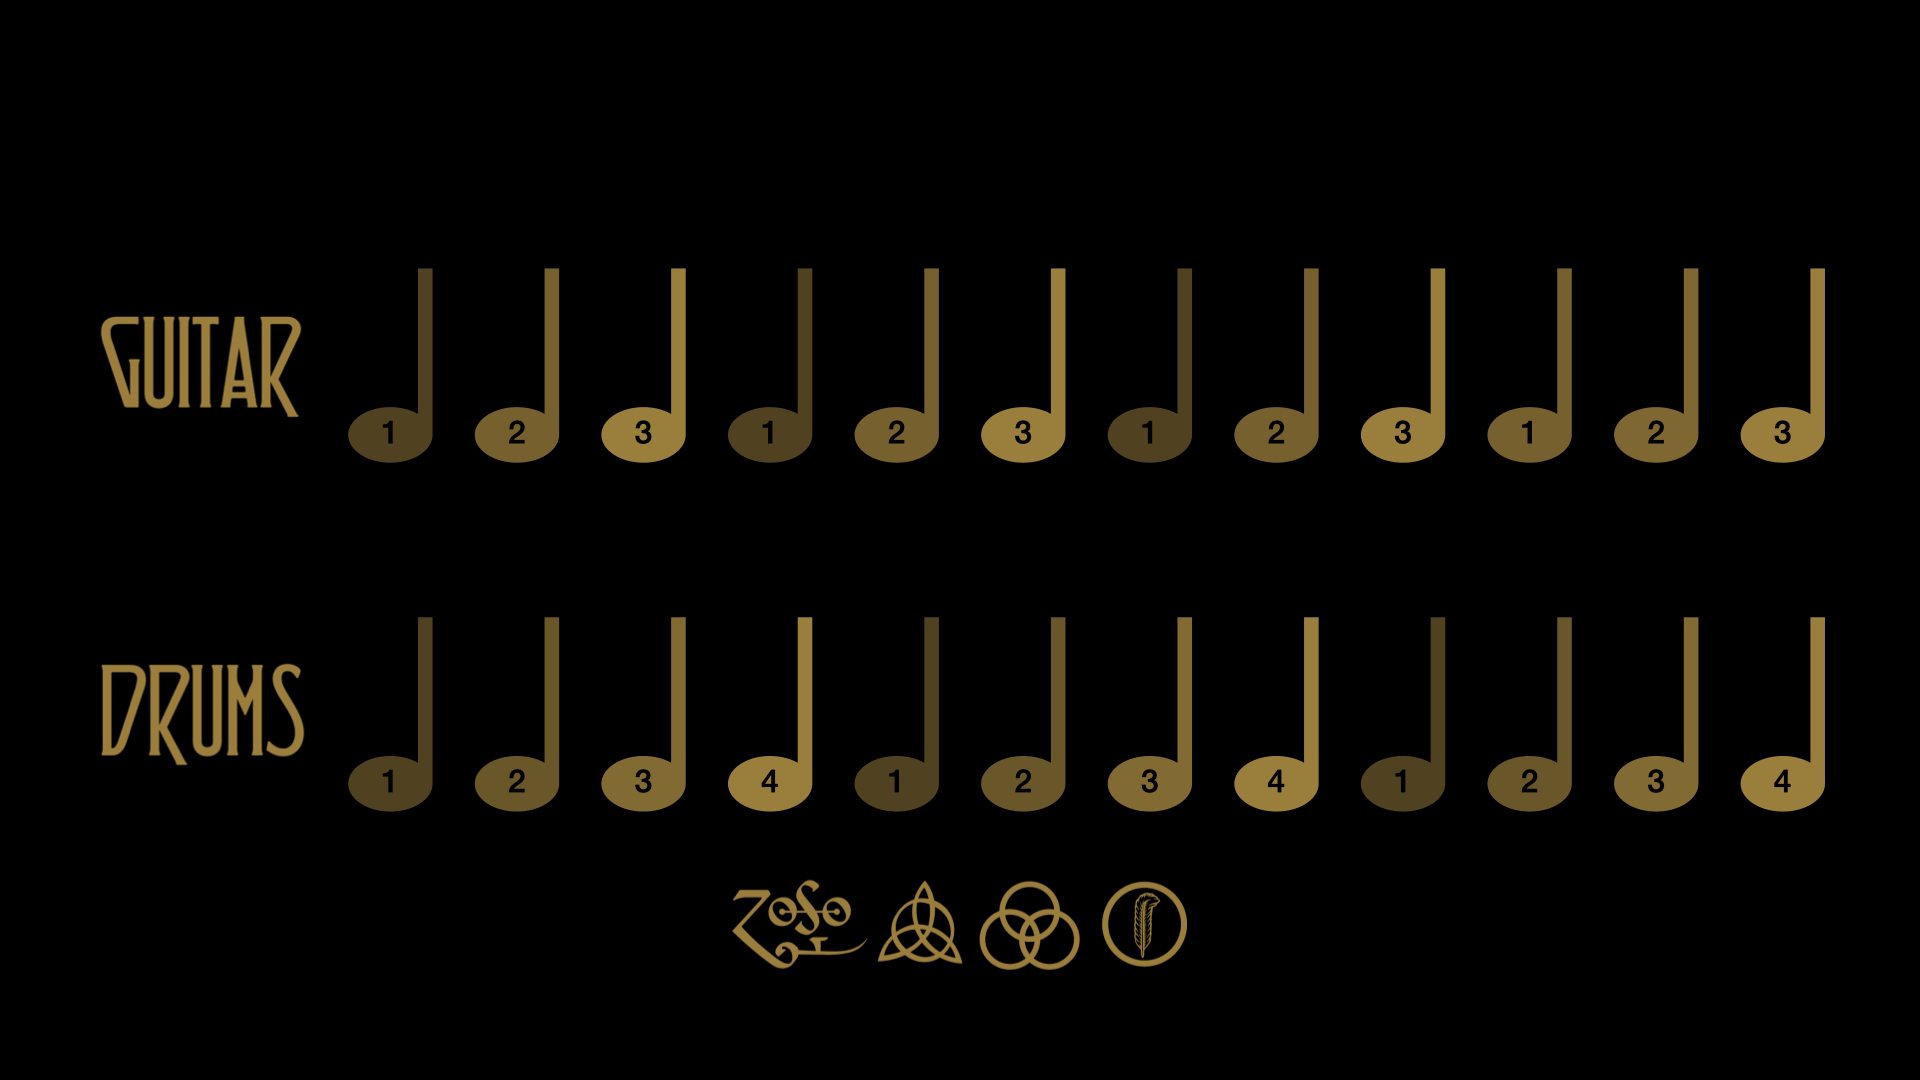
But a less significant section of his riff grabbed my attention. I learned why Led Zeppelin’s “Kashmir” has always sounded “off” to me (1:06:30). John Bonham’s drums are in 4/4 time. Jimmy Page’s guitar is in 3/4 time. The effect is that the guitar (and strings) seem to be ahead and then behind the beat. Listen for yourself below:
They meet up on twelve, the lowest common multiples (LCM) of three and four! Play with the slider below:
Guitar: 3/4 time; Drums: 4/4 time
It’s like a variation of FizzBuzz. FizzBuzz is a child’s game — or drinking game — in which players count around a circle, replacing any number divisible by three with “Fizz” and any number divisible by five with “Buzz.” Numbers divisible by both (i.e., numbers divisible by 15) are replaced with “FizzBuzz.” If a player hesitates for too long or messes up, they’re out.
Top: Multiples of 3 (Fizz); Bottom: Multiples of 5 (Buzz); Centre: Multiples of 3 & 5 (FizzBuzz)
This podcast came along at a time when Marc and I had wrapped up a series of Math 6/7 videos for parents. Factors & Multiples was one of mine. A few activities, like the following, ended up on the cutting room floor:
The gist of this activity is that students are challenged with determining two mystery numbers as their factors (or non-factors) are gradually revealed. Like Wanted Parabola, with each new “clue,” students must assess their thinking. For example, suppose that after 9, 4, 3, and 7 are placed, a student believes that a and b are 18 and 12, respectively. The placement of 1 isn’t helpful; it’s a common factor of a and b, no matter their values. But the placement of 2 means that a cannot be an even number like 18; this student must revise their thinking. (Their choice of b can remain the same since any multiple of four is also a multiple of two.) Throughout, students can be asked “How confident are you?” Notice that with the placement of 5, b must be 60 (or some multiple of 60); the subsequent placement of numbers in this circle adds nothing new. (Maybe it’s worth tinkering with the order in which the clues are revealed?) After, students can be asked to reflect on their mathematical reasoning: “Which clues were most helpful? Which were unnecessary?”
I haven’t tried out this exact task with real students… yet. I’d welcome any feedback from anyone who’s able to test-drive the task for me during this time.
This activity was cut from the video for a couple of reasons. I questioned the task’s accessibility. And slow and patient disclosure of information just plays out better as a classroom activity. More on the design principles behind these videos in an upcoming post…
Gotta be 3 & 10! Or 4 &9. Balance and rotational symmetry.
Back in September, I shared Howie’s tweet with my daughters and am relieved to report that they, too, answered correctly. This is an ongoing thing with us. Whether eggs or cookies, what’s left should either (a) represent a pattern or (b) illustrate a mathematical concept. It’s these mathematical concepts that inform how I create or select a number talk image. There’s a purpose for each image.
Consider the following arrangement of macarons…
You might see six groups of six, each group its own flavour (left to right: crème brûlée, dulce de leche, pistachio, red velvet, chocolate & mandarin, chocolate). Or you might see six rows and six columns — an array. If I had 18 macarons left, I could place them in three rows of six or six rows of three, demonstrating the commutative property of multiplication…
You might see the remaining macarons not (only) as 18 but (also) as one-half. (See this tweet — similar to Howie’s — for one-half of a carton of eggs left.) Expanding from left to right or top to bottom introduces equivalent fractions: 3/6, 6/12, 9/18, … 18/36. Every second row or every second column also gets you one-half. So, too, does every second macaron, whether looking across rows or down columns…
This arrangement maintains the balance and rotational symmetry of my two-eggs-left choice above. (See Simon Gregg’s symmetrical eggs tweet.) There are many interesting ways of seeing eighteen here, including 2(1 +3 + 5) on the diagonals. If a particular strategy does not emerge from the class, I often “go backwards” (e.g., “I see 2(5 + 4). How do I see them?”).
If I had thirty macarons left, I’d remove one column or row, which introduces the distributive property of multiplication…
The number of macarons in these two photos can be expressed as 6(4 + 1) and (3 + 2)6, respectively.
Sticking with thirty, removing a diagonal can bring to mind part-whole relationships as well as the associative property of addition…
Here, five is composed of zero and five, one and four, two and three, and so on. Two plus three (pistachio) is equal to three plus two (red velvet).
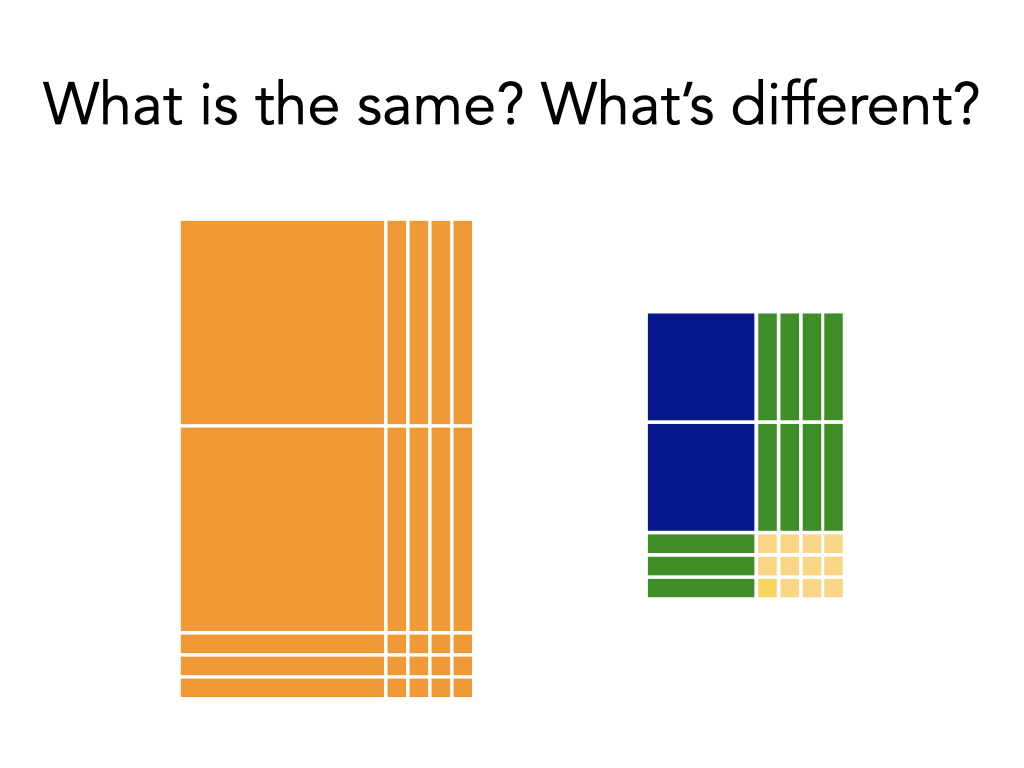
If I had 20 macarons left, I could choose to emphasize multiplication as equal groups — a quincunx of squares (5 × 4) or a square of quincunxes (4 × 5) — and ask What is the same? What’s different?…
Notice that if you still see rows and columns rather than groups, then you might count four rows/columns of four and two rows/columns of two. This can be expressed as 4 × 4 + 2 × 2, which calls on order of operations. So, too, does 2(4 + 4 + 2) if you take advantage of the line symmetry in each of these two arrangements.
Twenty-one macarons form a “staircase”…
Moving some of the macarons makes a “near array”: pairing chocolate with pistachio and mandarin-chocolate with red velvet produces 5 × 4 + 1 (or 6 + 5 × 3).
The Number talk images (aka “quick images” or “dot cards“) instructional routine continues to be one of my favourites. For teachers facing the challenge of facilitating this routine remotely, there are a few, albeit flawed, solutions within Microsoft Teams (SurreySchools’ supported platform).
I’m with Jonathan. In Desmos, it’s dead easy to create an activity in which students can mark up an image to show how they see a quantity, enter a number or expression to answer how many, and type within a text box to explain their mathematical reasoning. Also, the Teacher Dashboard allows teachers to take and present snapshots of students’ ideas to share and discuss with the whole class. See my sample Desmos activity. It’s intended to be a template, not a single never-ending number talk. Copy and paste screens as need be. The images above — and a few more food favourites — are also included in the slide deck below.


 ;
;  ” are authentic. Rather than eliminate unit tests, teachers can look at them through different lenses; a points-gathering perspective shifts to a data-gathering one. Evidence of student learning can take multiple forms (i.e., products, observations, conversations). In this post I will focus on products, specifically unit tests, in part to push back against the sentiment above.


 for ① and
  for ②. (I’m second-guessing that this targets only Extending;
  for ① and
  for ② works too.) This task also elicits evidence of students’ capacities to reason and to communicate–two of the curricular competencies.
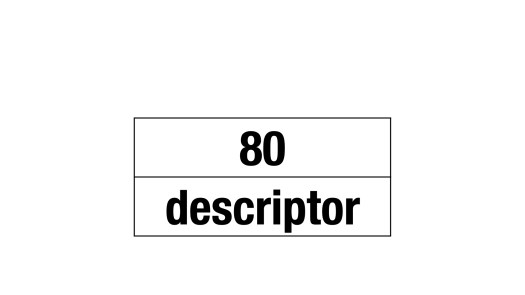


 implies knowing
  .
.
 ?
?


 or
or  . Math minus context.)
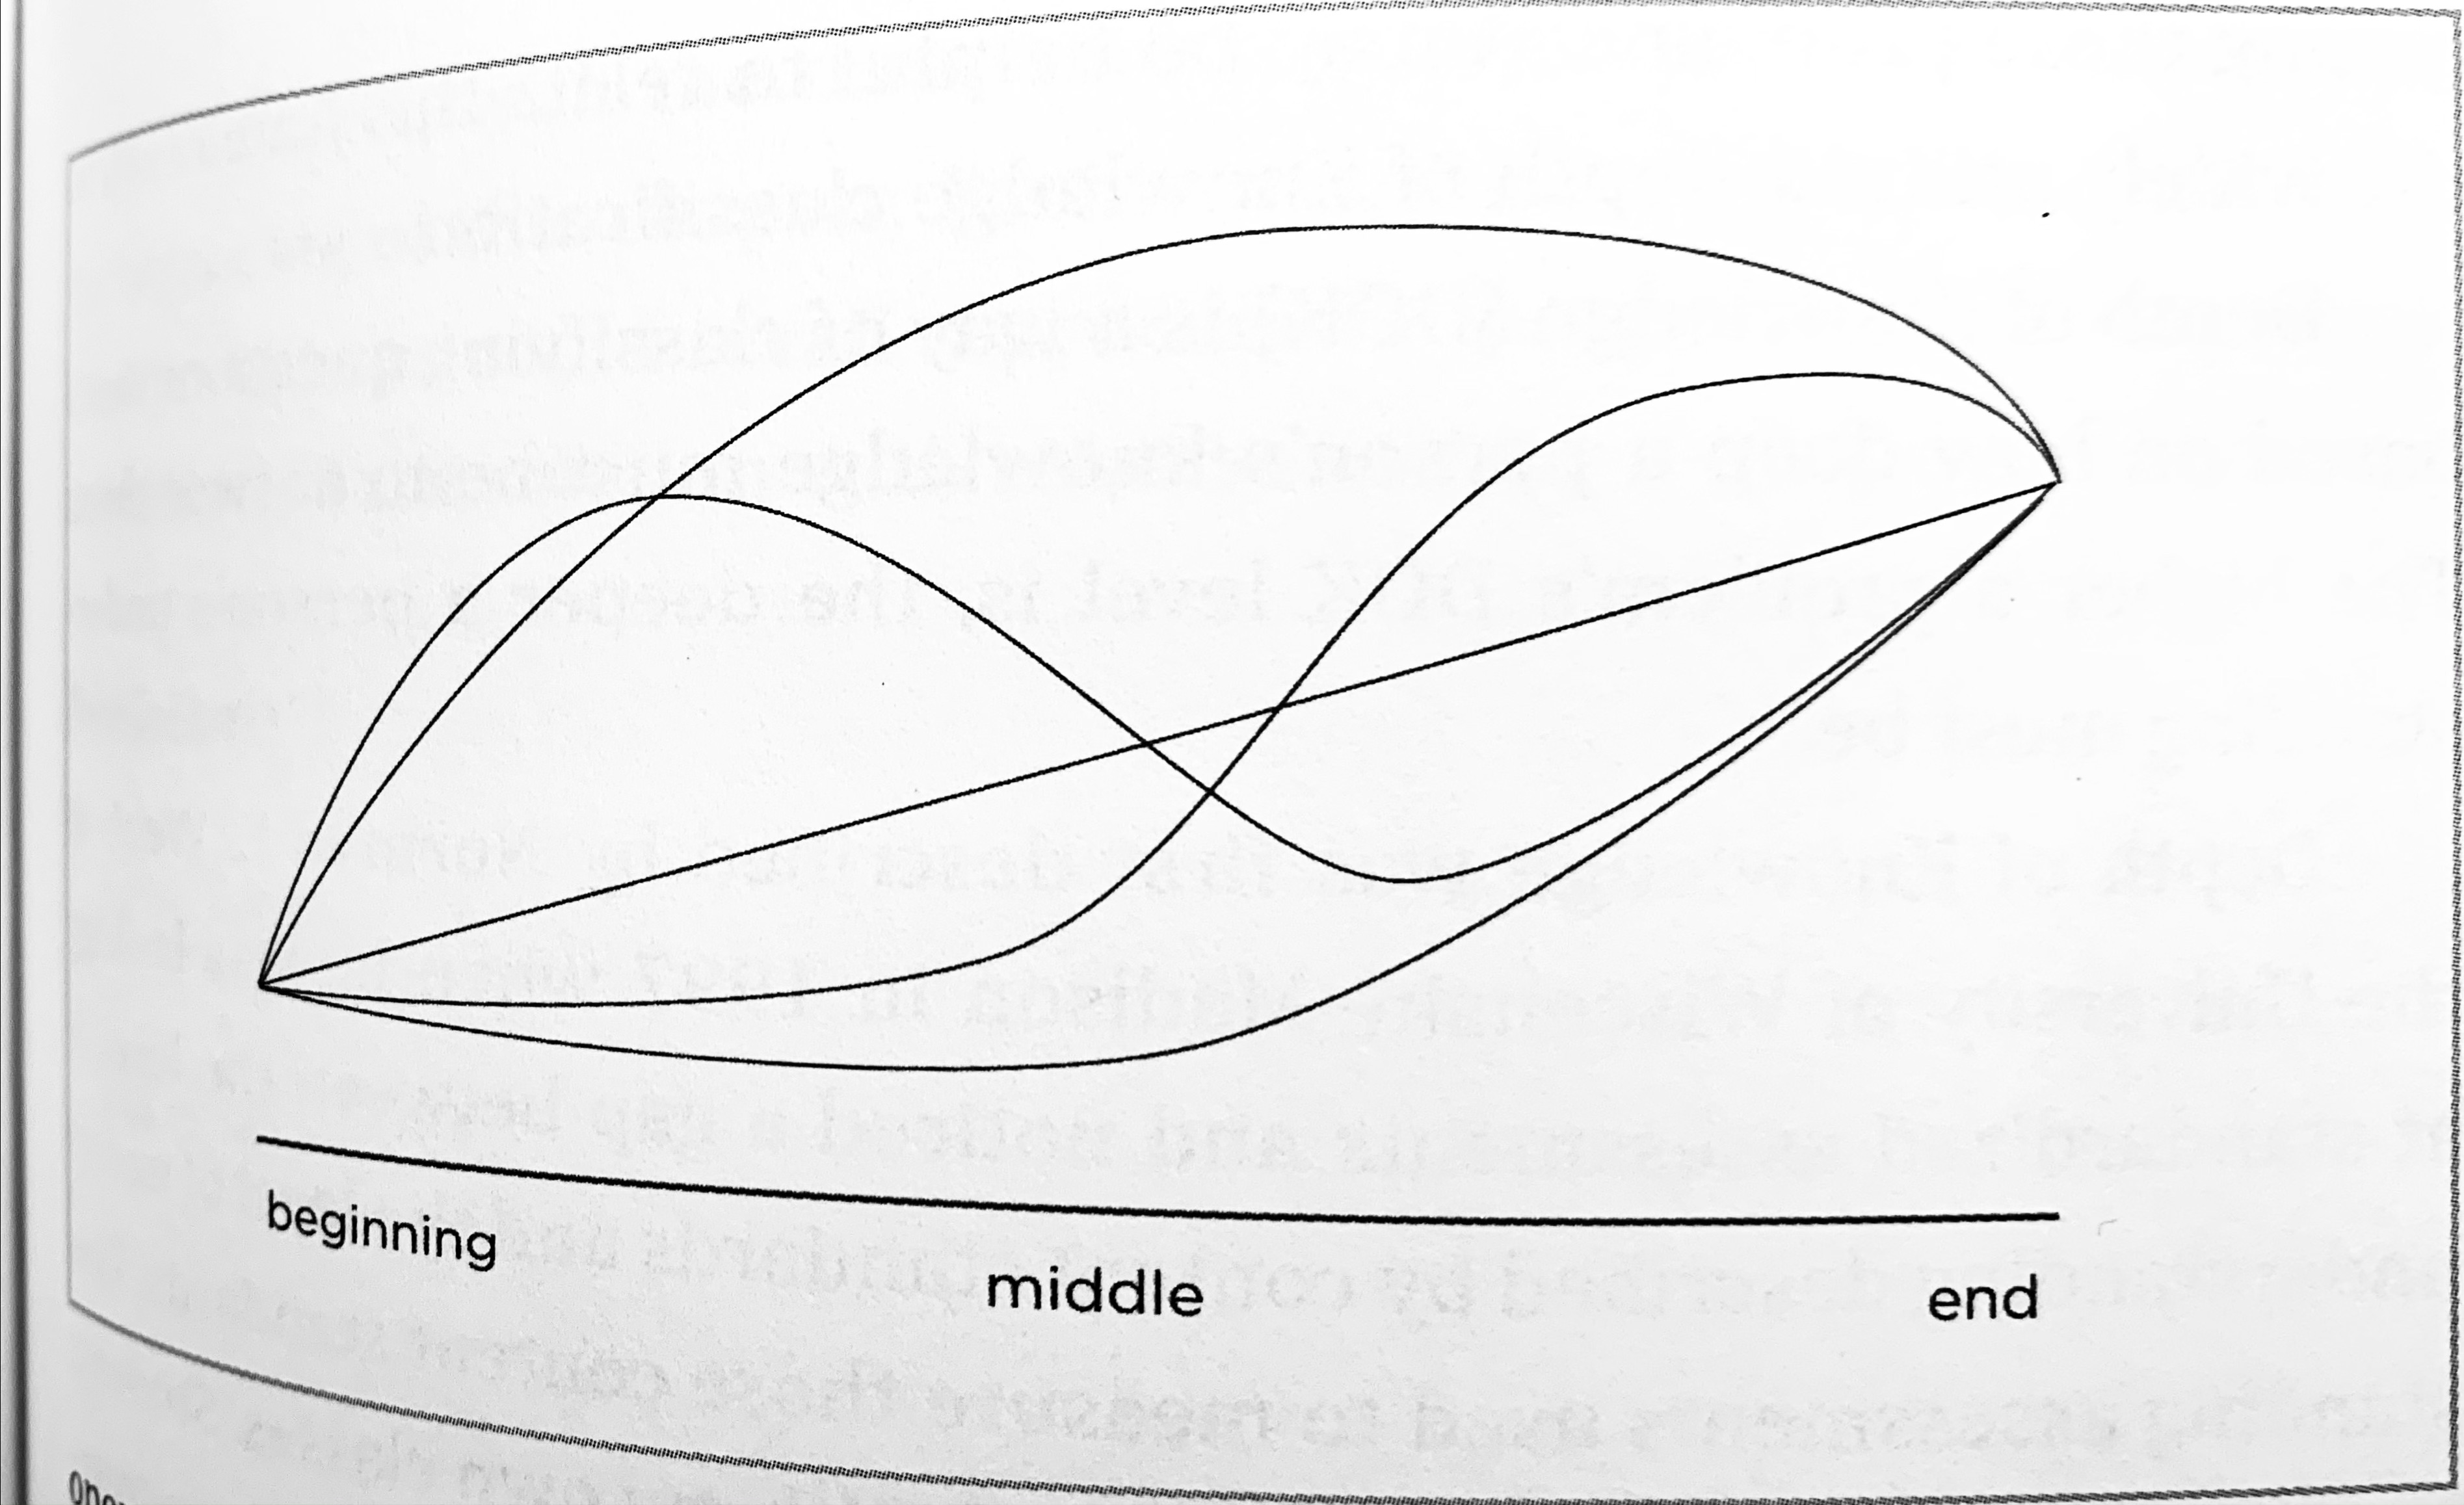


