Grade 3/4 Fraction Action

Recently, I was invited into three Grade 3/4 classrooms to introduce fractions.

Cuisenaire rods give children hands-on ways to explore the meaning of fractions. After students built their towers, flowers, and robots, I asked, “If the orange rod is the whole, which rod is one half?” Students explained their thinking: “two yellows make an orange.” I emphasized, or rather, students emphasized that the two parts must be equal.

yellow orange

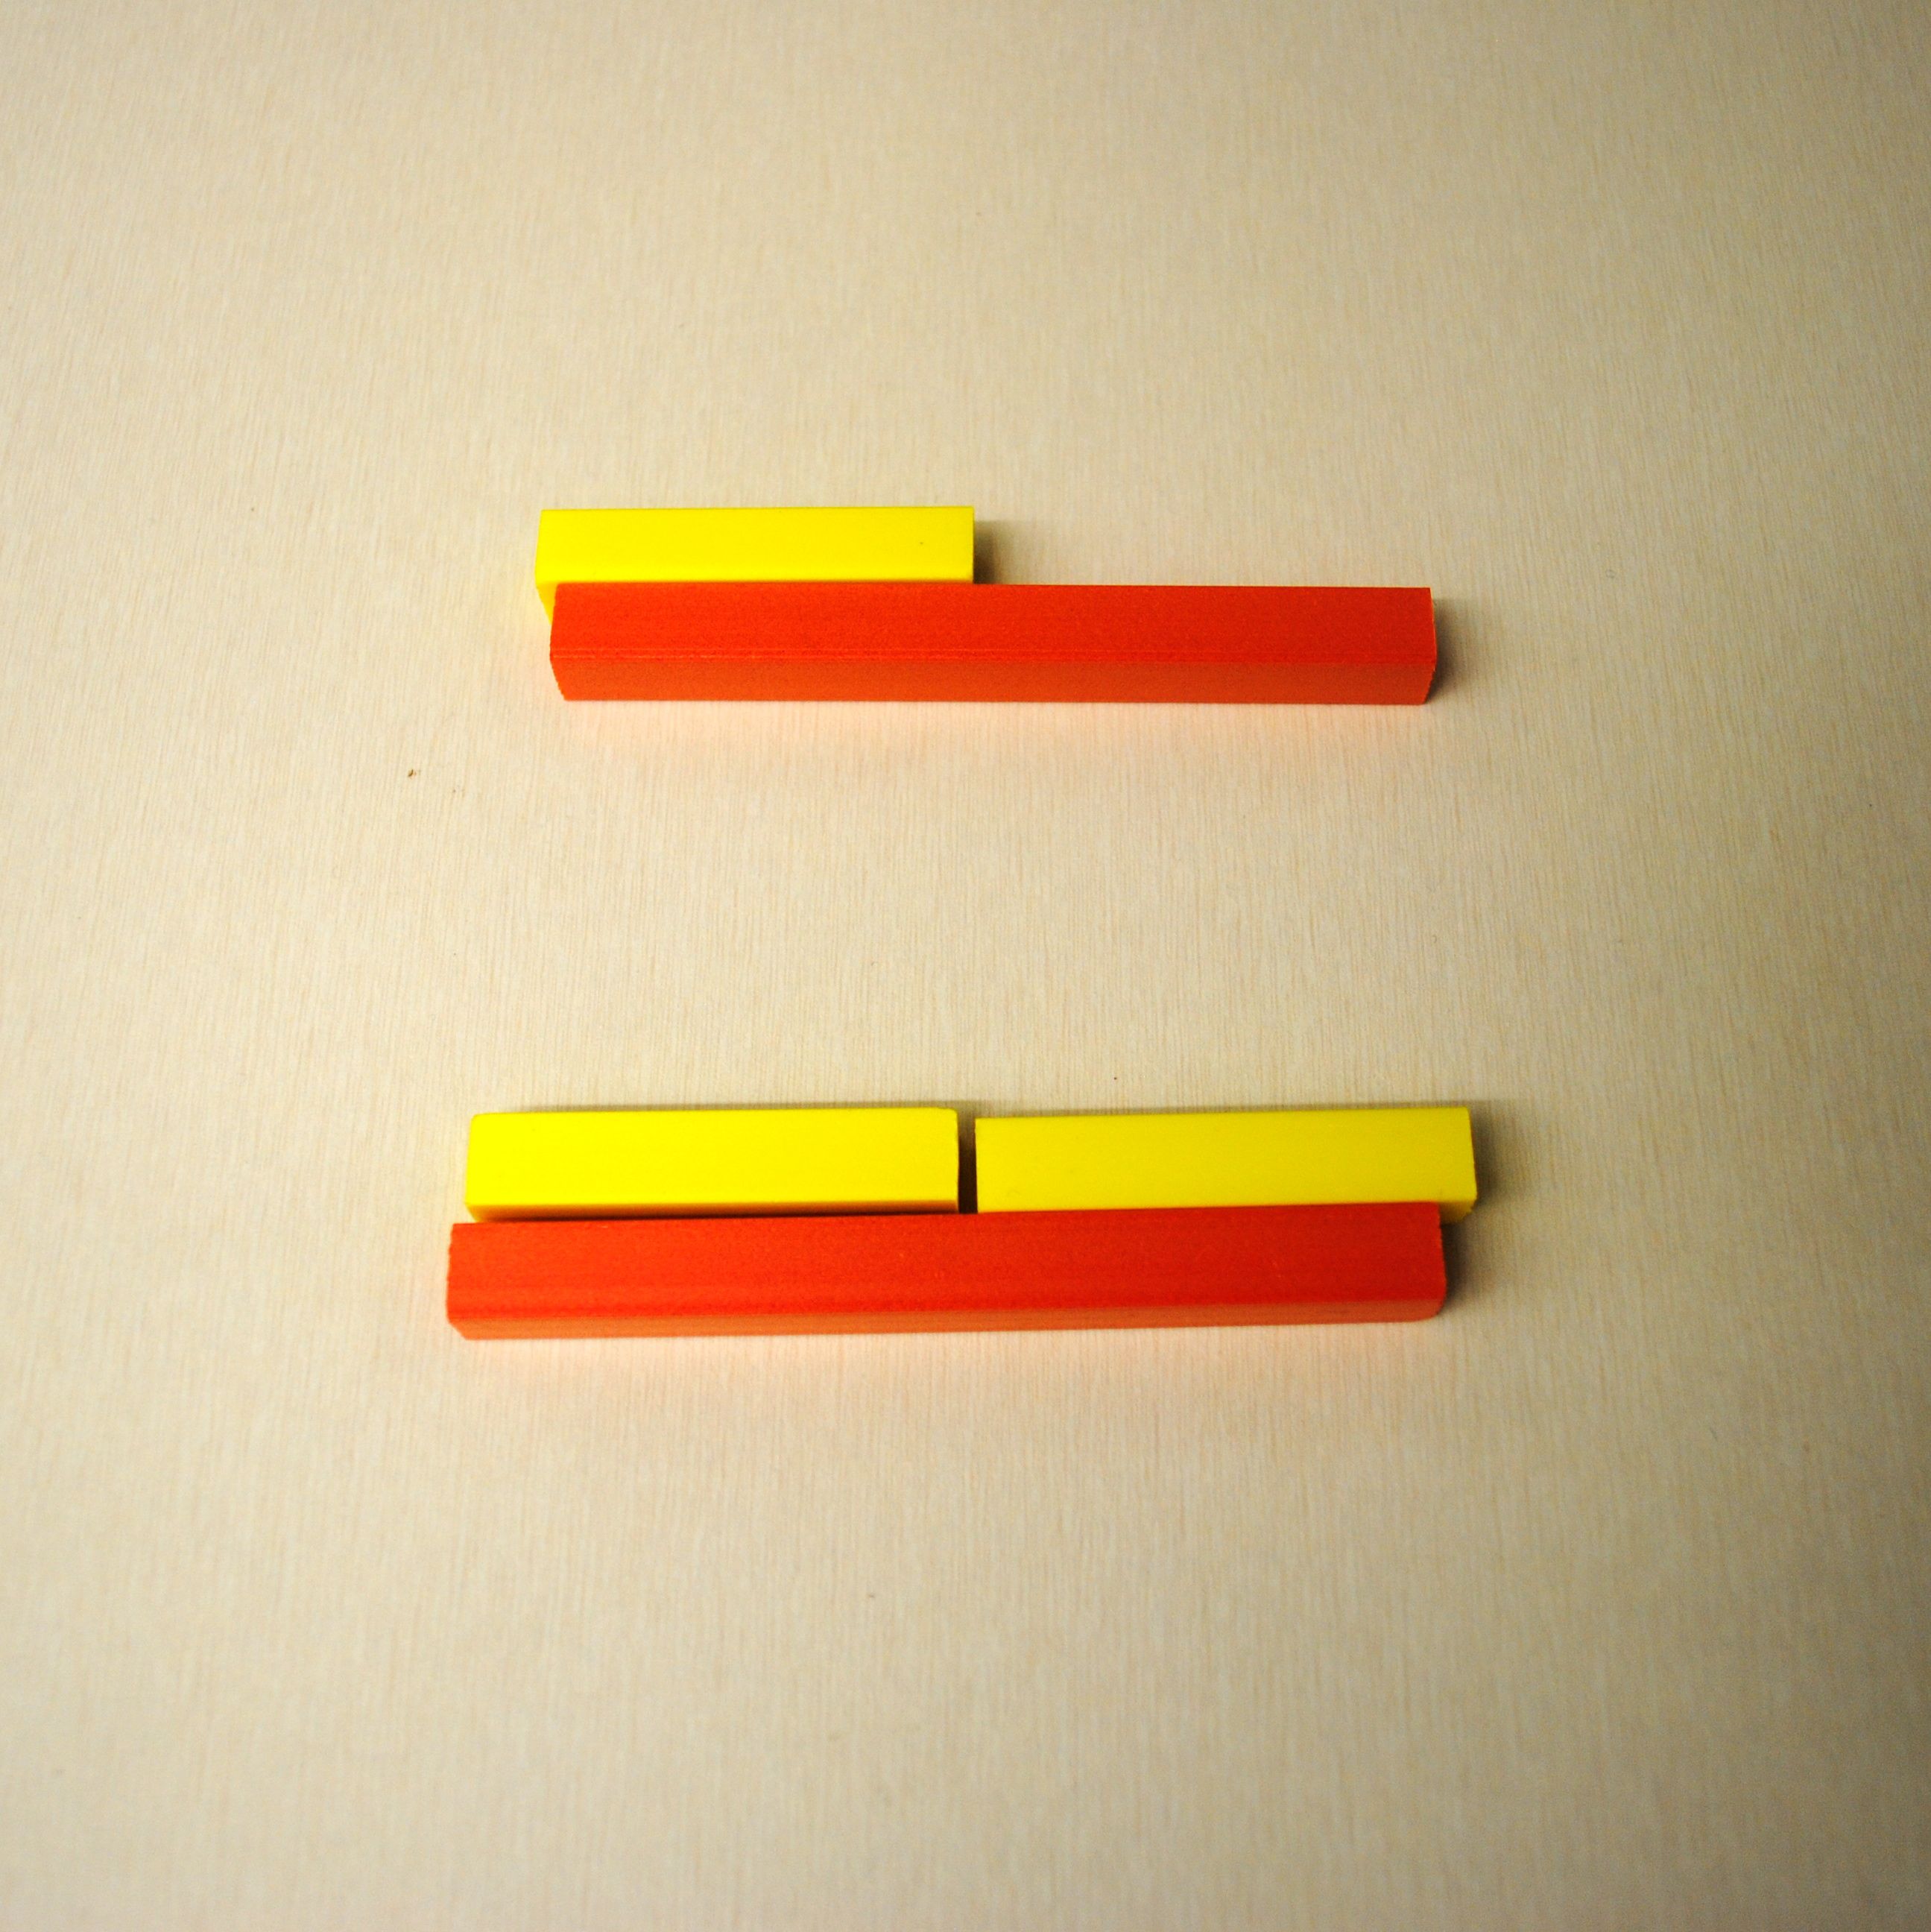
I asked students to find as many pairs as they could that showed one half. I let ’em go and they built and recorded the following:

one half

Once more, with one third:

one third

As children shared their pairs, we discussed the big ideas:

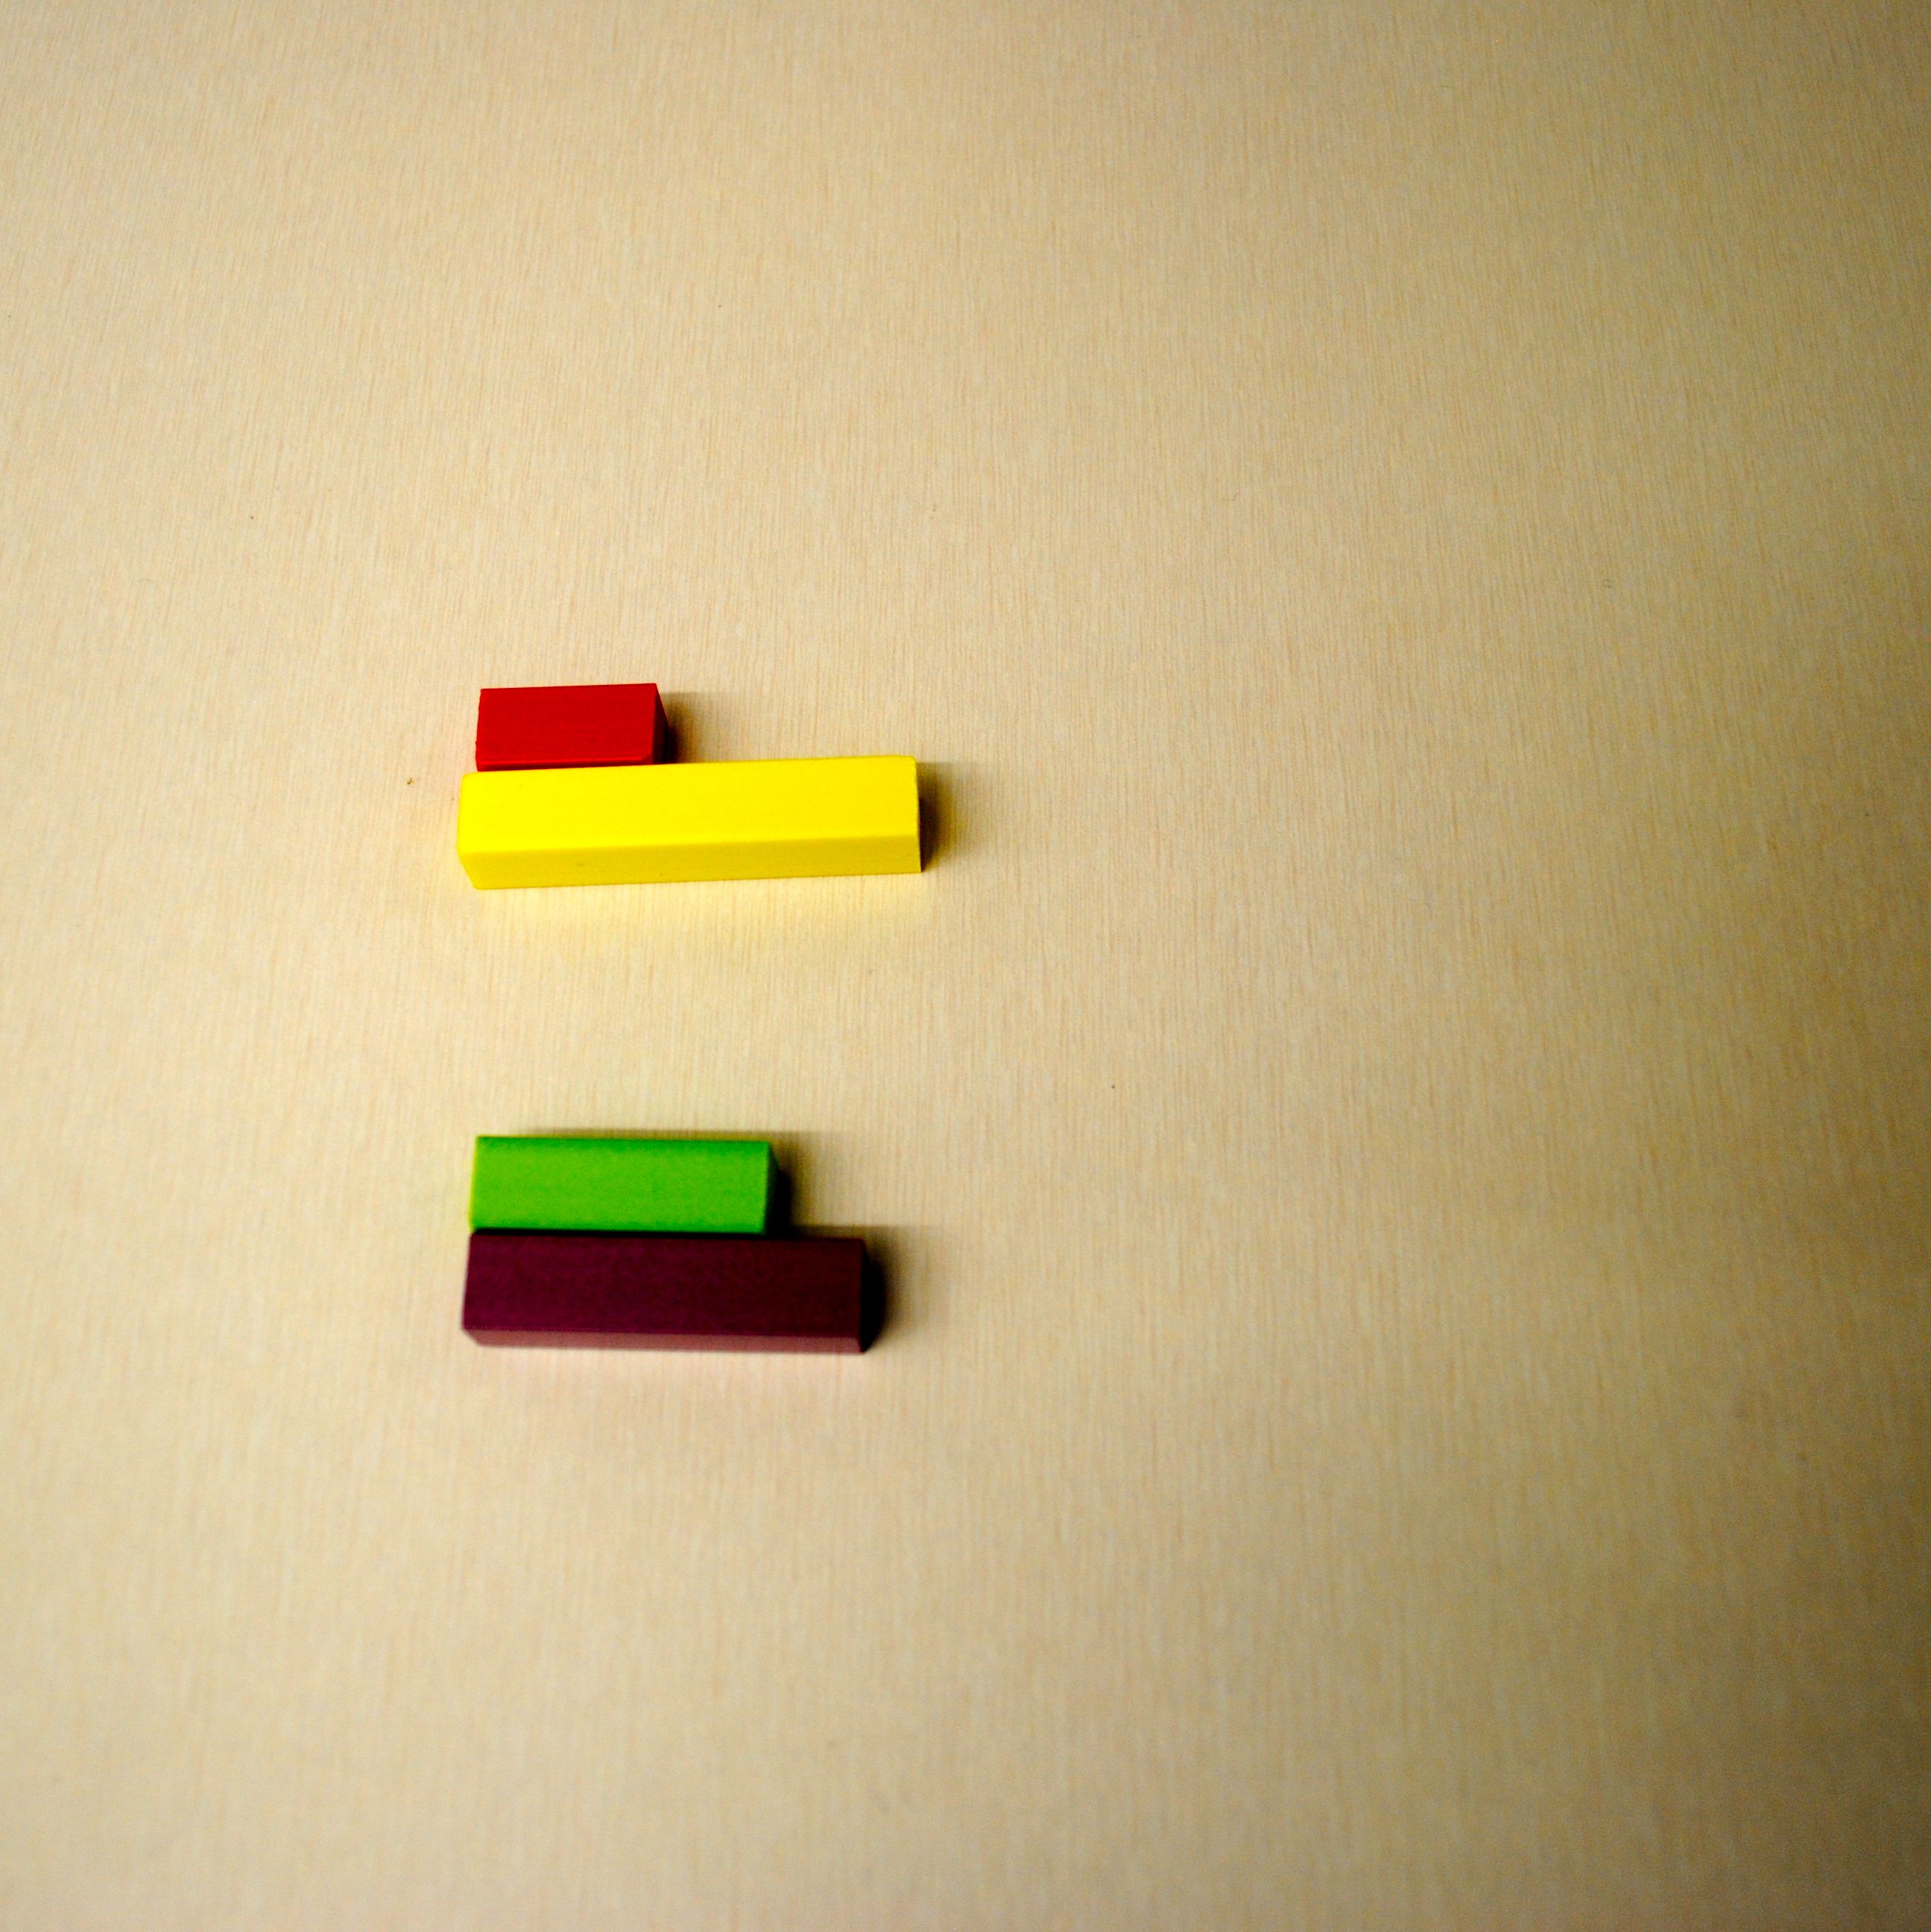
  • the denominator tells how many equal parts make the whole (e.g., two purple rods make one brown rod, three light green rods make one blue rod)
  • the same fraction can describe different pairs of quantities (e.g., one half can be represented using five different pairs, one third can be represented using three different pairs)
  • the same quantity can be used to represent different fractions (e.g., white is one half of red and one third of light green, red is one half of purple and one third of dark green, etc.)

Something interesting and outside the lesson plan happened in each of these three classrooms.

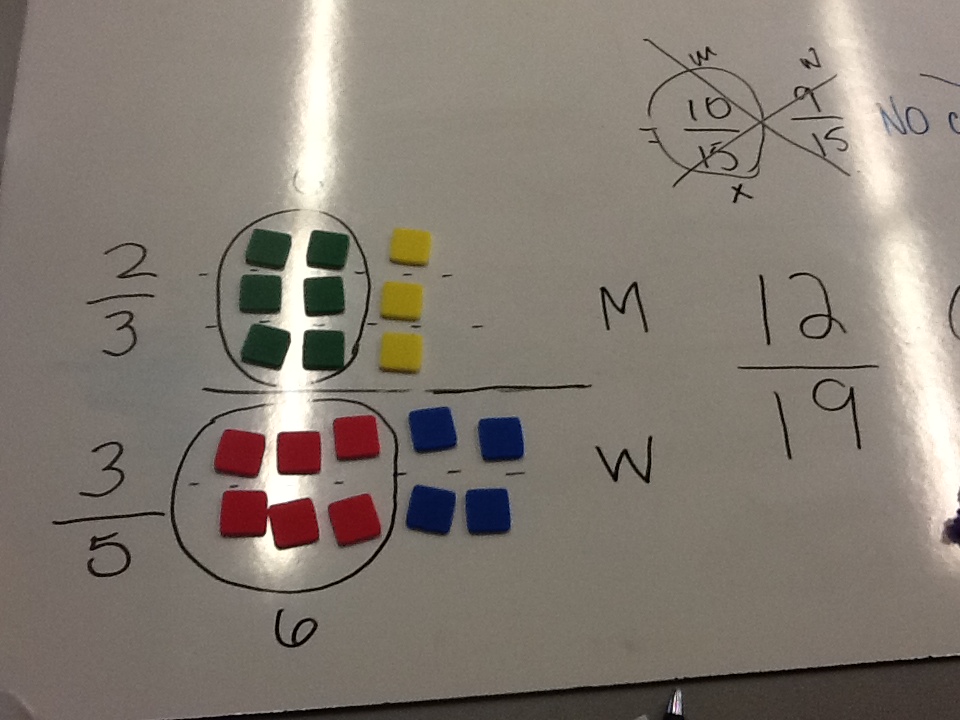
Some students described each pair of rods using equivalent fractions (e.g., 1/2, 2/4, 4/8):

equivalent fractions

I asked the “we’re done” students to represent their own fractions using pairs of rods and determine each other’s mystery fraction. Many students chose fractions like 2/5 or 3/4, not simply unit fractions:

two fifths three quarters

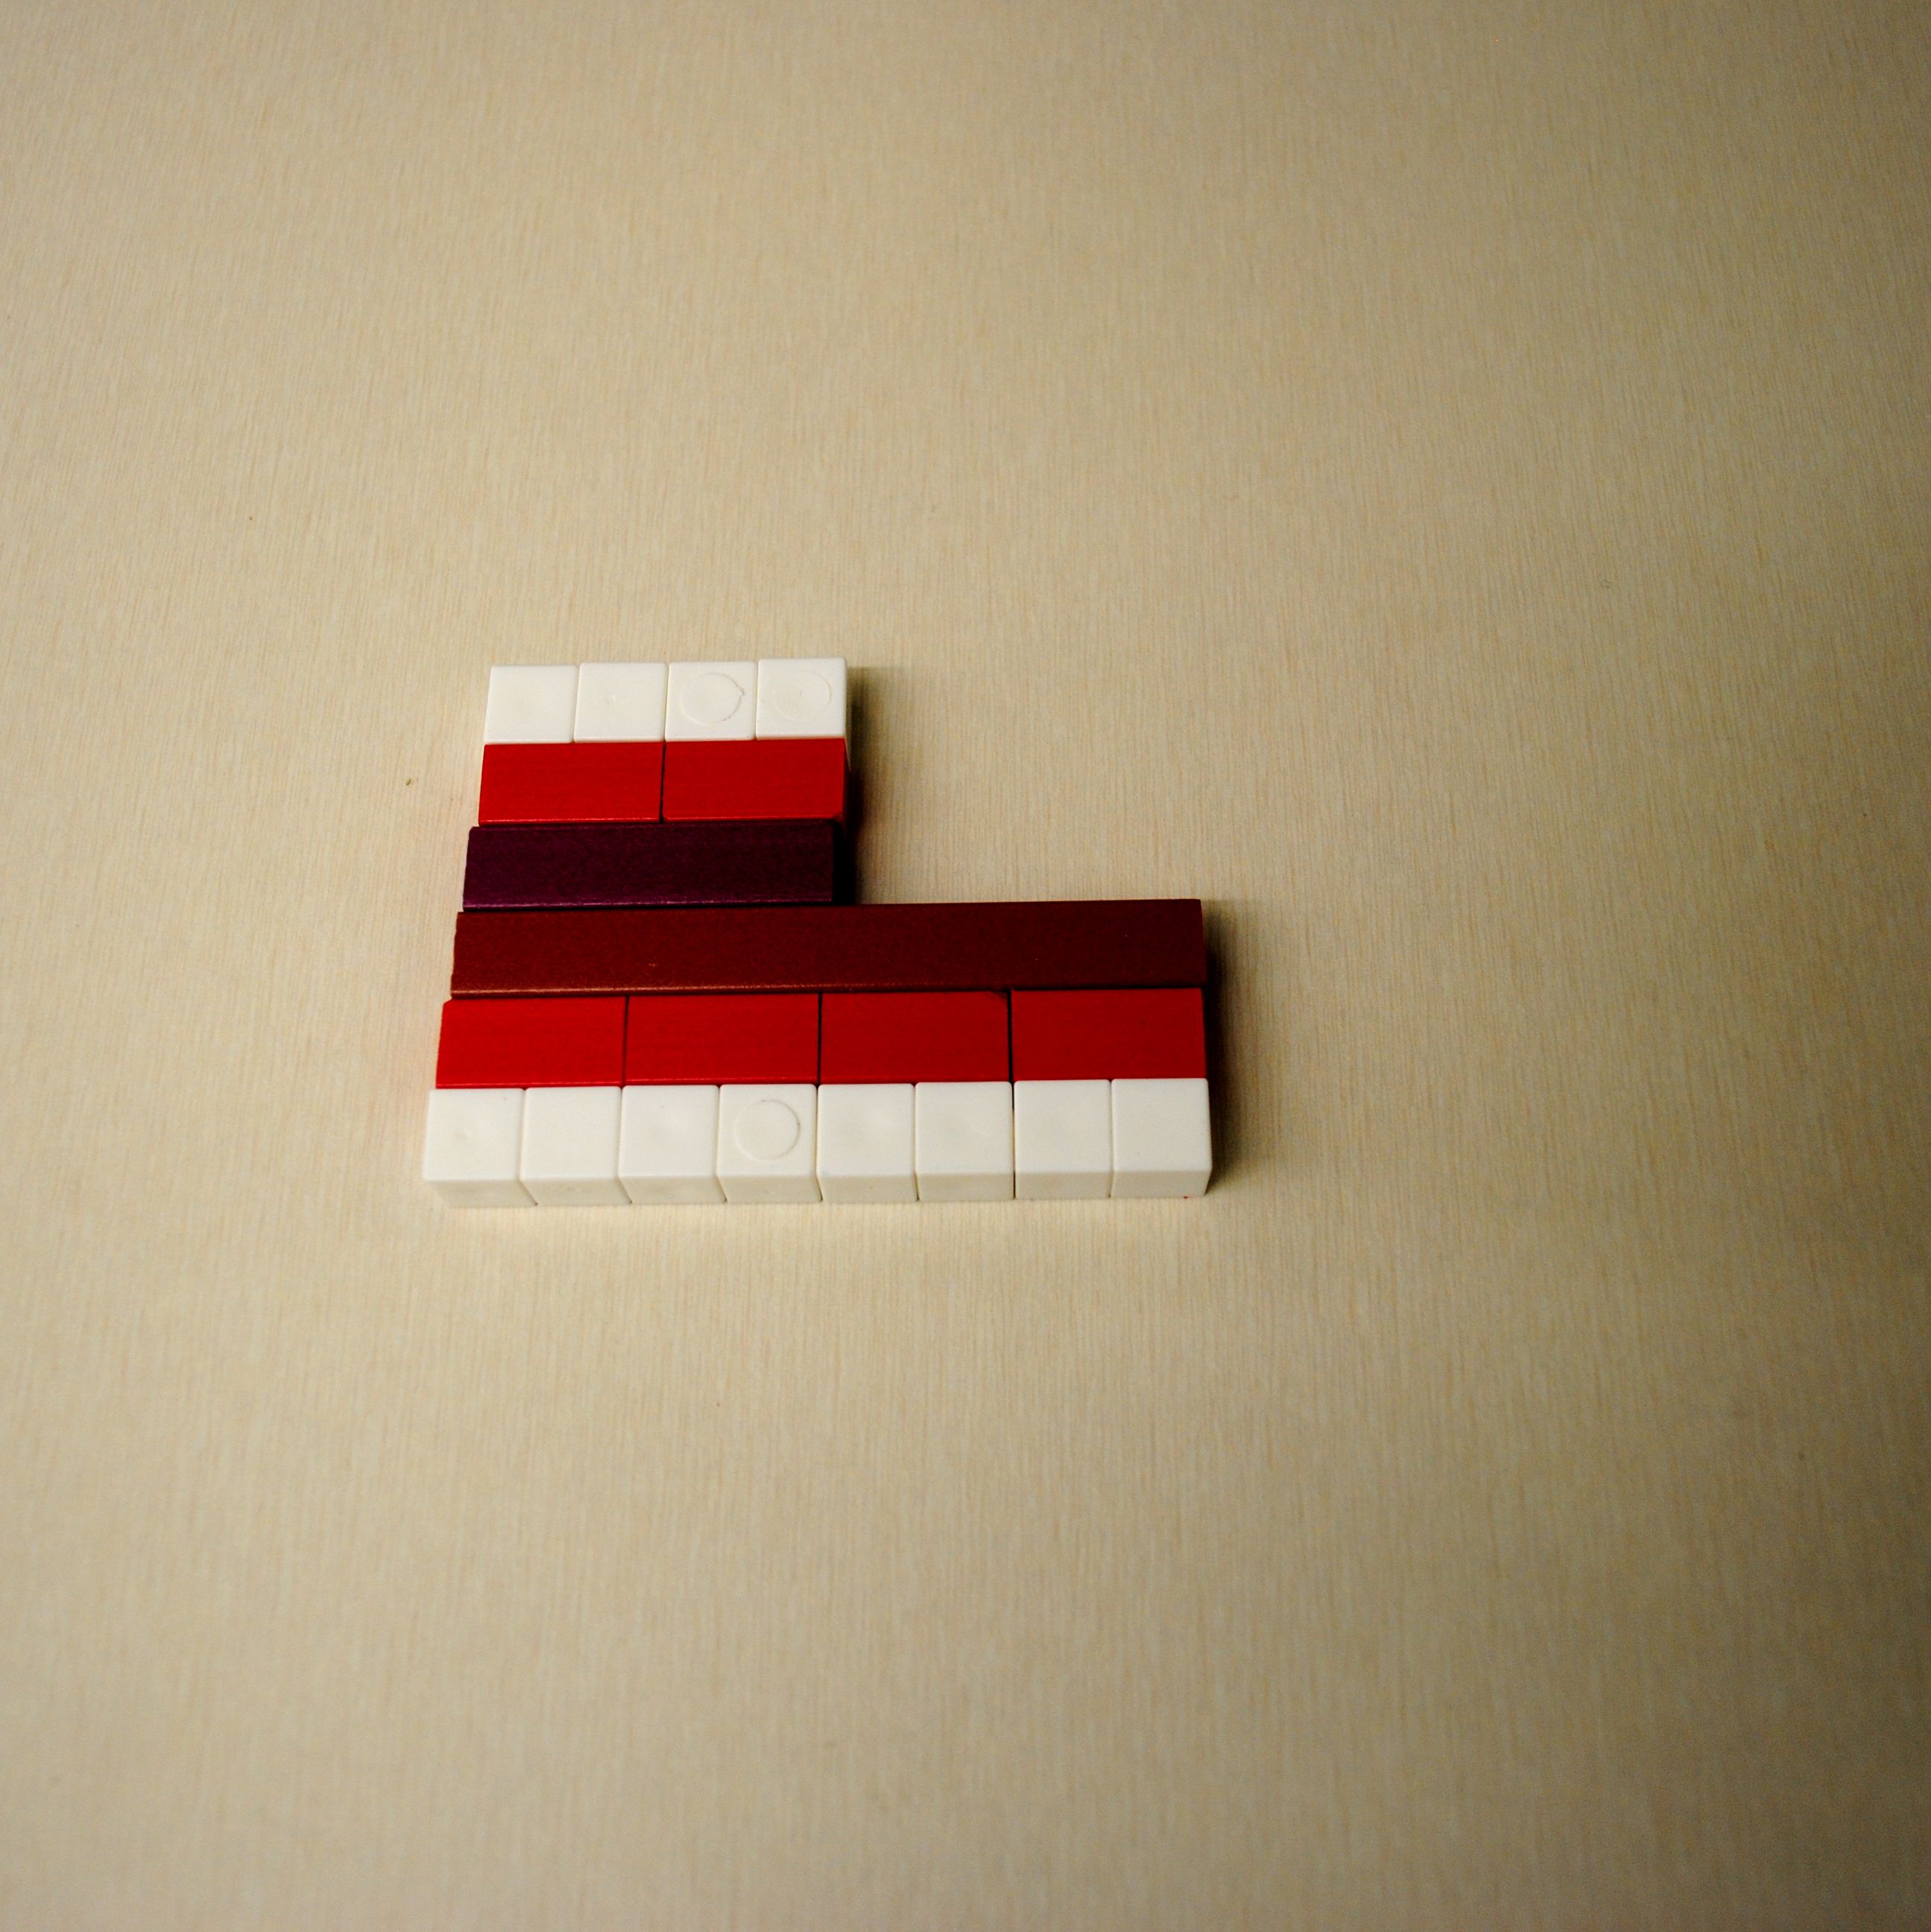
After students shared the three pairs of rods for one third, I asked if anyone found any more. “I did,” said one student, unexpectedly. Check this out:

four twelfths

I asked her why she chose to combine an orange rod and a red rod to make the whole. She explained that twelve can be divided into three equal parts. Without prompting, the rest of the class starting building these:

five fifteenths six eighteenths

adapted from The Super Source

Marriage Problem

Last week, we wrapped up our winter sessions with over 50 elementary school math teams. Part of these sessions are devoted to having teachers work together to solve problems. Having teachers “do the math” helps brings meaning to important topics in mathematics education. We gave the following problem, from Van de Walle:

In a particular small town, 2/3 of the men are married to 3/5 of the women. What fraction of the entire population are married?

This is a challenging problem, but only because traditional algorithms get in the way of sense-making methods. The gut reaction is to do something with common denominators. Time after time, with each group, primary and intermediate. Through questioning, the mistake can be recognized.

“In this context, what does the 15 over here represent?” [points to 10/15]
“The total number of men.”
“And over here?” [points to 9/15]
“The total number of wom–OOOOOh…”

Sometimes, it takes longer to reach an ‘OOOOOh’:

“What does the 10 represent?”
“The number of married men.”
“And the 9?”
“The number of married wom–OOOOOh…”

Once teachers realize that having 10 men married to 9 women is somewhat problematic, most model the problem using colour tiles. Two out of three men being married becomes four out of six and six out of nine. Three out of five women being married is equivalent to six out of ten. Six pairs of husbands and wives can be formed. We have 12 out of 19 people being married.

marriage (concretely)Others think logically to solve the problem. The number of husbands must equal the number of wives. The number of husbands and wives are represented by the numerators.  Therefore, the numerators must be made equal. With all due respect to Dr. Math, it just makes sense.

marriage (pictorially)The use of manipulatives to construct meaning continues to be a focus of teachers involved in the numeracy project, both for themselves and for their students. Long before I became involved in this project, my fellow Numeracy Helping Teachers (Marc Garneau, Selina Millar, Sandra Ball, and Shelagh Lim) worked tirelessly to set a climate in which teachers and students felt comfortable using a variety of manipulatives.

At these sessions, we present teachers with problems, not practice. It’s a pleasure to work with such an amazing group of educators so willing to explore, take risks, and persevere. But as much fun as these sessions with teachers have been, I’m looking forward to the real fun: problem-solving with their students.

Update (2020/01/18)

A much more inclusive context!

Quadratic Patterns

Having students write an equation that describes a pattern involving toothpicks, pattern blocks, or colour tiles is nothing new. However, students (teachers?) often focus on patterns in the table of values rather than properties of the pattern itself. Visualizing the pattern can help students write the equation. For some, this approach may be new.

For example, consider the following pattern:

In each figure, students may see a rectangle with two squares attached, one above and one below. That rectangle has a width of n and a length of n + 2. The expression is n(n + 2) + 2.

Some students may see the pattern in a different way. But what about the students who don’t see anything? For them, some scaffolding is necessary. Note the scaffolding in the pattern below.

Students may see one red square, two green rectangles, and two blue tiles in each figure. That is, they see n^2 + 2n + 2. The use of colour is intended to be helpful. Of course, some students may ignore this hint. I’m cool with that. They may see a large square with one tile attached, or (n + 1)^2 + 1.

Again, look for the scaffolding in the pattern below.

Students may see a rectangle with a number of tiles being removed, as suggested by the dotted lines. That rectangle has a width of n + 1 and a length of n + 2. The number of tiles being removed is equal to the figure number. Alternatively, students may visualize  2(n + 1) + n^2.

Did you notice that each of the expressions above are equivalent? They must be. Each of the three patterns begin with 5, 10, and 17 tiles. Each pattern/expression tells the same story, but in a different way.

My goal was to design three parallel tasks. Have students choose one of the three representations… just don’t tell them they’re the same.

My three-part lesson plan:

Marc and I created two more sets of patterns. All three:

For more, please see Fawn Nguyen’s Pattern Posters.

A Deconstructed Learning Outcome: Sum of Its Parts

Maybe I’ve seen one too many deconstructed Caesar salad or peanut butter and jam sandwich on TV. Or maybe I’ve heard “This workbook covers the curriculum” one too many times¹.
 
Whatever my reason, I wanted to take a closer look at a learning outcome from the WNCP Math 8 curriculum document:
 
It is expected that students will demonstrate an understanding of multiplying and dividing positive fractions and mixed numbers, concretely, pictorially, and symbolically [C, CN, ME, PS]
 
“It is expected that students will”
It’s about students’ learning. Worked examples on the whiteboard or in a textbook may be evidence of the teacher’s or publisher’s learning.
 
“demonstrate an understanding of”
Not will be able to. Students need to make sense of mathematics. Justifications and explanations are required for answers and methods.
 
“multiplying and dividing positive fractions and mixed numbers”
This is a topic. Curriculum is more than a collection of these.
 
“concretely, pictorially, and symbolically”
No longer just suggested, the use of concrete materials (i.e., manipulatives) is prescribed² as is having students draw to represent their thinking (diagrams not decorations).
  
[C, CN, ME, PS]
From K to 12, seven processes are to be integrated within the learning of mathematics. The ‘C’, for example, means that students should be provided with opportunities to communicate their learning– to write about and discuss mathematical ideas.
 
¹ To my US reader(s)– in my province, curriculum is different than recommended learning resource (i.e., the textbook). In theory, the textbook is not the course. In practice…
 
² For many teachers, this is probably the biggest change to the curriculum. Earlier this year, I created the posters below. My intent was to generate conversations among teachers, not to teach the concept. Plus, I got to be artsy-fartsy. Enjoy.
 

CPS Poster Algebra Tiles
CPS Poster Counters
CPS Poster Pattern Blocks
CPS Poster Toothpicks

A Linear Functions Lesson Across the Grades

How many people can sit at 100 (or n) triangular tables? Square tables? Hexagonal tables? What if you join the tables so that one side of the next table touches one side of the previous table?

I appreciate this problem for a few reasons:

  1. I can present it in grades 4 through 10. In grade 4, students write a recursive relationship (e.g., for joined hexagonal tables, start at 2 and add 4 each time). In grade 6, students write a functional relationship (e.g., 4n + 2). In grade 8, students graph a linear relation (e.g., y = 4x + 2). In grade 10, students interpret the slope and y-intercept (e.g., each added table provides 4 additional seats, there are 2 additional seats at the ends of the table). When I teach and discuss this lesson at different grade levels within a school, I think a common activity helps teachers connect the big ideas across the grades.
  2. I can easily adapt and extend the task. When I have taught this lesson in grade 6 (see three-part lesson plan), most students can write an expression for joined square or hexagonal tables. Some students may choose to solve a simpler problem and write an expression for joined triangular tables. Other students can be challenged to write an expression for tables with any number of sides. All students can participate in the class discussion.
  3. The use of pattern blocks can help students gain a deeper understanding. Most students were able to make sense of the 4 in 4n + 2. Each time a table is added to an end, 4 seats are added. (Two seats are lost when tables are joined.) When one student showed how he added tables to the middle rather than an end, this helped his classmates make sense of the 2 in 4n + 2. There are two more tables at the ends. Pattern blocks allow students to make sense of the expression beyond “add 2 to make the numbers in the table of values work”.

This problem appears in several resources including The Super Source.

Running naked again. This time, with scissors.

In an earlier post, I shared a poster that I created using photos of odd numbers taken by local photographer mag3737. He shared this pictorial representation of the Pythagorean Theorem with me. Very cool – both the image itself and the online sharing.

I created another poster from mag3737’s photos – a pictorial representation of exponential growth.

The rate at which exponential functions grow can be a difficult concept to visualize. Starting at 2^4 = 16, the area is doubling but the height is not. By doing this, I’m not sure if I accomplished my goal of illustrating exponential growth (although I did manage to have the numbers fit on the page).

I suggest taking scissors to this poster. The eight columns of eight 64’s that represent 2^6 stacked on top of each other reach a height of over five feet. This is a powerful (and perhaps surprising?) image of exponential growth.

Instead, because of necessary scaling, students often see something like this:

What other mathematical concepts could be represented using these photos of numbers?

PDF’s of the posters: sum of consecutive odd numbers & powers of 2

A pictorial representation that will have you running naked through the streets

The sum of the first consecutive odd numbers is a square number.

Why? What do perfect squares have to do with odd numbers? At first glance, these are two seemingly unrelated types of numbers.

Some of us (okay, me) may have presented something like this:

1     +     3     +     5 + … + (2n – 1)
(2n – 1) + … + 5     +     3     +     1

The sum of each column is 2n. We have n columns. The total is then n × 2n = 2n². We added the sum twice so 2n² ÷ 2 = n².

Can you see what perfect squares have to do with odd numbers? Me neither.

Compare that with the following explanation¹ given in Paul Lockhart’s “A Mathematician’s Lament”.

Inspired by this pictorial representation, I created this poster below.

 ¹ Lockhart might say it’s not the fact that perfect squares are made up of odd numbers which can be represented as L-shapes. What matters is the idea of chopping the square into these nested shapes.

Revisiting Pictorial Representations of Functions

The K-7 word walls were developed by my Numeracy Helping Teacher colleagues to help students and teachers communicate mathematically. They were not meant to ‘teach’ concepts but to help make visual and conceptual connections. The cards have been very popular with Surrey teachers. The Math 8 cards have been created and we will be sharing them with Surrey secondary teachers starting in September.

See the sample cards to the right. In an earlier post, I mentioned how concrete and pictorial representations of linear functions can enhance understanding. For example, in the expression 2n + 1, the coefficient of 2 can be interpreted as adding 2 tiles as the pattern continues.

The coefficient can also be visualized in another way. It may be easier to describe by looking at the card for constant. In the first figure, we can see two groups of one (one white square above the red square and one white square to the right of the red square). In the second figure, we can see two groups of two (one group of two white squares above the red square and one group of two white squares to the right of the red square). Similarly, in the third figure, we can see two groups of three. Finally, in the nth figure, there will be n groups of 2, or 2n, white tiles.

This can also be an interesting investigation when teaching quadratic functions (or a challenging extension when teaching linear functions). In the pattern to the right, the red squares in the first figure make a 2-by-3 rectangle. The red squares in the second figure make a 3-by-4 rectangle. We can see a 4-by-5 rectangle in the third figure. In the nth figure, there will be a rectangle with width n and length n + 1 . In each figure, there are also two white squares. Therefore, the expression is n(n + 1) + 2.

This pattern, too, can be be visualized in another way. For example, in each figure, the red tiles can be seen as being made up of a square and a rectangle. In the first figure, we can see 2 squares on top of a 2-by-2 square. In the second figure, we can see 3 squares on top of a 3-by-3 square, and so on. In the nth figure, there will be n squares on top of an n-by-n square. Remembering the 2 white squares, the expression is n^2 + n + 2.

The two expressions are equivalent but reflect different ideas.

How do you know that a relationship is linear? quadratic?
How are the pictorial representations of linear and quadratic functions the same? different?

To see more on this approach, visit I Hope This Old Train Breaks Down.

One more thing… I purposely did not circle the groups and shapes discussed above… I didn’t want to take away the fun of visualizing them for yourself.

Linear Functions – Concretely, Pictorially, Symbolically

Welcome to my blog!

I really enjoyed Marc’s Patterning the Blues activity (taken from Marian Small’s Big Ideas book that department heads received).

Teachers often talk about how manipulatives can help the struggling learner. I’m suggesting that having students solve problems concretely can assist all learners.

When I experienced this problem using the blue and yellow tiles, I gained a deeper understanding of the problem. The equation y = 3x + 2 now had meaning. I was able to find the pattern in the table to determine the number 3. By modelling the problem using tiles, I was able to see this as adding an extra 3 blue tiles every time the figure grew.

In the past, I had difficulty explaining to students where the 2 came from. I could convince them that it had to be there. For example, take the point (2, 8). Multiplying the 2 by 3 gives  6, so we need to add 2 more. Looking at this concretely & pictorially, the 2 now has meaning. For me, it is how many blue tiles there were before we start adding yellow & blue tiles. (See the photo below.)

Your students who used to get it symbolically will still get it if they approach it concretely. However, what it means to “get it” in your classroom will start to change.

Patterning the Blues
Patterning the Blues Concretely

I’d appreciate your comments. Maybe you have some thoughts on how this activity addresses the 7 processes?