A Star Wars Tomatometer Story

I wrote this post two years ago but decided against hitting publish. With the final film in the “Skywalker saga” opening next week, now is as good a time as any. And yes, we have tickets!

Like The Force Awakens and Rogue One, my daughters and I saw The Last Jedi on opening night. It’s become a bit of a Hunter holiday tradition. Gwyneth loves the stories; Keira loves the Porgs. As much as the movies themselves, Gwyneth loves watching and discussing YouTubers’ takes on them — reactions, explanations, theories. She shared this one from New Rockstars with me, which begins with this:

“… Star Wars: The Last Jedi is the most polarizing film of the year, with one of the biggest gaps between critics ratings and audience scores for a major film ever. What the hell is going on here? Why are some people so annoyed with it, saying it ruined what made the original trilogy and The Force Awakens so good? Why are others fanboy crushing so hard over it, calling it the best Star Wars film ever made?”

New Rockstars

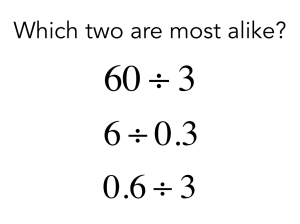
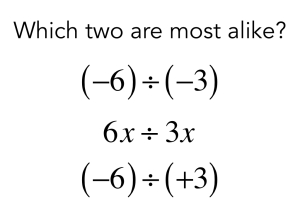
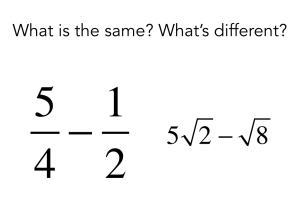
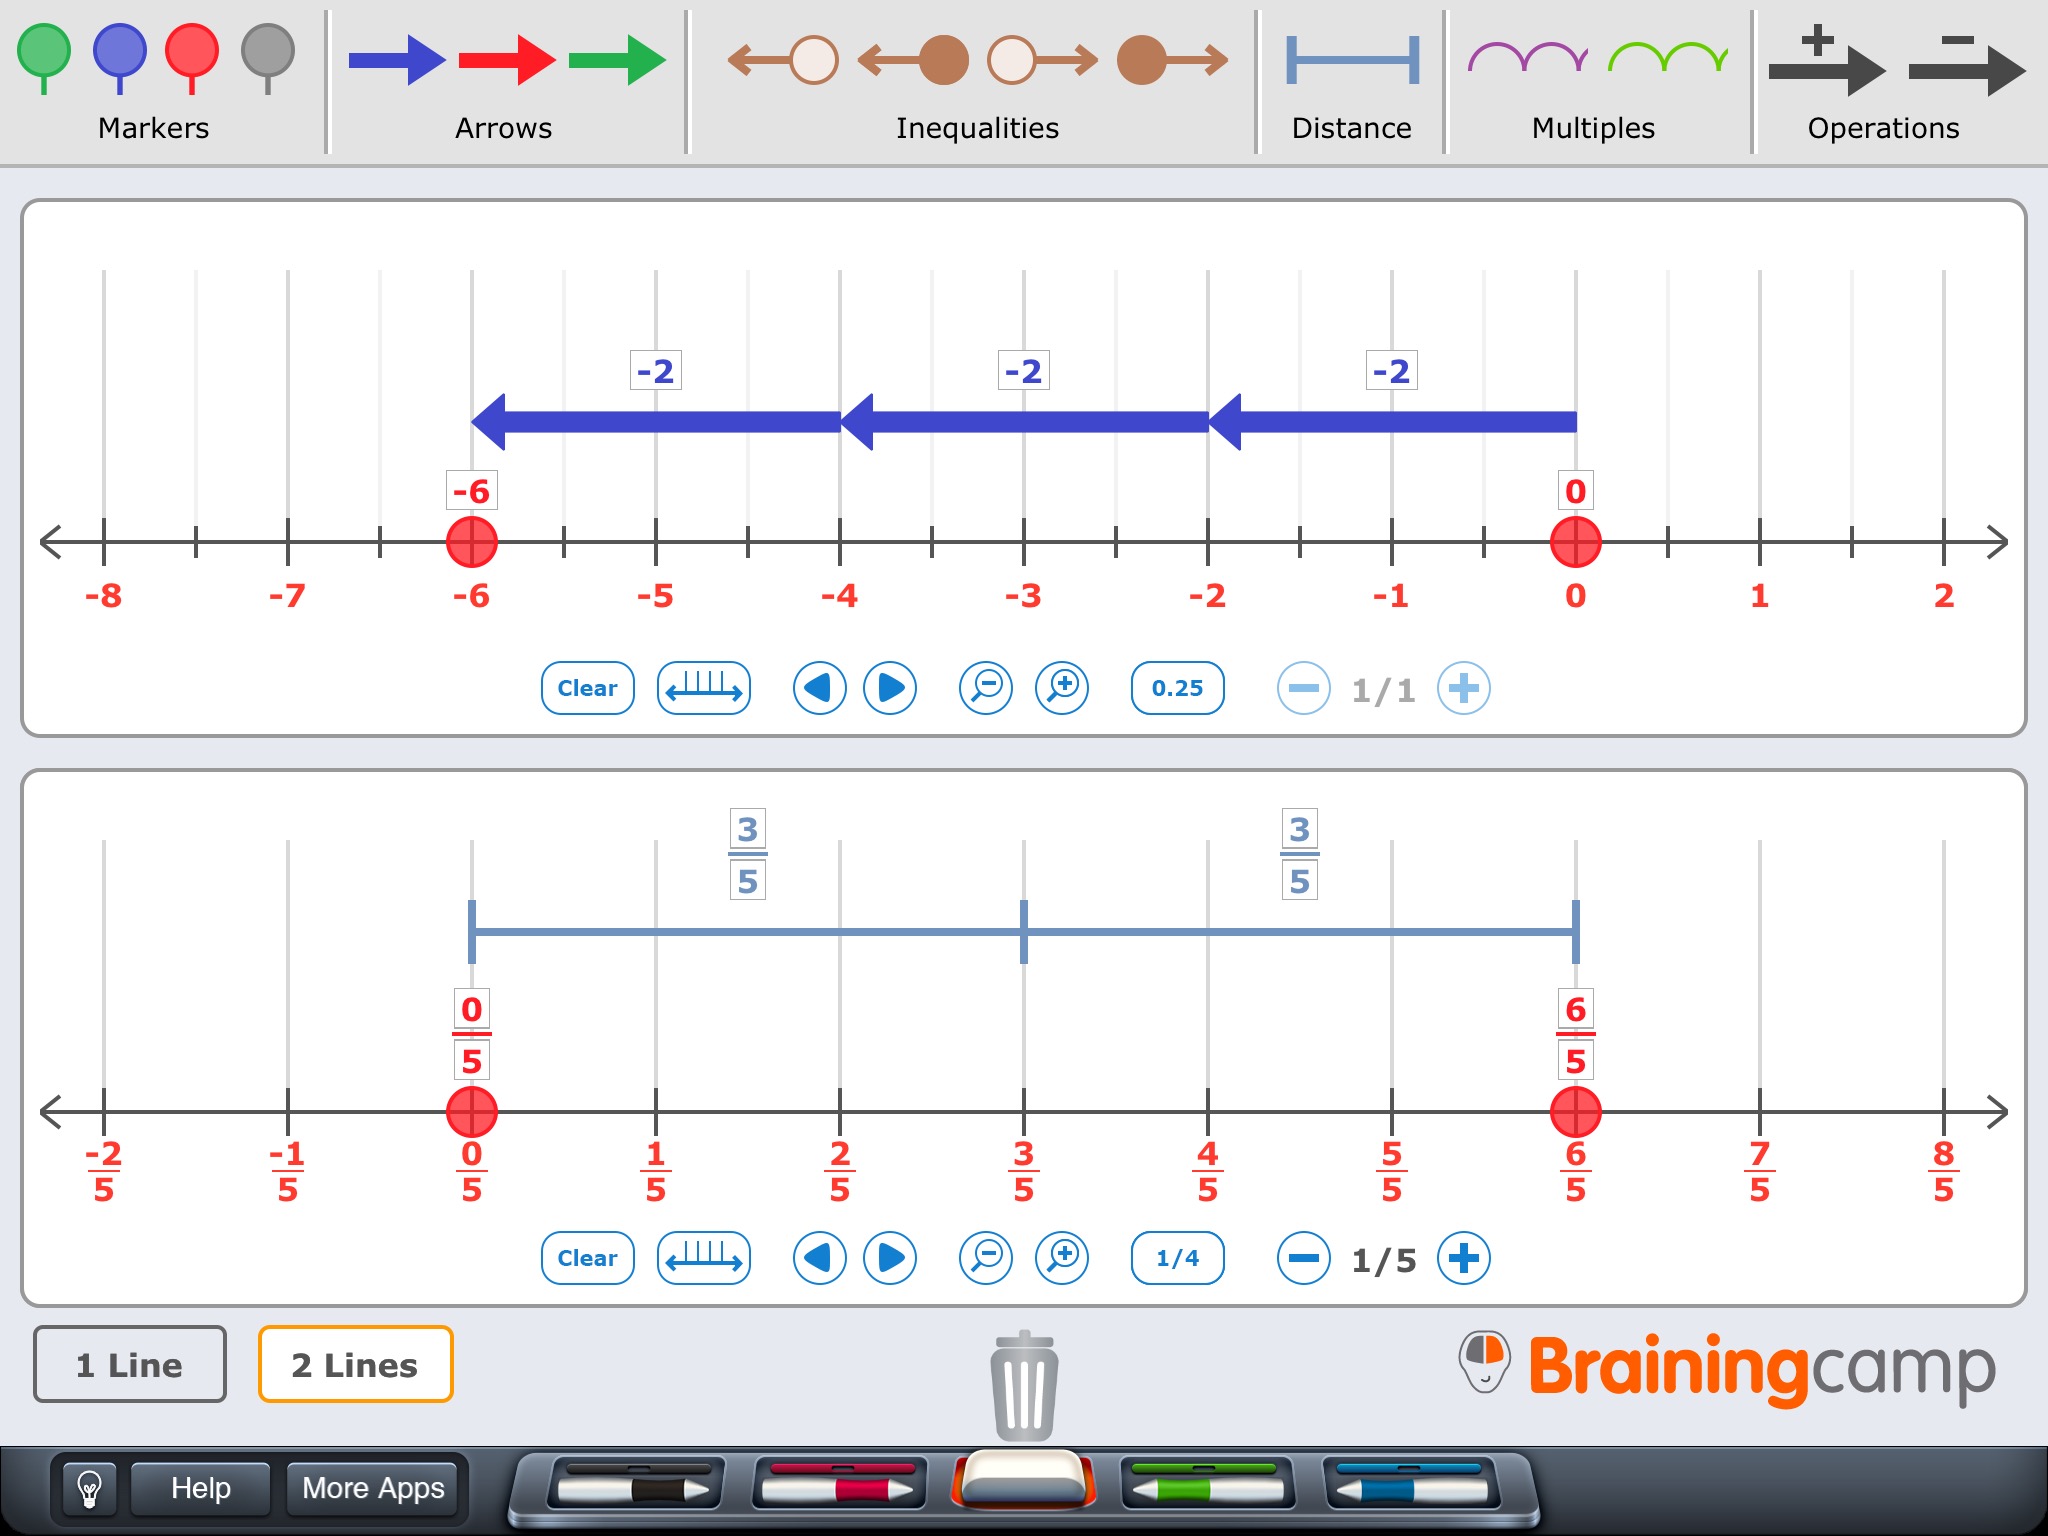
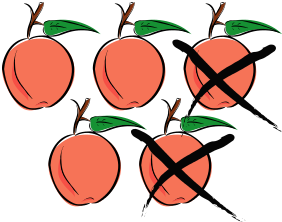
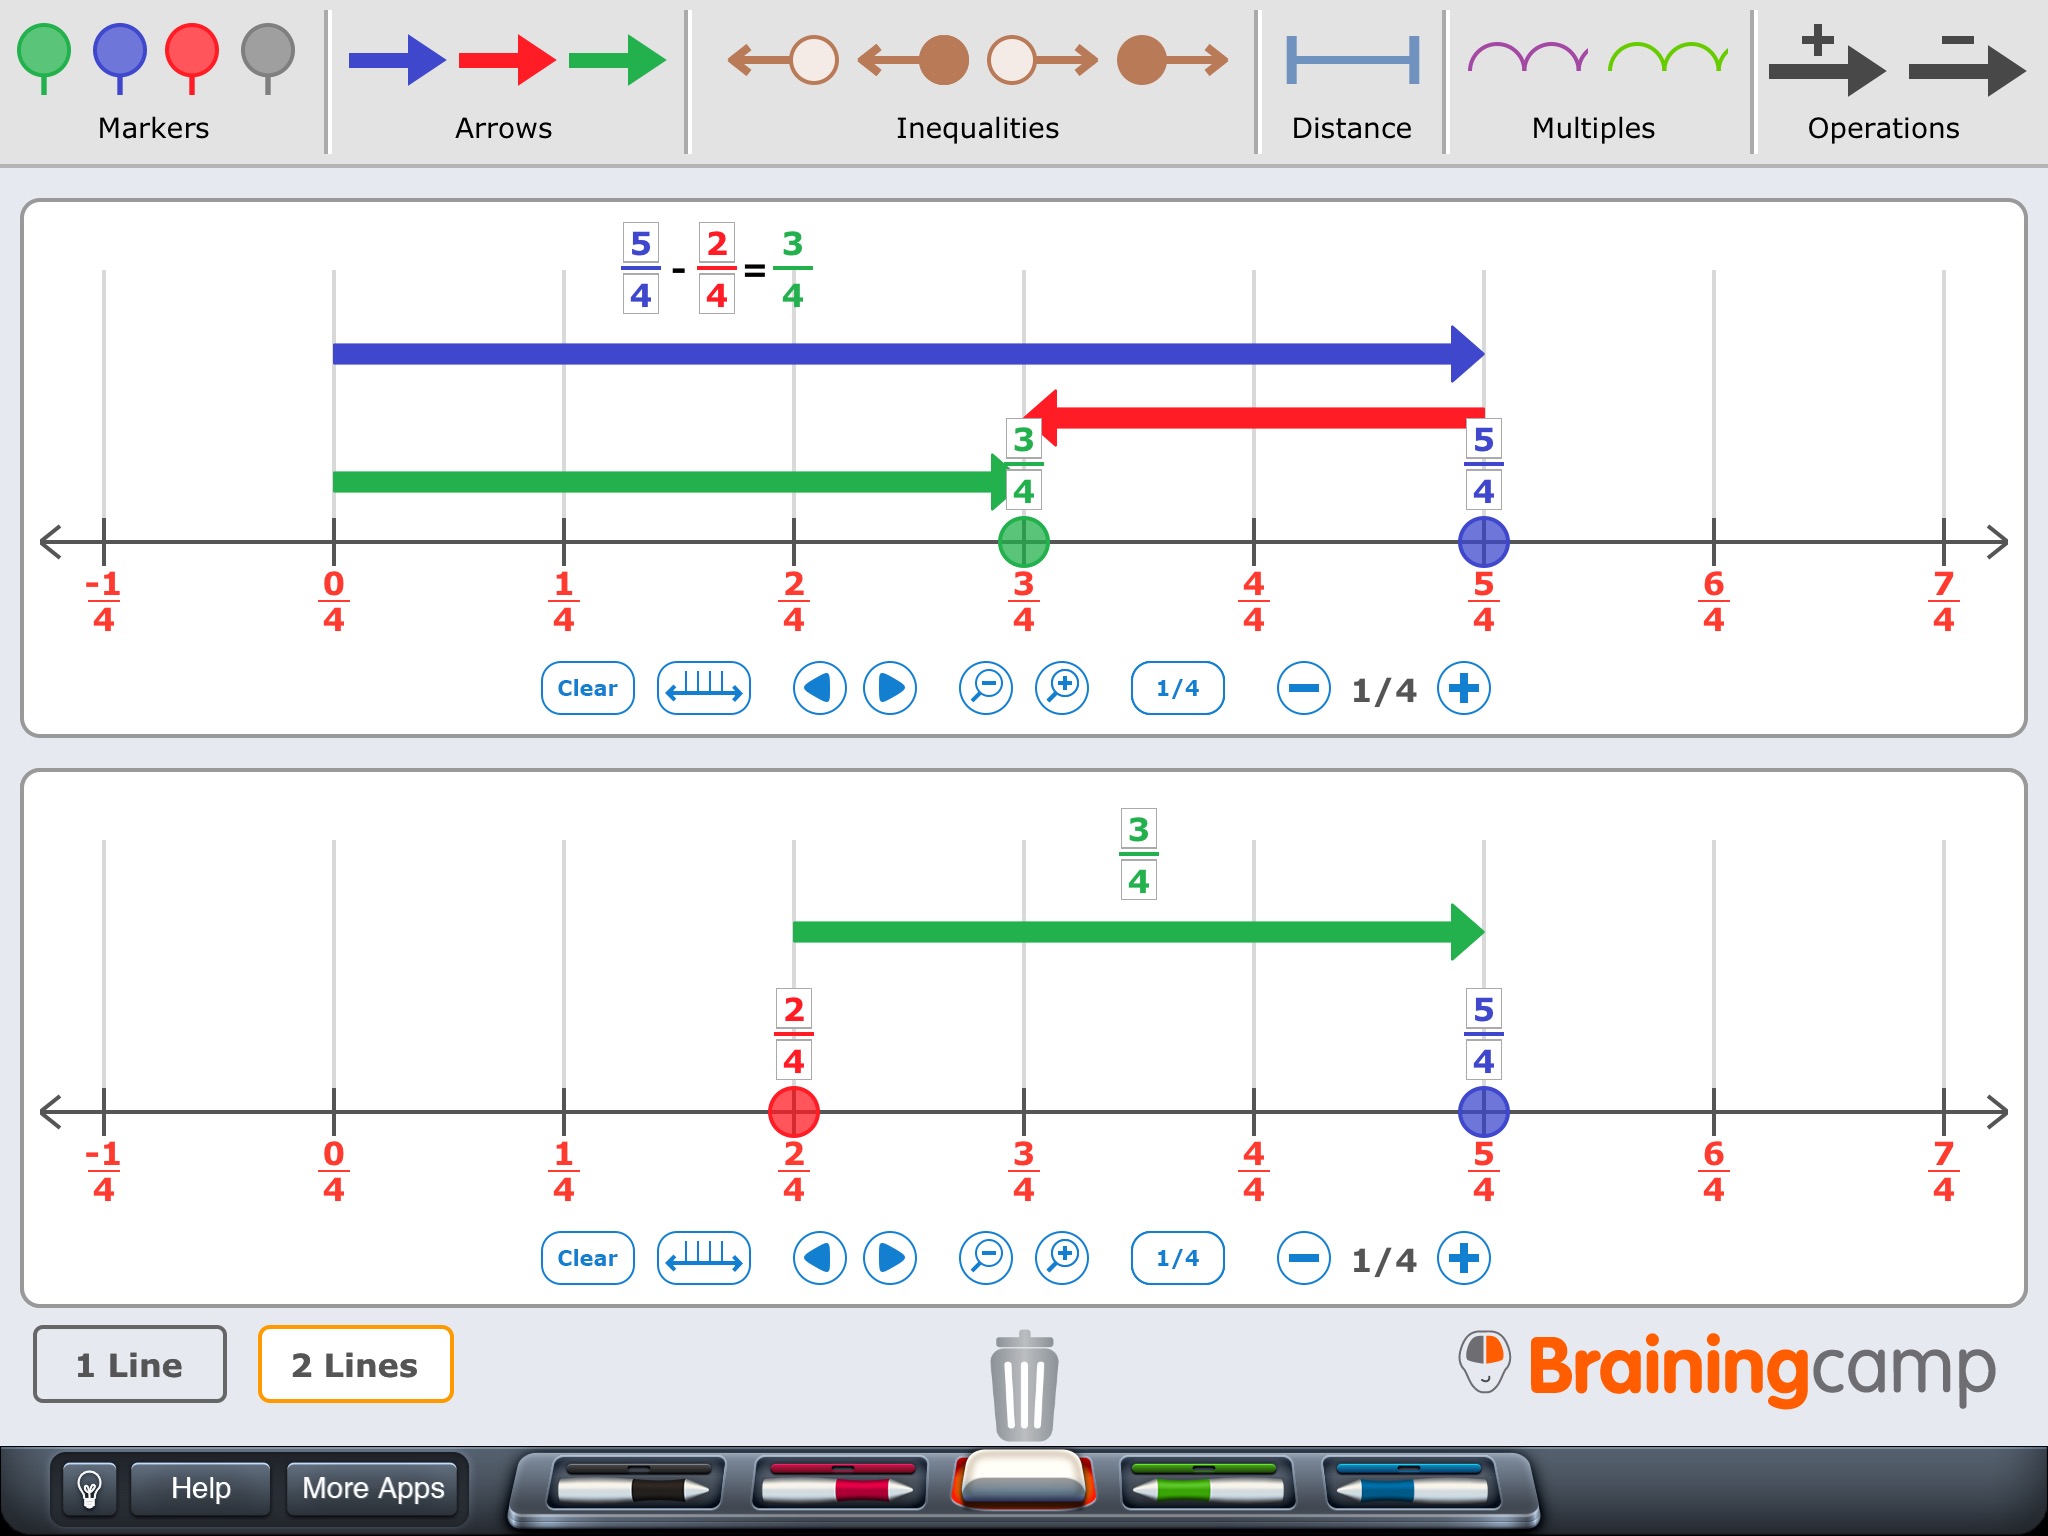
This reminded me of another passion of mine: the fundamental meanings of the operations. More specifically, subtraction as difference/comparison rather than take away/removal.

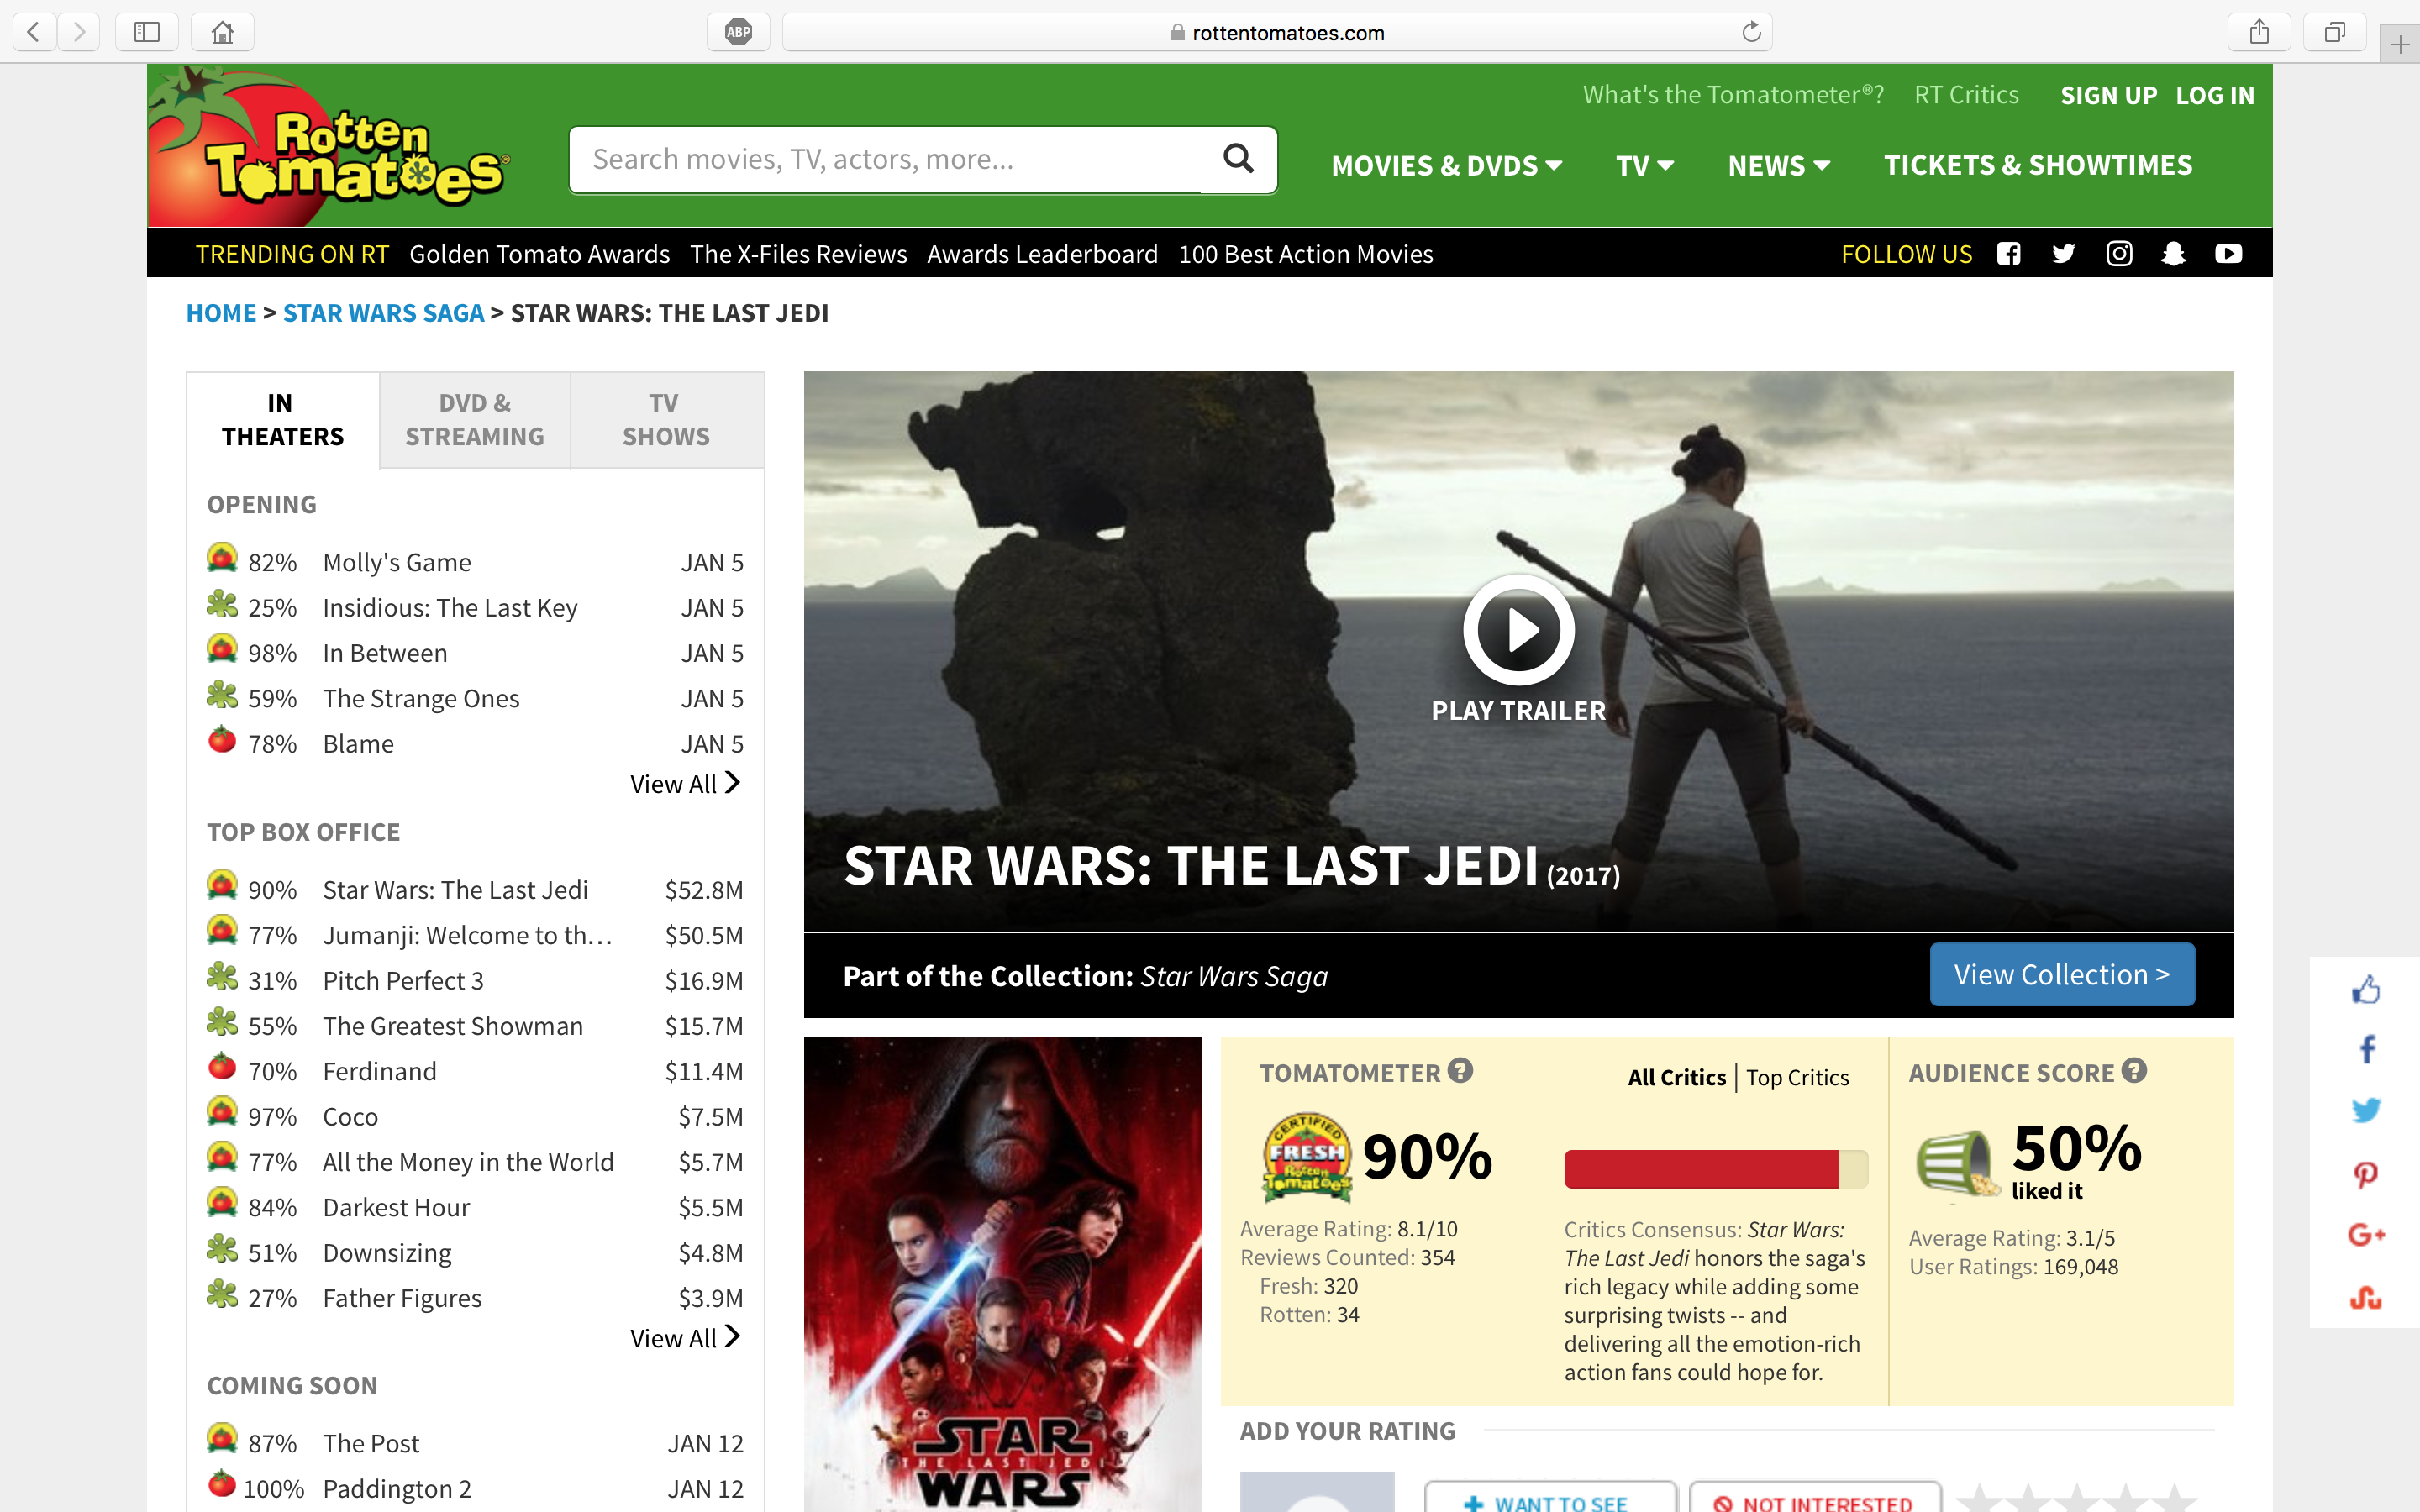
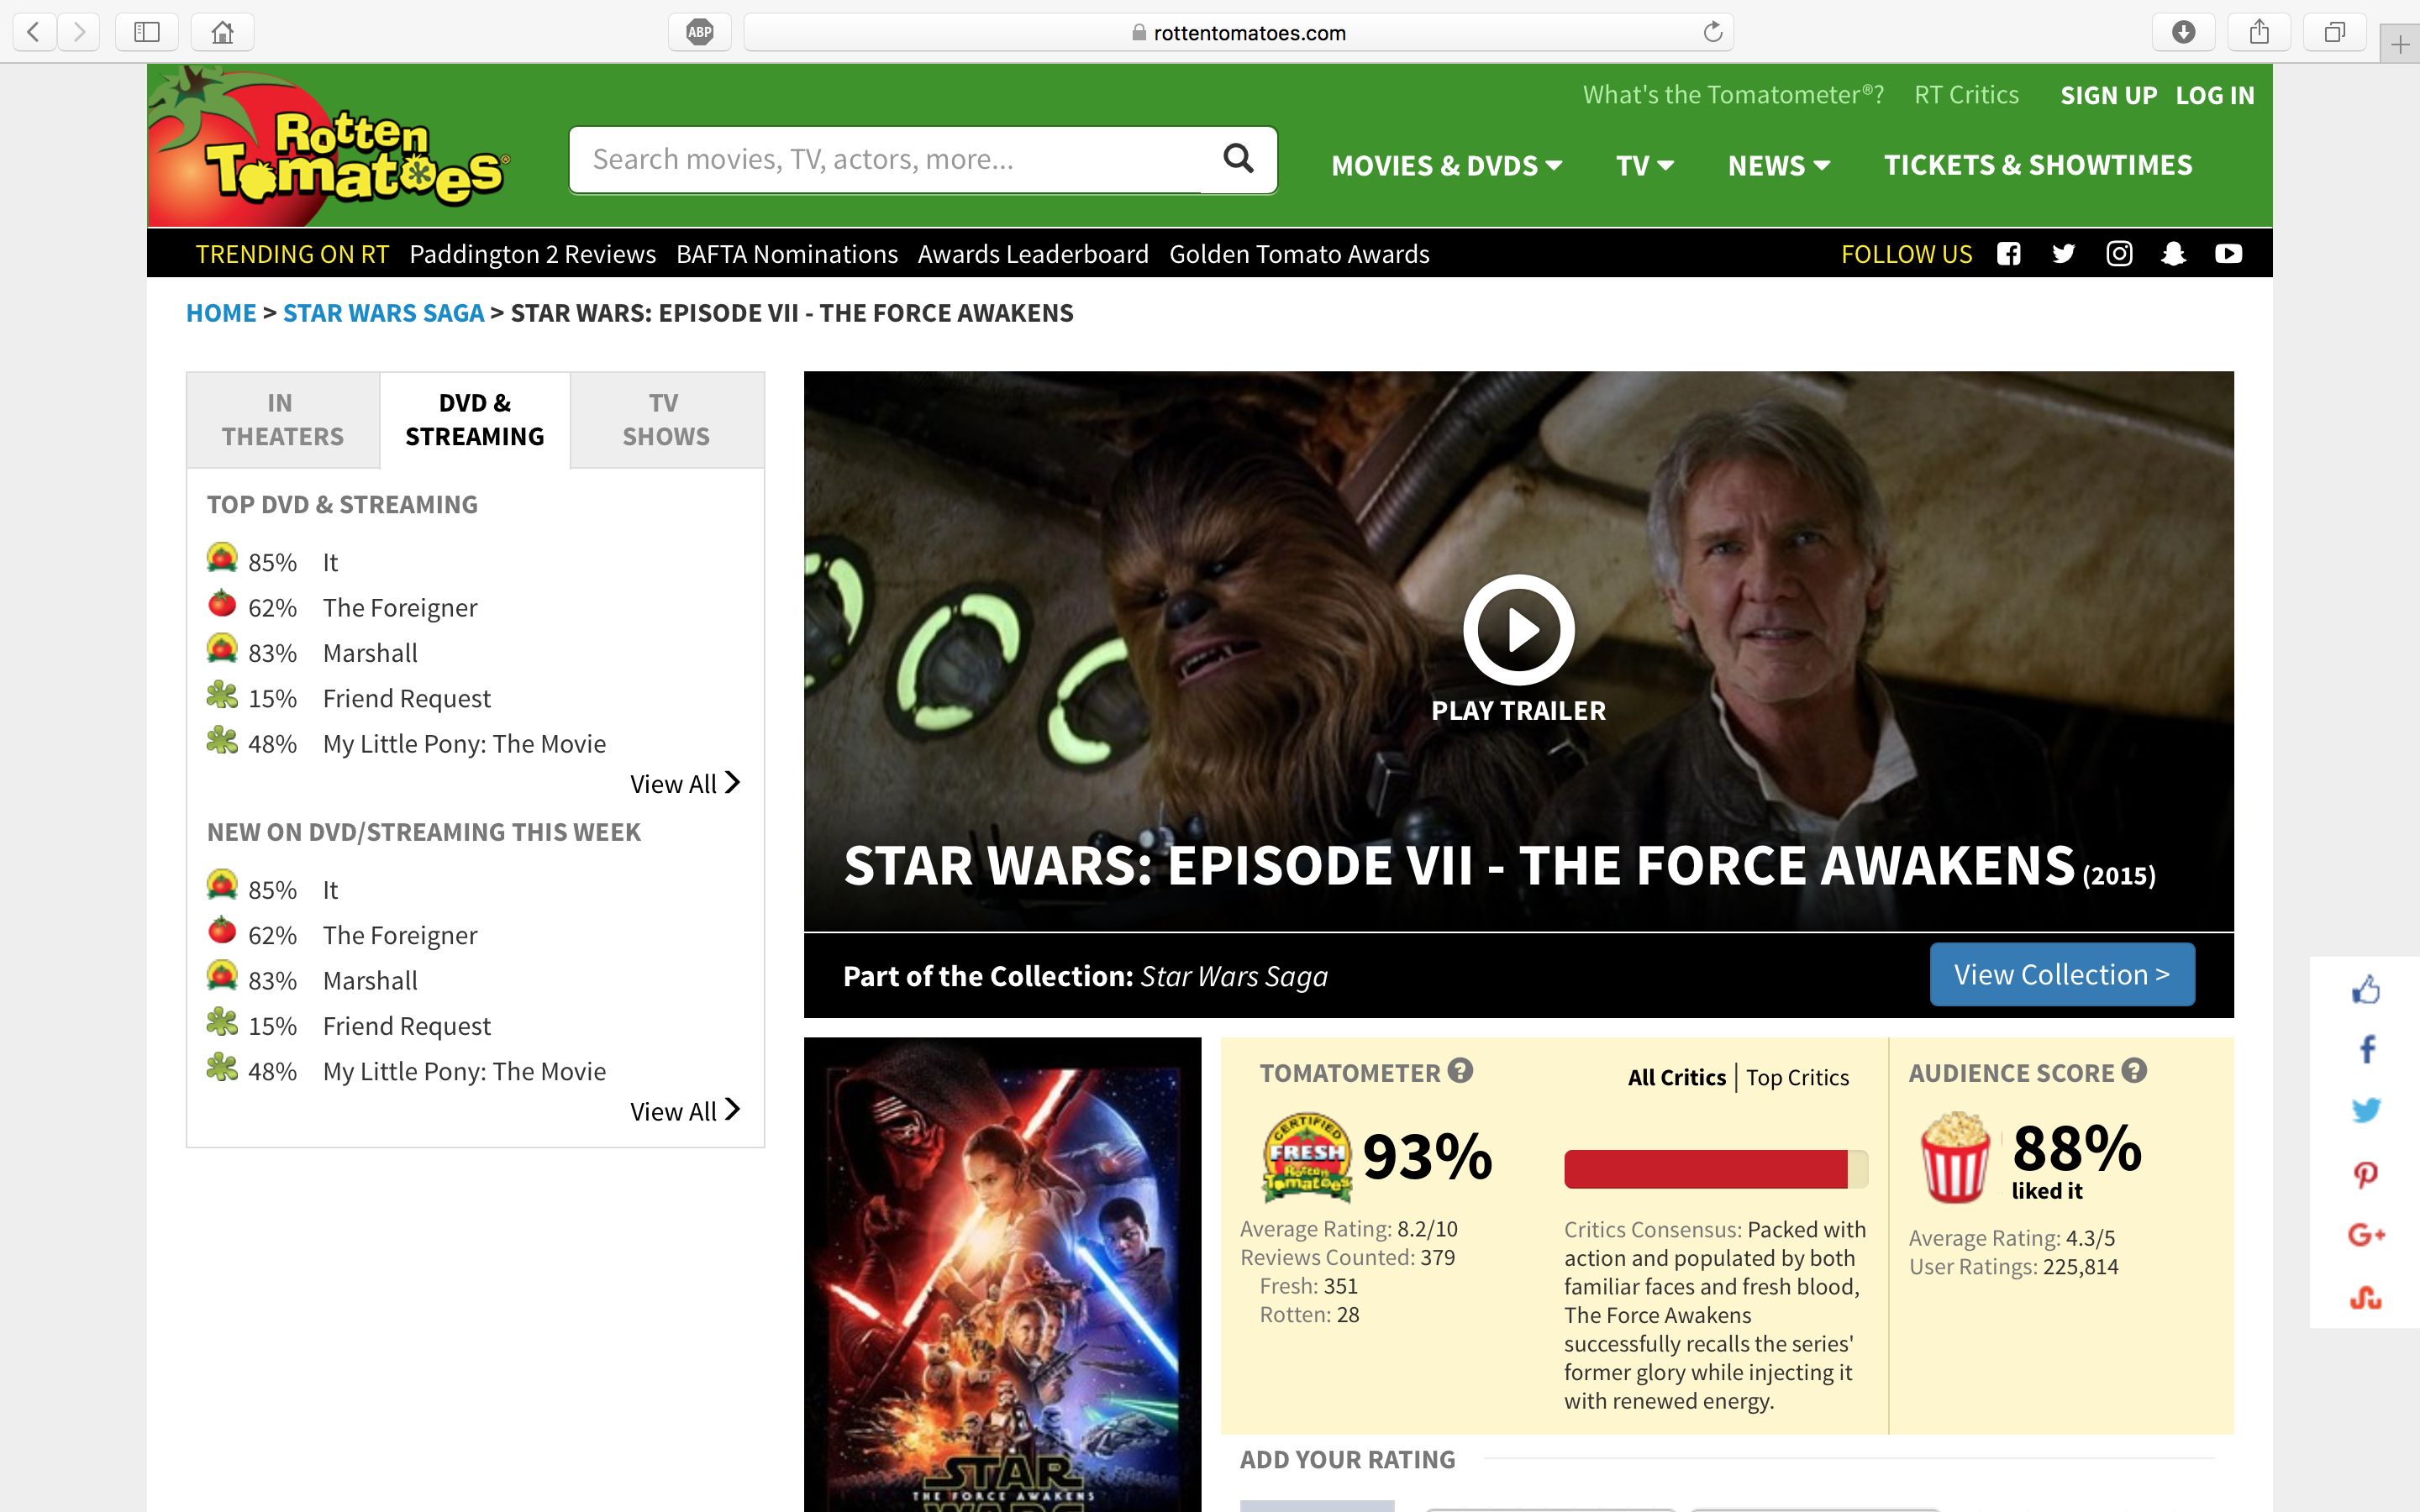
Here are the Rotten Tomatoes scores for The Force Awakens:

Tomatometer -- Episode VIII

Episode I | II | III | IV | V | VI | VII | Rogue One | What is the Tomatometer?

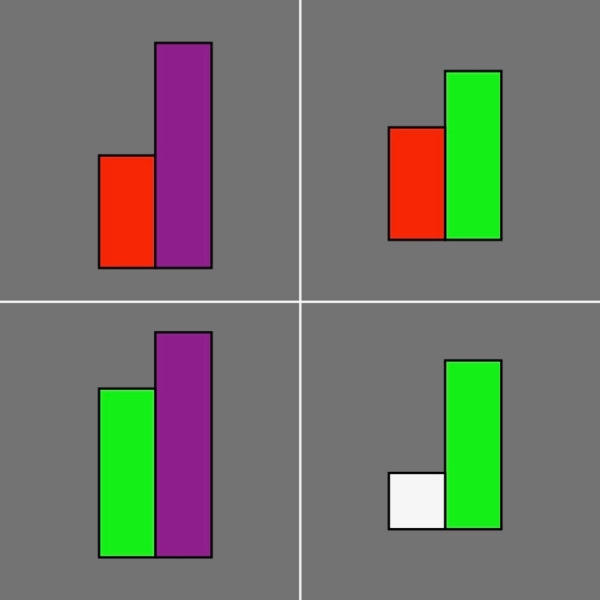
What’s the meaning, in context, of 50 – 90?

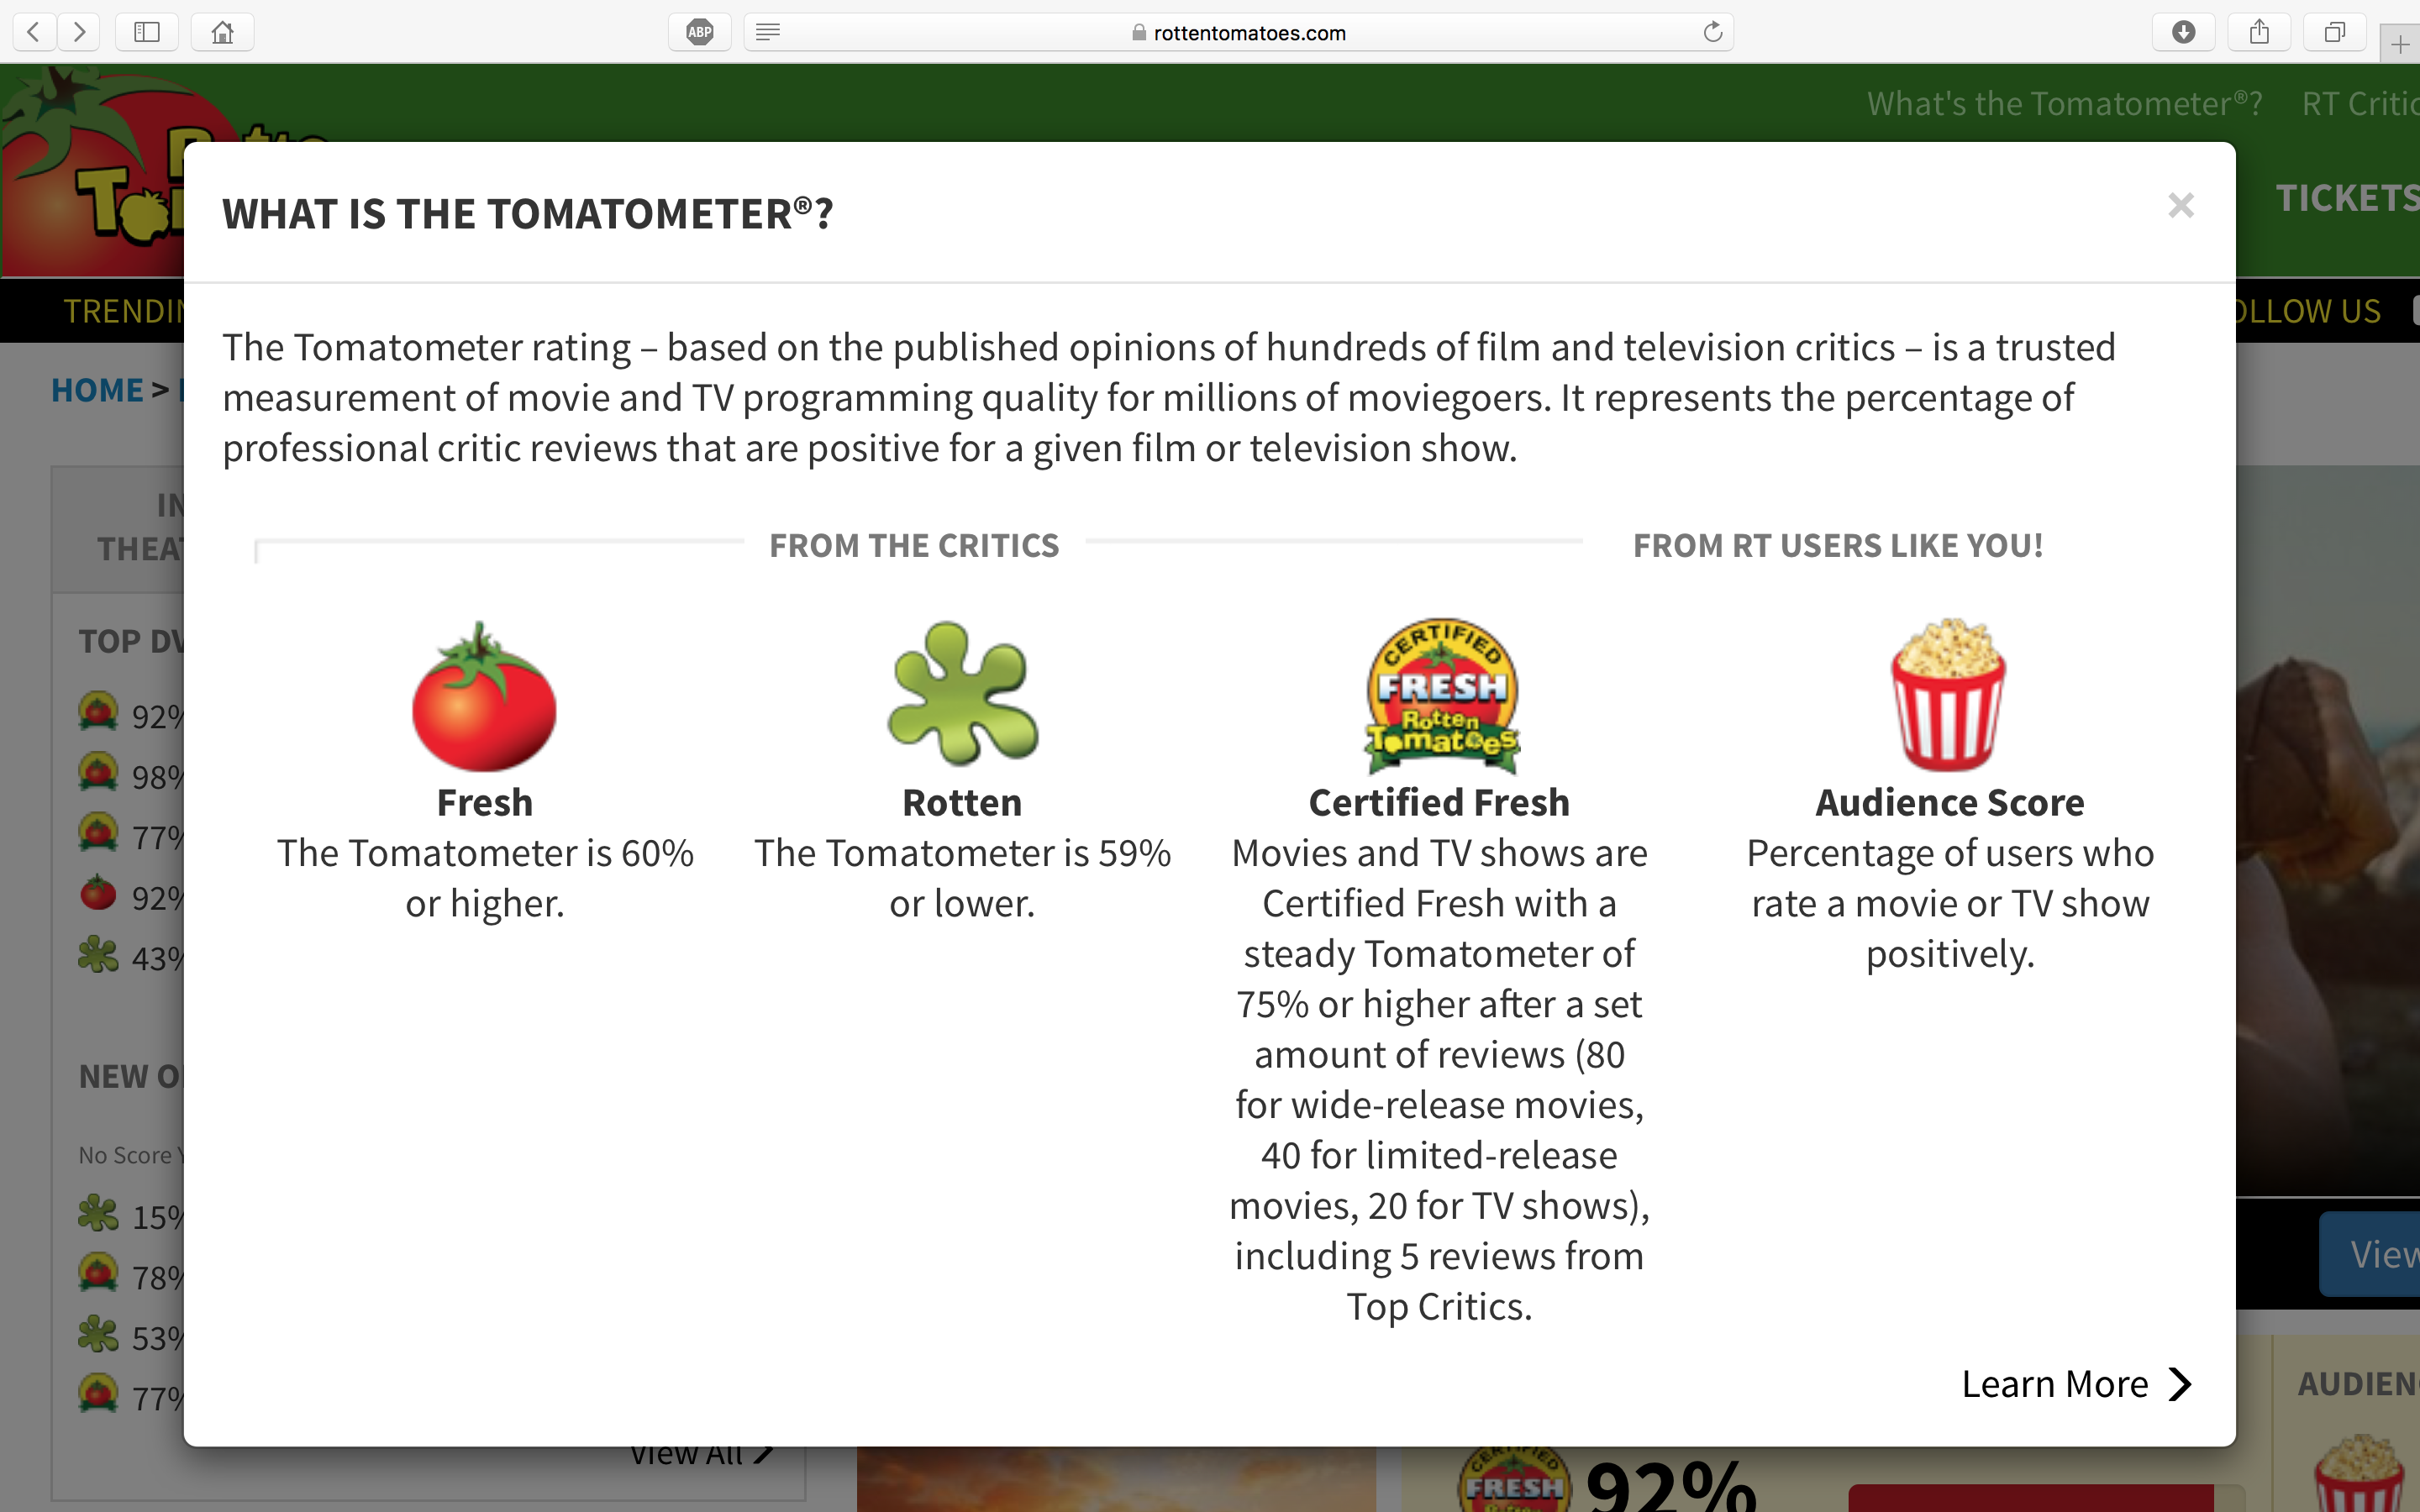
We’re measuring the gap between the percentage of professional critics (“Tomatometer rating”) and Rotten Tomatoes users (“Audience Score”) who rate the movie positively. We’re talking comparison, not removal. There’s a difference of 40%. Moreover, the difference here is negative (albeit my minuend/subtrahend decision is kinda arbitrary). This means that The Last Jedi is far less favourable among moviegoers as a group than among professional movie critics. We can compare this gap with that of others in the Star Wars franchise:

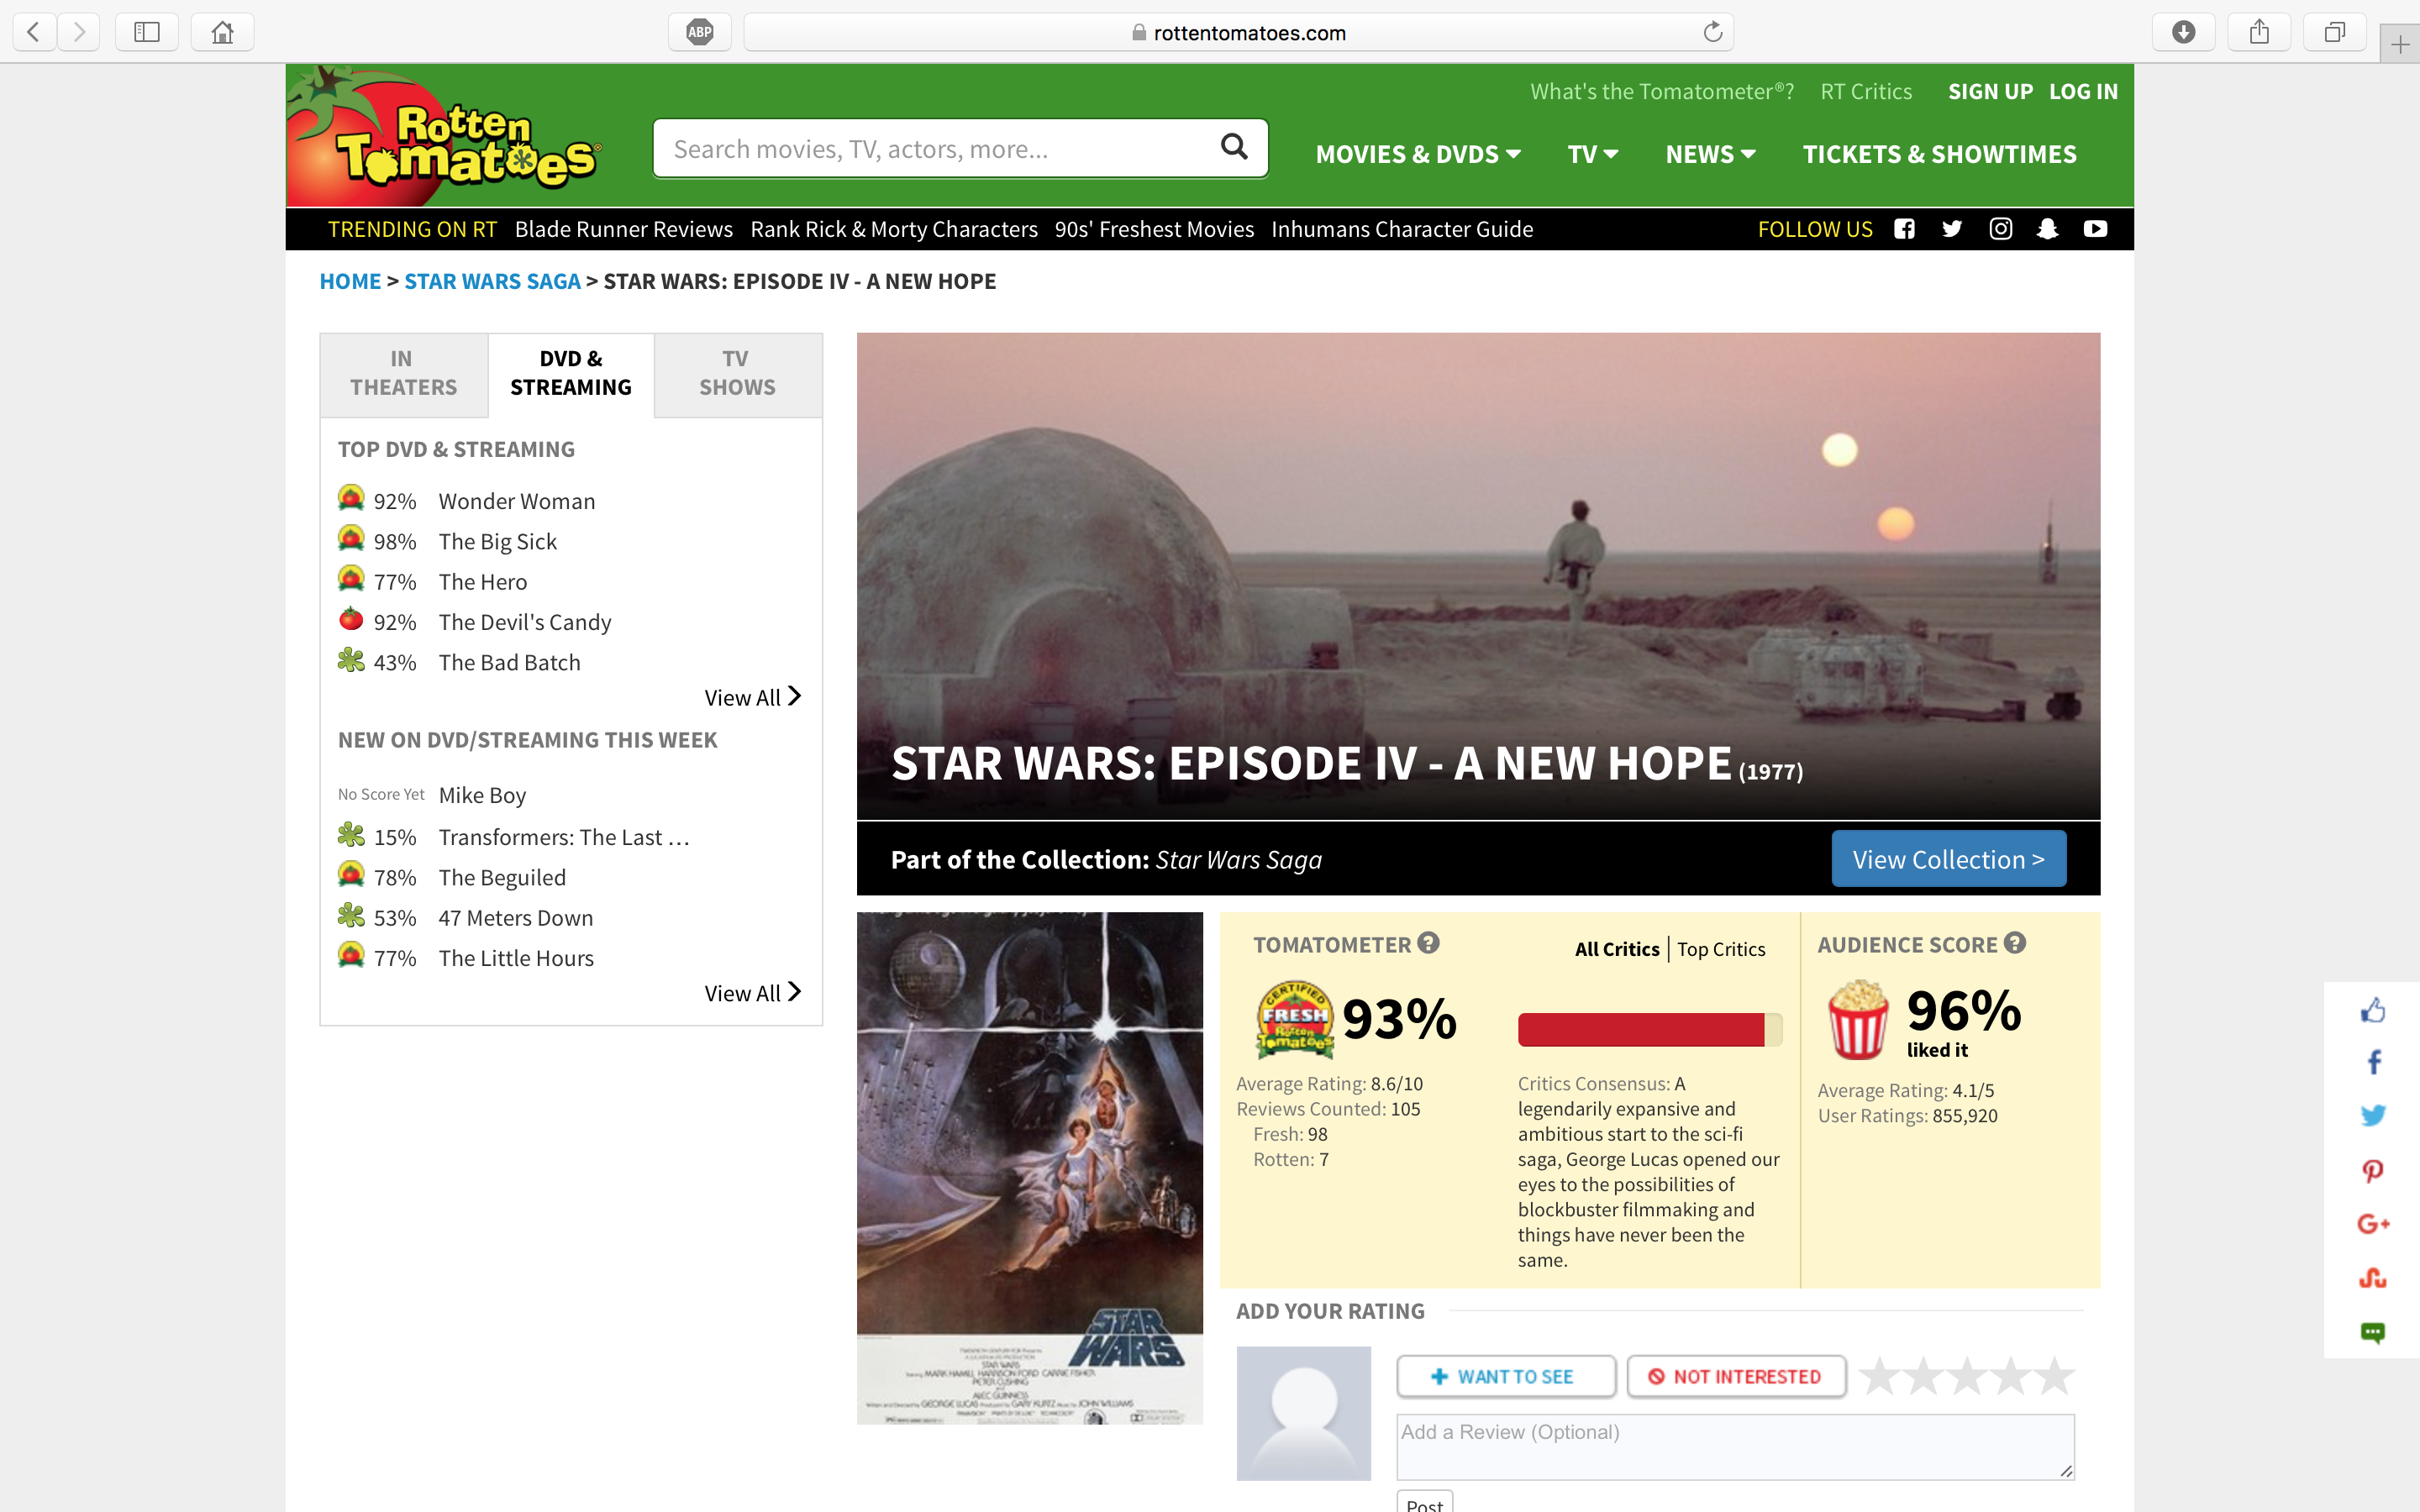
Episode IV: A New Hope (1977) → 96 – 93 = +3
Episode V: The Empire Strikes Back (1980) → 97 – 94 = +3
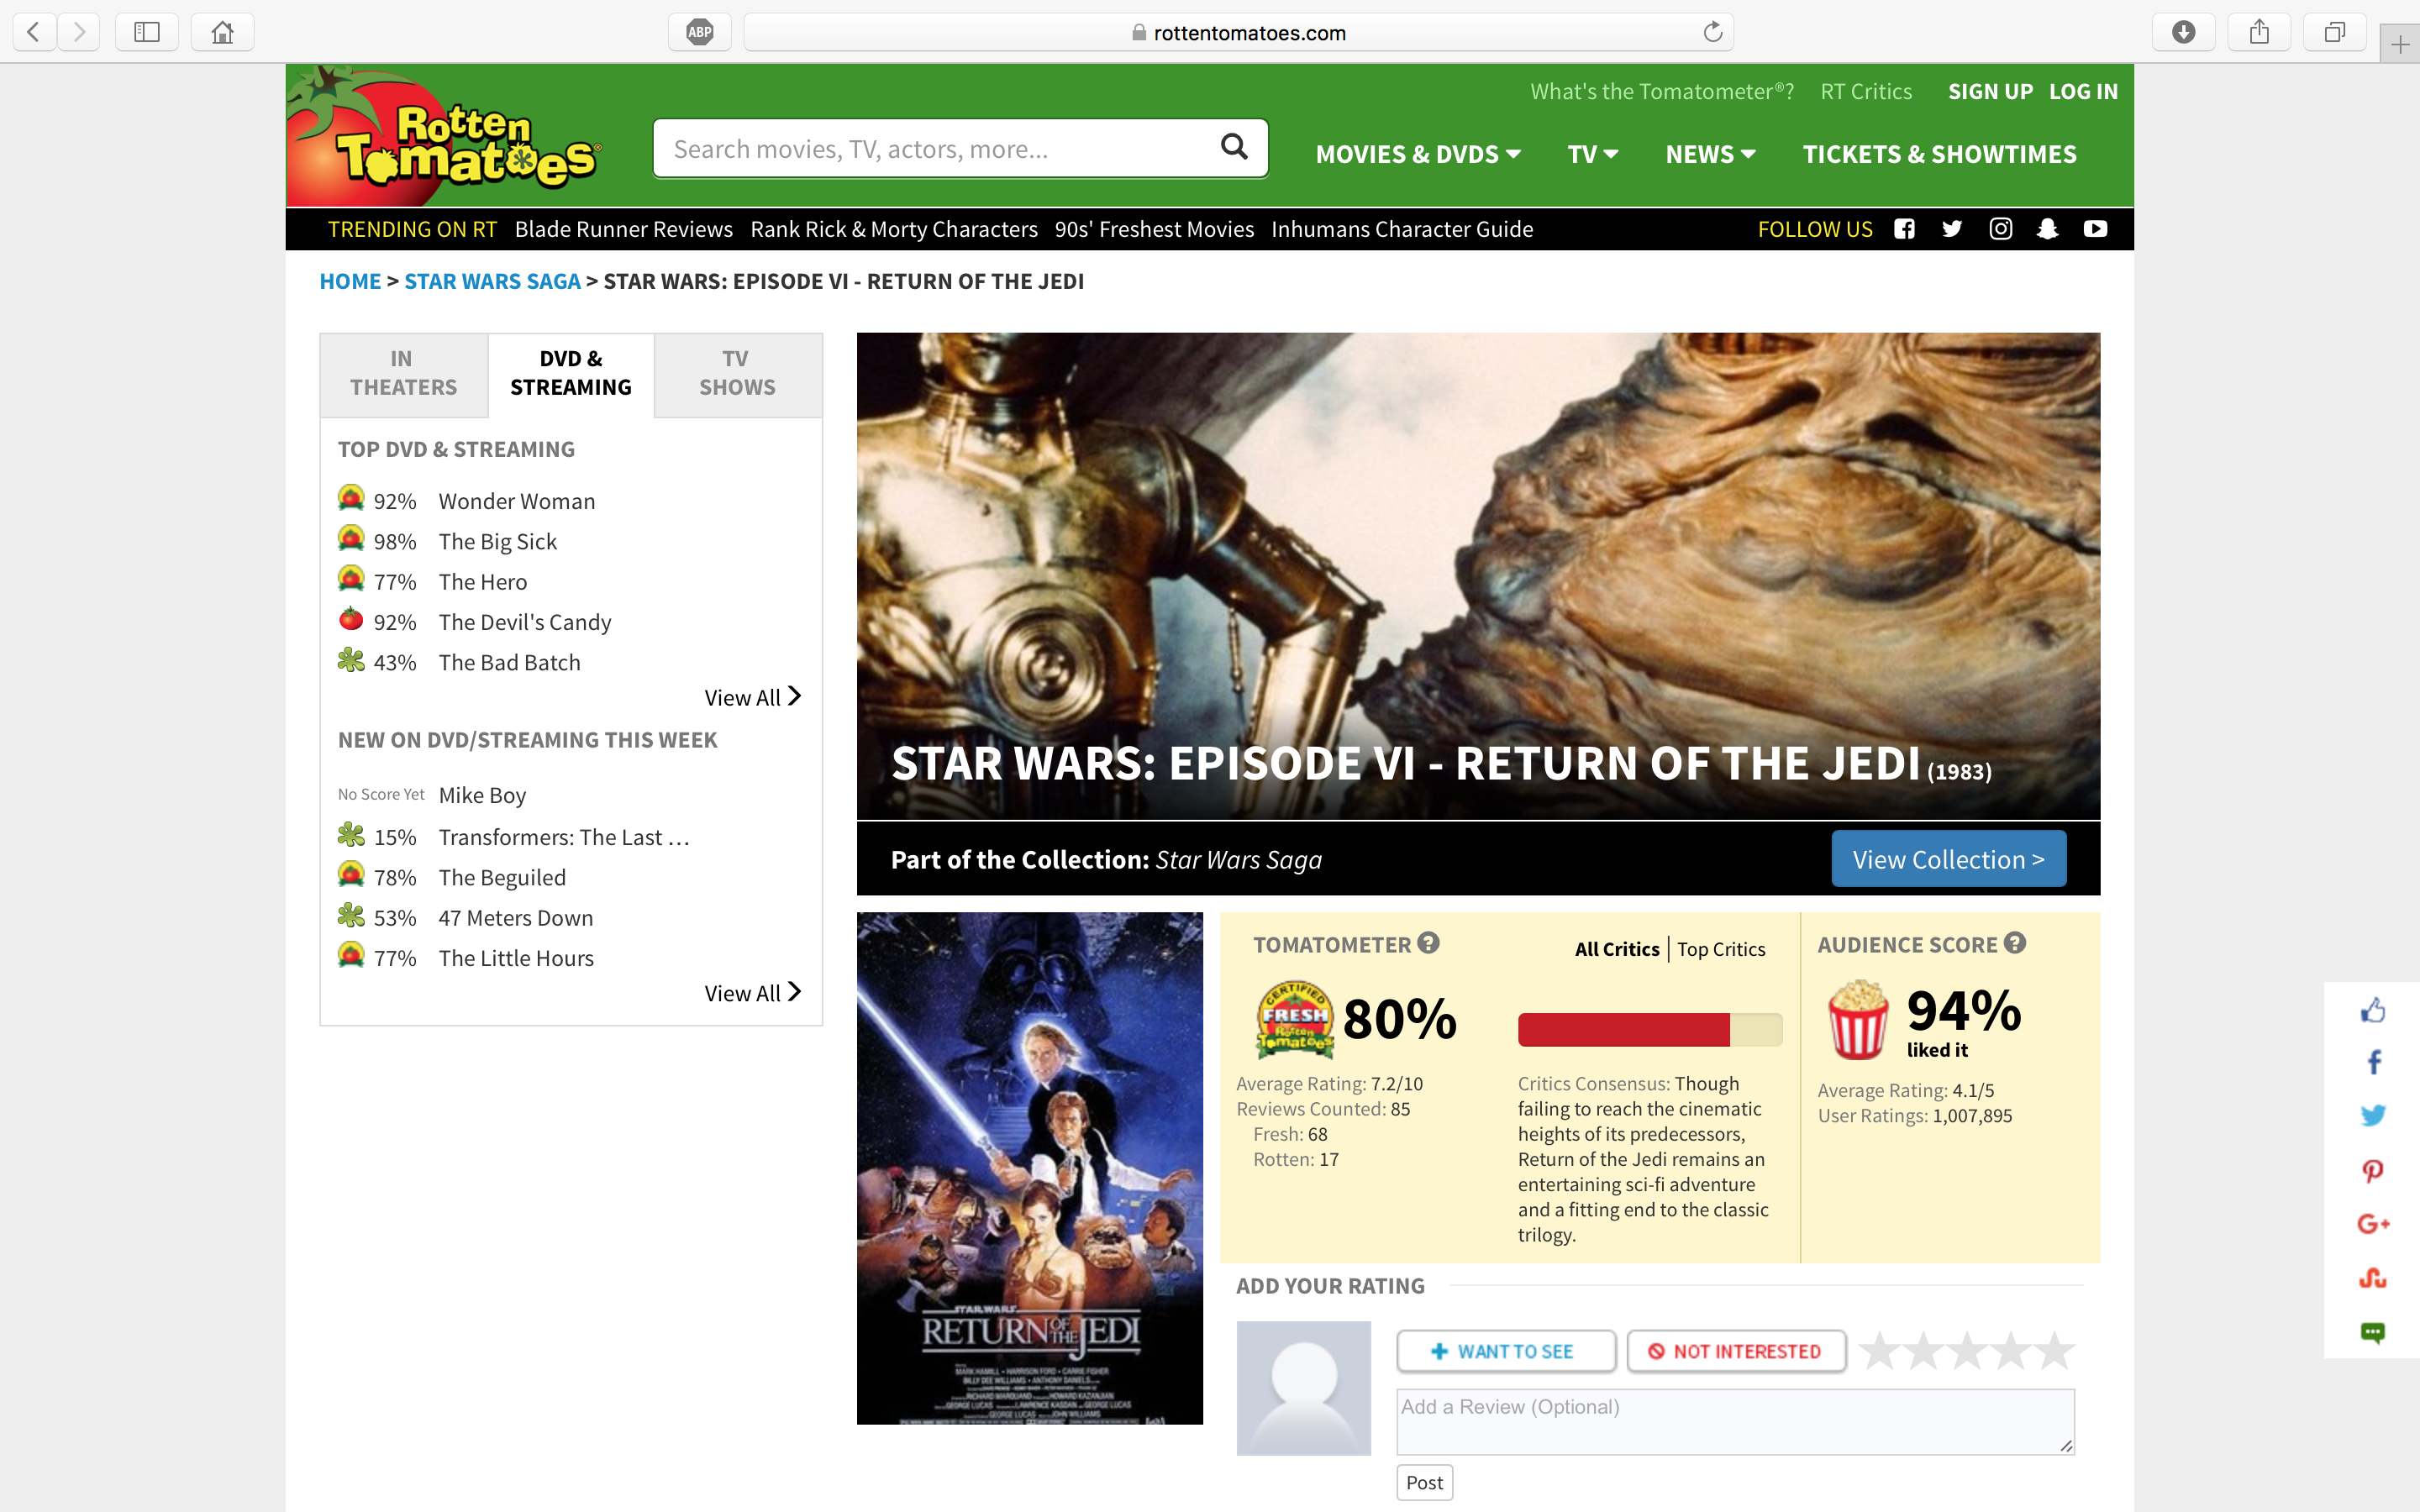
Episode VI: Return of the Jedi (1983) → 94 – 80 = +14
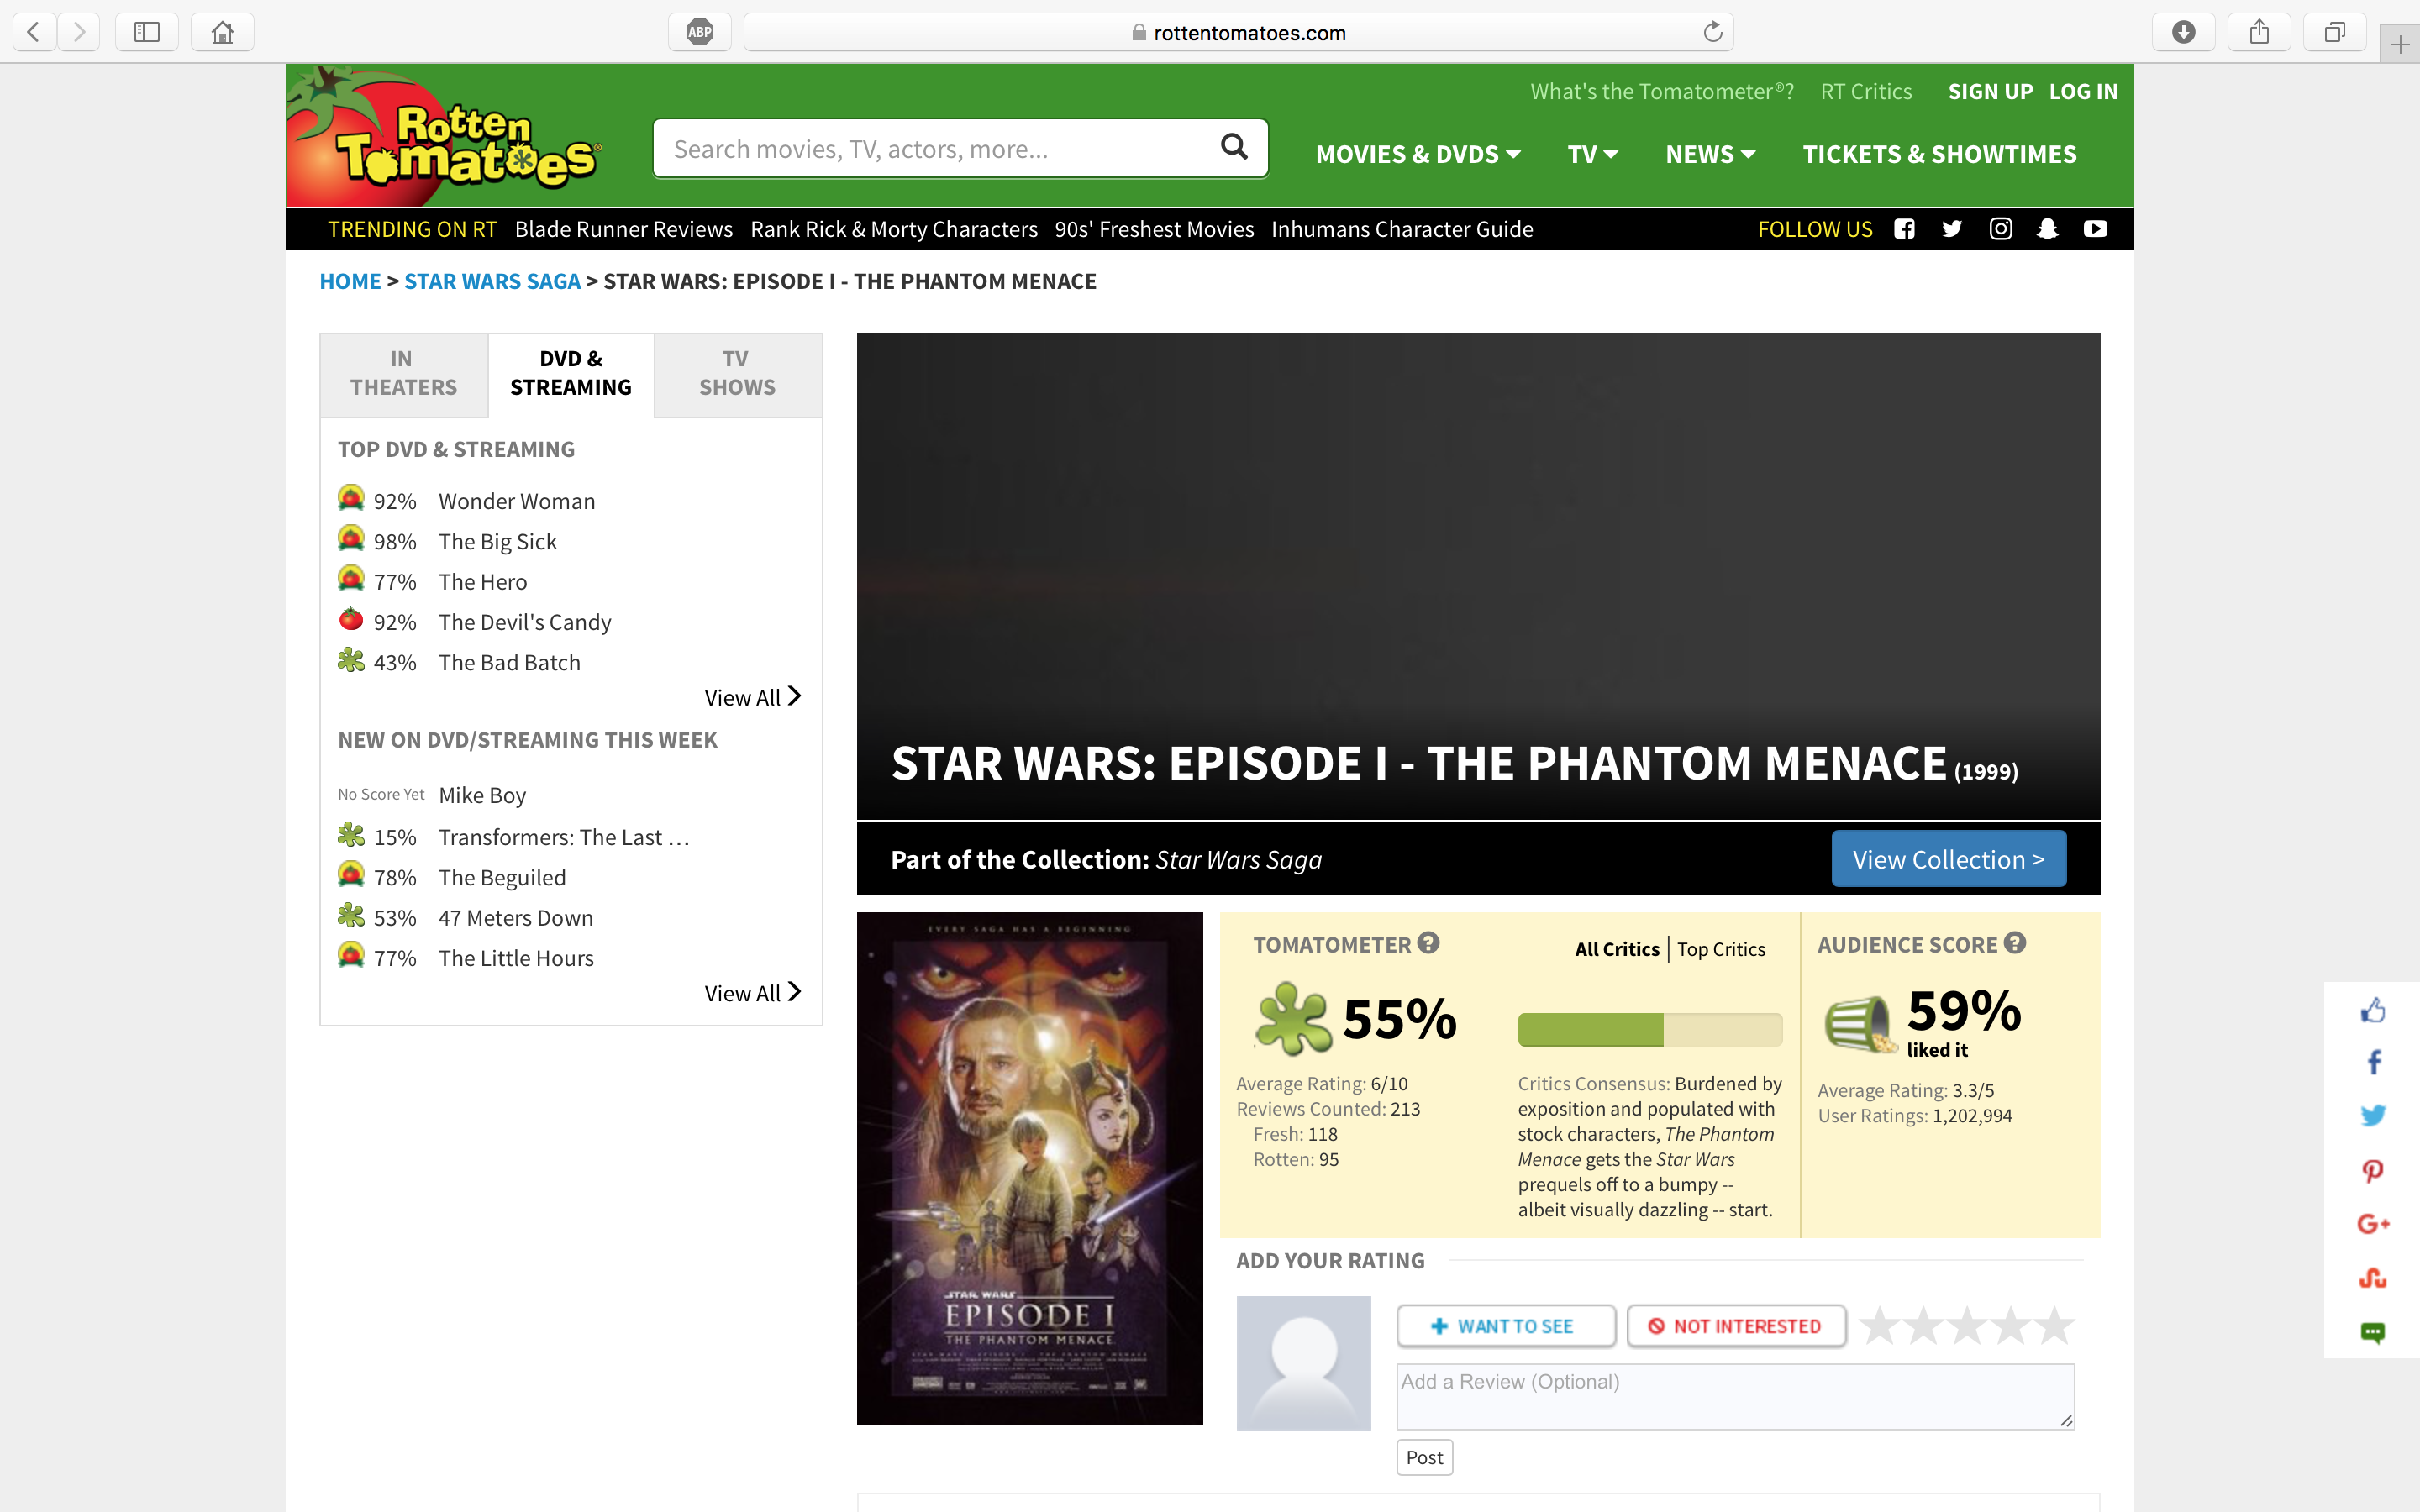
Episode I: The Phantom Menace (1999) → 59 – 55 = +4
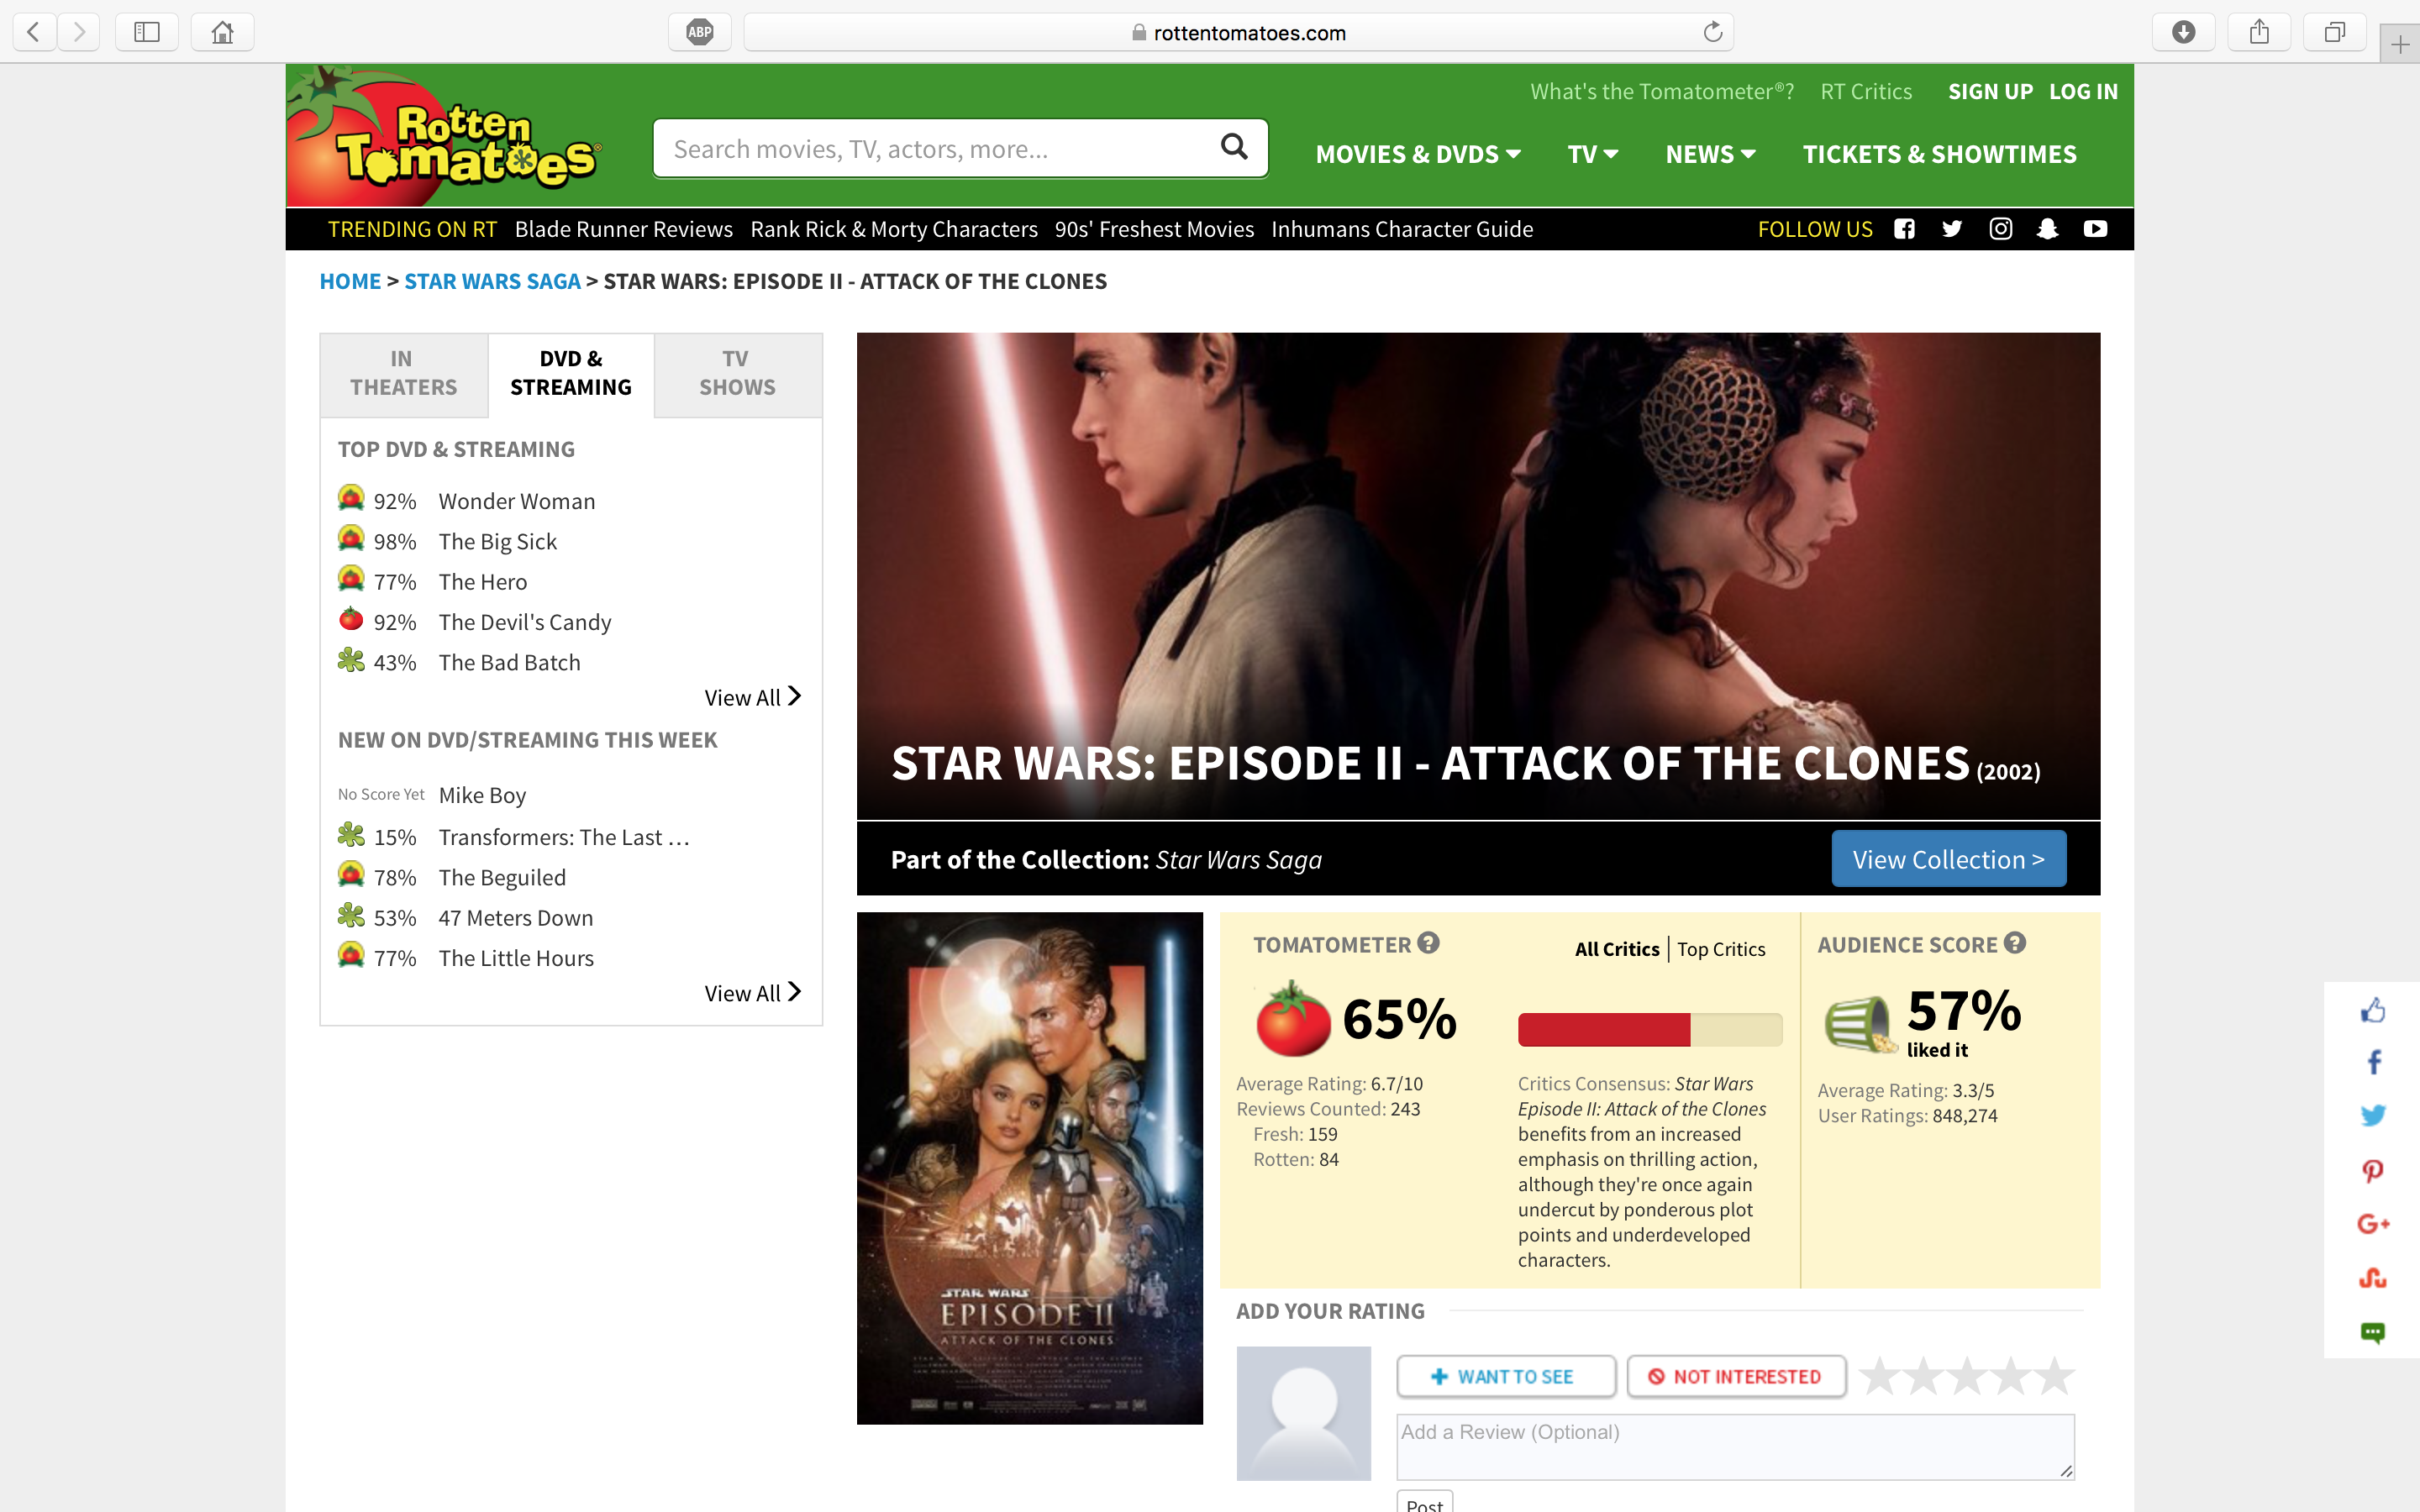
Episode II: Attack of the Clones (2002) → 57 – 65 = -8
Episode III: Revenge of the Sith (2005) → 65 – 79 = -14
Episode VII: The Force Awakens (2015) → 88 – 93 = -5
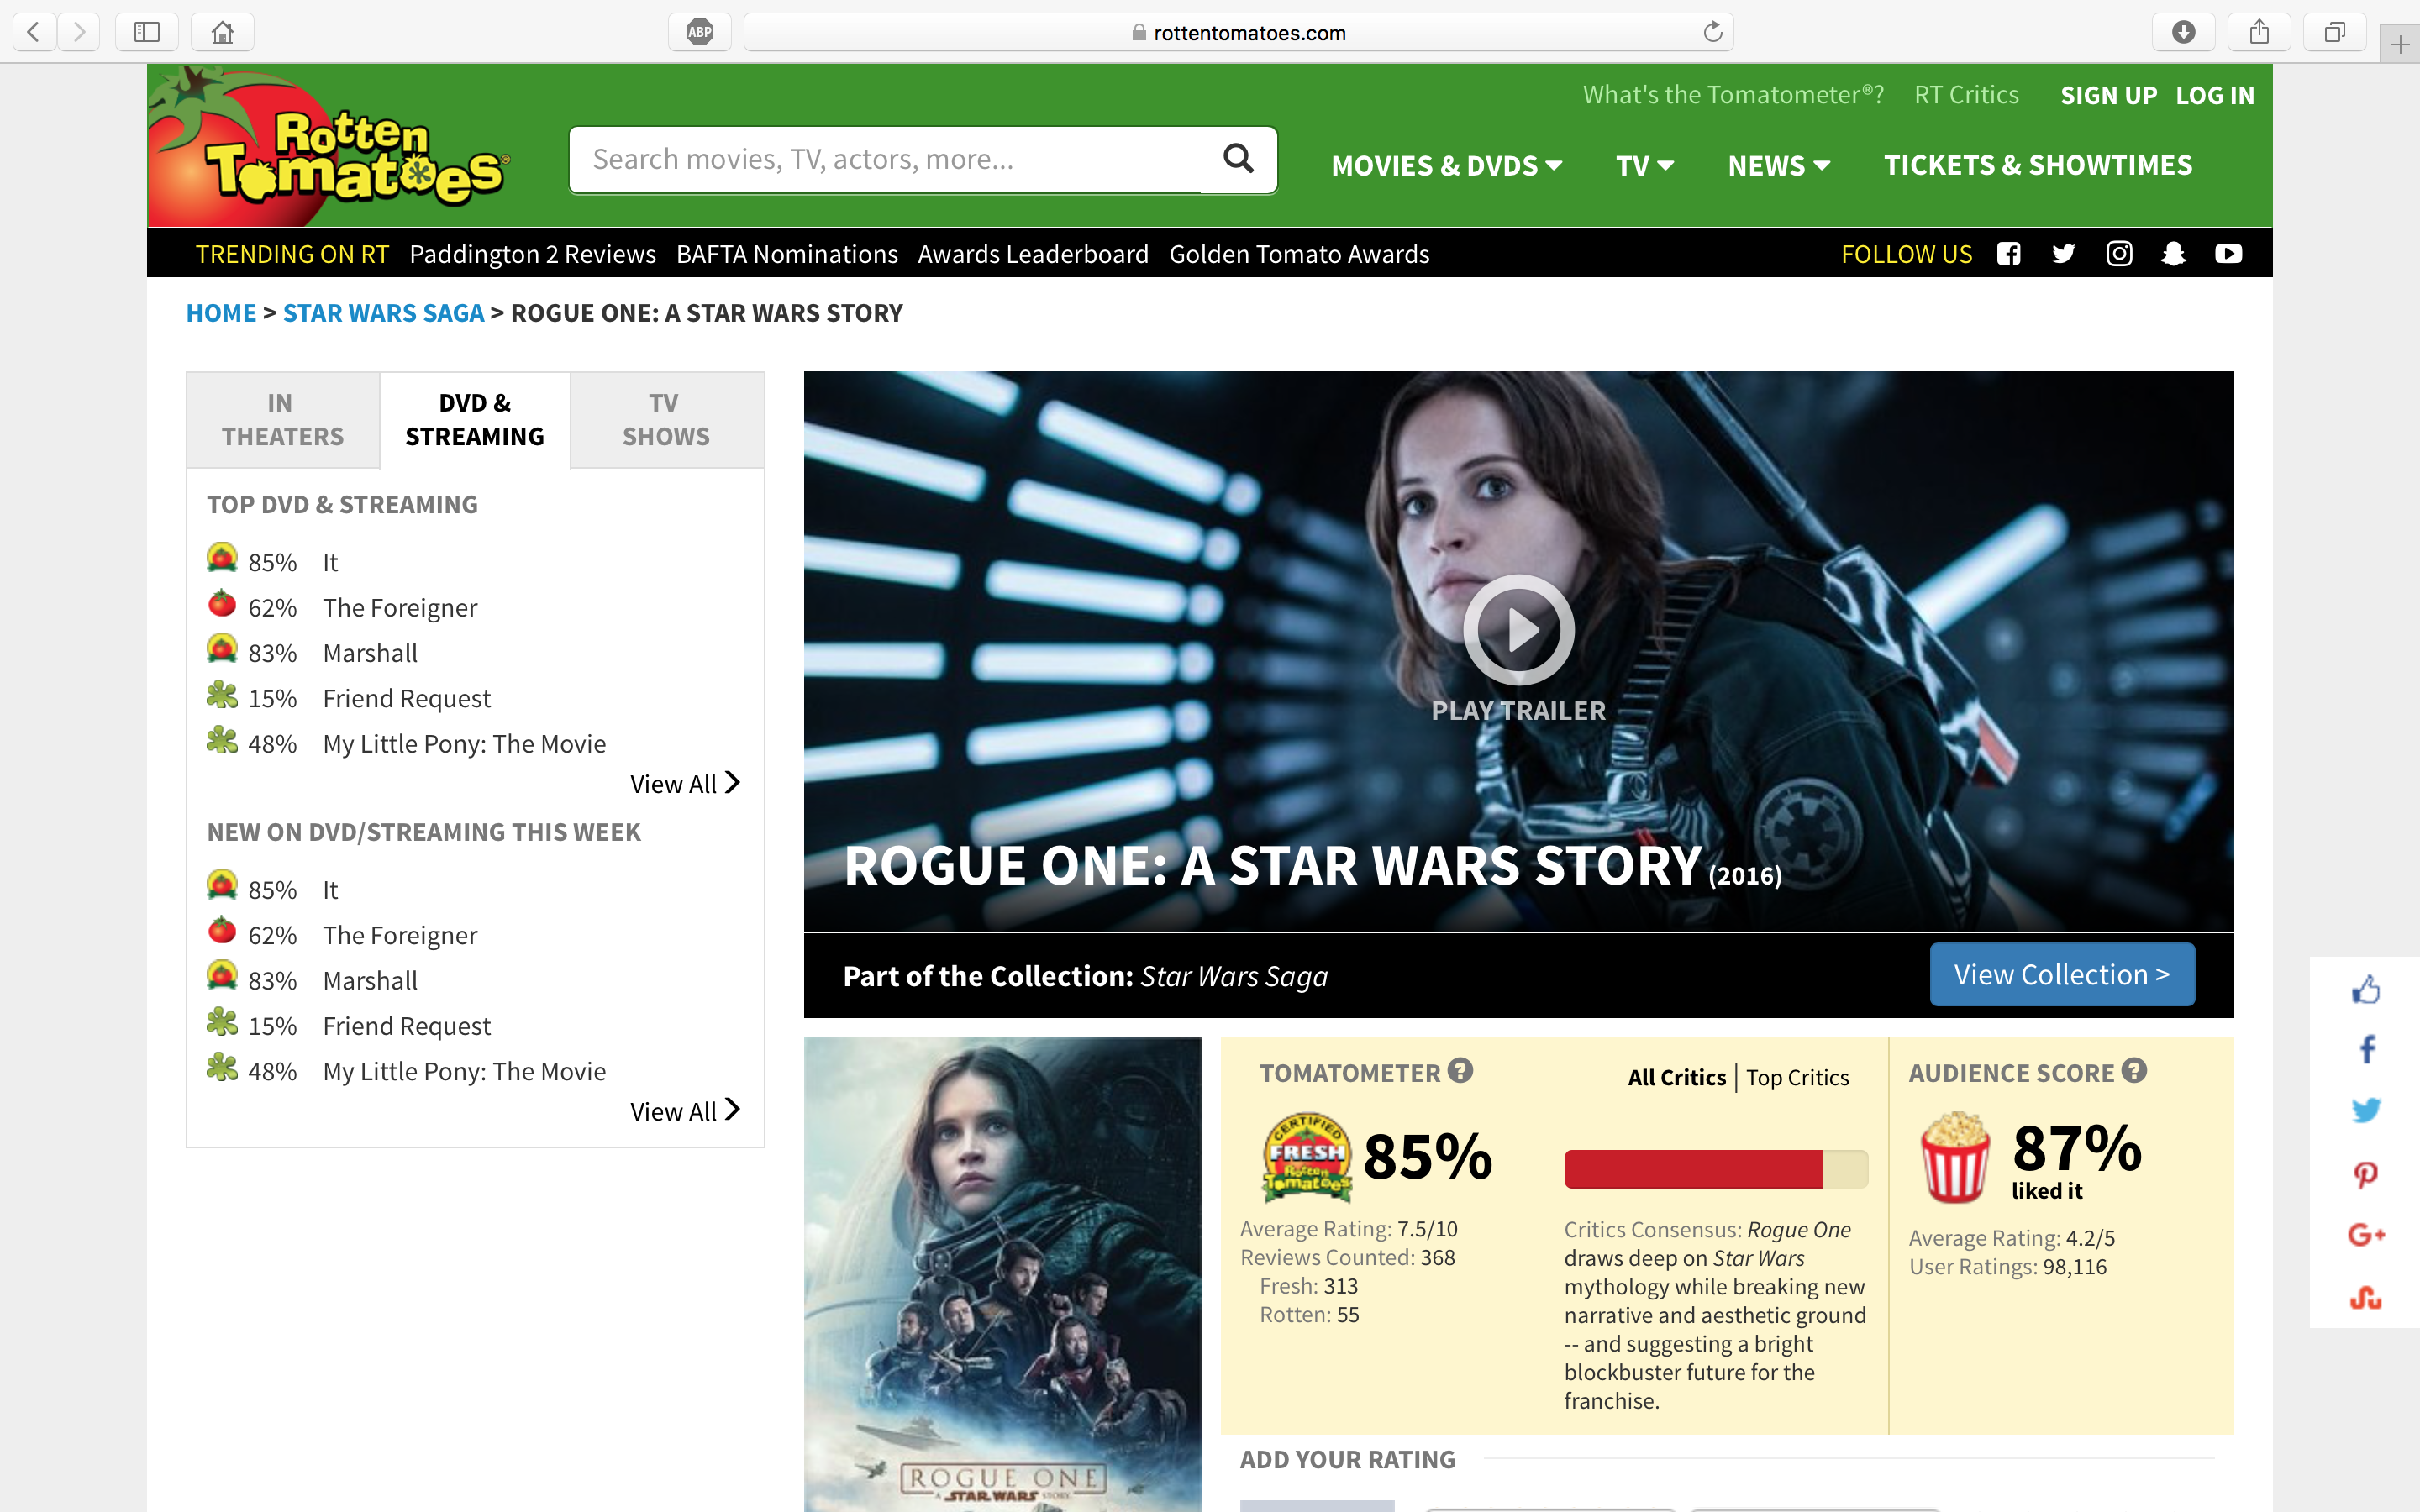
Rogue One: A Star Wars Story (2016) → 85 – 87 = -2
Episode VIII: The Last Jedi (2017) → 50 – 90 = -40

Some patterns emerge. For example, all three films in the original trilogy received positive reviews from critics and audiences alike; all three are Certified Fresh. A greater percentage of Rotten Tomato users than critics liked A New Hope, The Empire Strikes Back, and Return of the Jedi: Audience Score – Tomatometer rating > 0. The Force Awakens and Rogue One received similar positive reviews, again from critics and audiences alike. However, these recent movies rated a little lower among audiences than among critics: Audience Score – Tomatometer rating < 0.

We can use absolute value to measure agreement between the two groups. For A New Hope, The Empire Strikes Back, The Phantom Menace, The Force Awakens, and Rogue One, |Audience Score − Tomatometer rating| ≤ 5. Rotten or fresh, there’s consensus. For The Return of the Jedi and Revenge of the Sith, |Audience Score − Tomatometer rating| = 14. Still, a relatively small difference of opinions.

The Last Jedi breaks this trend. Professional critics place it alongside fellow Disney films The Force Awakens and Rogue One. RT users score it lower than the prequels. Below Binks!

Movies may be more engaging than the usual contexts for integers — a diversion from temperatures and bank balances. Thinking about this data graphically may have more potential.

https://www.desmos.com/calculator/zzplnokx7f

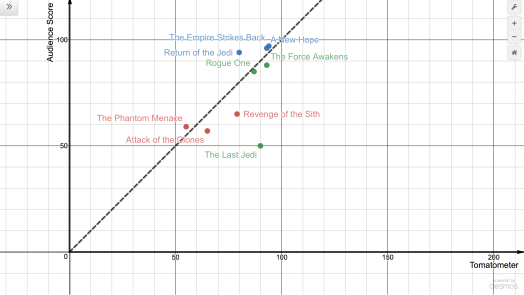
It’s very similar to my take on the food graph, with movie critics in place of nutritionists in the role of expert. Gwyneth played along as I asked “What’s going on in this graph?”. We predicted where some of our favourite movies would land. We explained our reasoning. We compared our predictions with Rotten Tomato data. And then we shut down the laptop and rewatched The Empire Strikes Back.

The data for eight of these nine movies hasn’t changed much in two years. The outlier? Yep, The Last Jedi. The difference is now up to — or down to? — negative forty-eight (Audience Score: 43; Tomatometer rating: 91).

Howard Stern Loves to Show How He Does the Math

My Next Guest Howard Stern

About six and a half minutes into the latest episode of My Next Guest Needs No Introduction, host David Letterman asks guest Howard Stern how long they’ve known one another. Viewers are treated to a number talk. The transcript:

David: You know how long you and I have known one another?

Howard: How long?

David: Well, it’s pretty much to the month since 1984.

Howard: Wow. Now I’m gonna do some quick math and figure out how long that is, if you don’t mind. Now math happens to be… I’m good at it. This is how I do it. This is 2018. Right?

David: It’s 34.

Howard: Oh, you gave it away.

David: It’s 34 years.

Howard: Let me check your math.

David: Yeah.

Howard: The way I get to it is, you say 1984 and I add ten immediately.

David: Yeah.

Howard: That brings us to 1994.

David: That’s right.

Howard: That’s ten.

David: Yeah.

Howard: 1994, then 2004 is 20.

David: Yeah.

Howard: Now here’s tricky ’cause I get confused. 2004 to 2014 is another 10. That’s 30. You’re absolutely right. That’s 34 years. Good for you.

David: Now…

Howard: I love to show how I do the math.

David: Speaking of which, you realize that all of that will be subtracted from the show?

Howard: Wow. But really for you… I guess the premise of this show, although who knows what this show is… you know, I don’t even know what I’m doing here, but I thought the premise was that… you’re choosing six people… and I’m way more fun than Obama already, I’m sure. I mean, this is fun.

David: Really?

Howard: Oh, for God’s sake, yeah.

Lucky for us, Letterman didn’t subtract all of this from the show. Some observations…

Despite David giving away the solution, Howard continues to share his strategy. David is not the ultimate authority; Howard is eager to prove this solution. Howard, at least, is interested in Howard’s reasoning. He’s focused on sense-making, not answer-getting; how?, not what? All of this is typical of a classroom number talk.

Howard uses an adding up (or add instead) strategy for 2018 − 1984. He moves forward from 1984 to reach 2018. The context implies distance–not removal–which lends itself to this strategy. Stern’s jumping by tens gives us an opportunity to discuss efficiency, e.g., one jump of thirty rather than three jumps of ten. For what it’s worth, I used an adding up strategy too. First I added 16 to 1984 to get to 2000 (or six and ten to get to 1990 and 2000), then I added 18 to get to 2018.

David, of course, does not record Howard’s thinking. I might use this video clip to have teachers anticipate possible strategies for 2018 − 1984 and consider how they would record them. I chose an open number line to model Howard’s adding up strategy:

.pdf

Howard is confident: “Now math happens to be… I’m good at it.” He is enthusiastic: “I love to show how I do the math.” He is joyful: “I mean, this is fun.” Over the last two years, it has been my privilege to work alongside Surrey teachers Alex Sabell and Jonathan Vervaet (and others) as they’ve incorporated number talks in their classrooms. These same positive attitudes towards mathematics come through in their students’ interviews (see Alex & Jonathan).

What did you notice in this clip? What did I miss?

Alike & Different: Which One Doesn’t Belong? & More

I have no idea what I was going for here:

WODB? Cuisenaire Rods

At that time, I was creating Which One Doesn’t Belong? sets. Cuisenaire rods didn’t make the cut. Nor did hundreds/hundredths grids:

WODB? Hundreds Grids

I probably painted myself into a corner. Adding a fourth shape/graph/number/etc. to a set often knocks down the reason why one of the other three doesn’t belong. Not all two-by-two arrays make good WODB? sets (i.e., a mathematical property that sets each element apart).

Still, there are similarities and differences among the four numbers above that are worth talking about. For example, the top right and bottom right are close to 100 (or 1); the top left and bottom right are greater than 100 (or 1); top left and top right have seven parts, or rods, of tens (or tenths); all involve seven parts in some way. There is an assumed answer to the question, “Which one is 1?,” in these noticings — a flat is 100 if we’re talking whole numbers and 1 if we’re talking decimals. But what if 1 is a flat in the top left and a rod in the bottom left? Now both represent 1.7. (This flexibility was front and centre in my mind when I created this set. The ten-frame sets, too.)

Last spring, Marc and I offered a series of workshops on instructional routines. “Alike and Different: Which One Doesn’t Belong? and More” was one of them. WODB? was a big part of this but the bigger theme was same and different (and justifying, communicating, arguing, etc.).

So rather than scrap the hundreds/hundredths grids, I can simplify them:

Alike&Different.006

Another that elicits equivalent fractions and place value:

Alike&Different.007

For more, see Brian Bushart’s Same or Different?, another single-serving #MTBoS (“Math-Twitter-Blog-o-Sphere”) site.

Another question that I like — from Marian Small — is “Which two __________ are most alike?” I like it because the focus is on sameness and, like WODB?, students must make and defend a decision. Also, this “solves” my painted-into-a-corner problem; there are three, not six, relationships between elements to consider.

Alike&Different.009

The numbers in the left and right images are less than 100 (if a dot is 1); the numbers in the centre and right can be expressed with 3 in the tens place; the left and centre image can both represent 43, depending on how we define 1.

At the 2017 Northwest Mathematics Conference in Portland, my session was on operations across the grades. The big idea that ran through the workshop:

“The operations of addition, subtraction, multiplication, and division hold the same fundamental meanings no matter the domain in which they are applied.”
– Marian Small

That big idea underlies the following slide:

Alike&Different.013

At first glance, the second and third are most alike: because decimals. But the quotient in both the first and second is 20; in fact, if we multiply both 6 and 0.3 by 10 in the second, we get the first. The first and third involve a partitive (or sharing) interpretation of division: 3 groups, not groups of 3. (Likely. Context can determine meaning. My claim here is that for each of these two purposefully crafted combinations of naked numbers, division as sharing is the more intuitive meaning.)

Similar connections can be made here:

Alike&Different.015

This time, the first and second involve a quotative (or measurement) interpretation of division: groups of (−3) or 3x, not (−3) or 3x groups. (What’s the reason for the second and third? Maybe this isn’t a good “Which two are most alike?”?)

I created a few more of these in the style of Brian’s Same or Different?, including several variations on 5 − 2.

Alike&Different.017
Alike&Different.023

Note: this doesn’t work in classrooms where the focus is on “just invert and multiply” (or butterflies or “keep-change-change” or…).

And I still have no idea what I was going for with the Cuisenaire rods.

The slides:

Updates:

An edited version of this post appeared in Vector.

“They’ll Need It for High School” (Part 3)

I’m picking “TNIFHS” back up. At the end of Part 1, I promised Part 2 would answer “What are the big ideas in elementary school mathematics that students will need for high school?” Instead, I talked times tables.

In this third half, I’ll refocus on these big ideas. Or one of them — one that came up in that initial “they’ll need long division for high school” conversation.

More than the standard algorithm, what students will need is an understanding of division as sharing (finding the number in each group) and measuring (finding the number of groups). More generally, what students will need is an understanding of the fundamental meanings of all four operations.

Here’s part of a task I presented to my secondary math colleagues:

Evaluate, or simplify, each set of expressions. Make as many connections as you can conceptually & procedurally, pictorially & symbolically.

fundamental meanings of all four operations

Sticking with division, in this task (−6) ÷ (+3) was chosen to bring to mind sharing (3 groups, −2 in each group) whereas 6/5 ÷ 3/5 was chosen to evoke measuring (3/5 in each group, 2 groups). (This often leads teachers themselves to revisit 6 ÷ 3.)

division
(−6) ÷ (+3) as sharing (top) and 6/5 ÷ 3/5 as measuring (bottom)

Flexibility is key. Consider (−6) ÷ (−3), 6/5 ÷ 3, 6 ÷ 0.3, 0.6 ÷ 3, 6x ÷ 3, 6x ÷ 3x, etc. (Note: division of fractions & integers are high school topics in Western Canada.)

(I’m not saying that dividing by a fraction — or decimal fraction — always means measuring. You can think sharing, which can be challenging. Andrew Stadel’s estimation jams are my favourite examples of this. How long is “All Along the Watchtower”?

4082414_orig

Did you see 2/3 in the picture? Did you divide by two, then multiply by three? In other words, did you invert and multiply? What’s the meaning of 2:40 ÷ 2/3 in this context?)

The subtraction set above is interesting. Teachers pick up that the expressions are variations on a theme: five “take away” two. Their pictorial representations tend to show subtraction as removal: “if you have five apples/quarters/x‘s/square root of two’s and I take away two…”

282px-Subtraction01.svg

Pictorial representations that show subtraction as comparison (the “difference”!) are less frequent, but maybe more helpful.

subtraction
5/4 − 2/4 as removal (top number line) and comparison (bottom number line)

Consider (+5) − (−2). To “take away” negative two from positive five means introducing zero pairs whereas the “difference” between positive five and negative two means understanding that positive five is seven greater than negative two.

This second meaning is probably more meaningful in high school. For example, subtraction as removal reduces (1.89t + 15) − (1.49t + 12) to an exercise in collecting like terms whereas subtraction as comparison has students contrasting rates of change (e.g., cost per additional pizza topping) and initial amounts (e.g., the price of a plain cheese pizza). Similarly, if F_1(C) = 9/5C + 32 and F_2(C) = 2C + 30, then (F_2 − F_1)(C) compares conversions given by an estimate and the formula. When solving |x − 5| = 2, it’s more helpful to ask “What numbers differ from five by two?” than think missing minuends in take away problems.

Addition and multiplication — as well as other big ideas needed for high school such as proportional reasoning (or “multiplicative thinking”?) — will be addressed in future posts.

More often than not, more is less

In the summer, Costco peddles a buttload of educational workbooks. You know the ones: collections of every worksheet necessary for your child to complete <insert grade here> Math. Can’t find them? Look over by the Christmas trees.

I picked up the Grade 3 book. Just browsing. Killing time. I opened to this page:

add:subtract words

I’m not a big fan of this approach. Forget about comprehension, just scan for the add or subtract words. See more, think add. But it’s not that easy. More shows up in five of the practice exercises. Try them.

  • In the picture, how many more 4-legged animals are there than 2-legged ones?
  • Peter has 39 goats.  He wants to have 64 goats.  How many more goats should he buy?
  • Peter has 68 animals on his farm.  He buys 23 more.  How many animals does he have now?
  • 413 gulls are joined by 311 more.  Then 136 more gulls come.  How many gulls are there altogether?
  • There are 576 gulls, but 153 fly away.  Then 283 more leave.  How many gulls remain?

A mountie (really?!) tells kids (Canadian, no doot) to decide on the operation.

mountie

From the answer key:

  • In the picture, how many more 4-legged animals are there than 2-legged ones? 15 − 12 = 3
  • Peter has 39 goats.  He wants to have 64 goats.  How many more goats should he buy? 64 − 39 = 25
  • Peter has 68 animals on his farm.  He buys 23 more.  How many animals does he have now? 68 + 23 = 91
  • 413 gulls are joined by 311 more.  Then 136 more gulls come.  How many gulls are there altogether? 413 + 311 + 136 = 860
  • There are 576 gulls, but 153 fly away.  Then 283 more leave.  How many gulls remain? 576 − 153 − 283 = 140

Subtraction is used to answer three of five questions with this ‘add’ word. Actually, kids will think addition for the first two questions (12 + 3 = 15 and 39 + 25 = 64) but that’s another post.