Principles of Math Videos

This summer, Marc and I made several videos designed to help parents understand what mathematics their children are learning. As well, we wanted to give parents a feel for how their children are learning in their math classes. We added Mathematics 6 & 7 videos to the previous summer’s 8 & 9 collection. The work of producing videos for Foundations of Mathematics and Pre-calculus 10 is well underway; I expect to add two more videos–Solving Systems of Linear Equations Graphically & Algebraically–this week. Although intended for parents, we believe that this series could be a helpful resource for teachers, especially those having to teach in an online or blended environment due to COVID-19.

In this post, I’ll share some of the principles that guided us when creating the videos. This’ll be a peek behind the curtain of interest more to educators than to parents.

Make it visual.

Math is visual. Videos are visual. So math videos should be visual. It is disappointing how often makers of digital content fail to take full advantage of visual aspects available to them. The animation of symbolic representations–line-by-line equation solving or drawing little arrows to show the distributive property–should not be the extent to which content is presented visually. It’s ballsy to sell this to educators as visual if that’s all you’ve got. By “make it visual,” I mean include images and animations that help viewers make sense of the mathematics at hand or the context in which the mathematics is situated. For example, we show that 2:3 is equivalent to 8:12 by repeatedly extending a black-red-red-red-black pattern of beads; we don’t describe two candles with different heights and different rates at which they burn, we show it–so long as we can figure out how to do it in Keynote.

Mathematics 6: Ratios & Percents (1/2)
Foundations of Mathematics & Pre-calculus 10: Systems of Linear Equations (1/2)

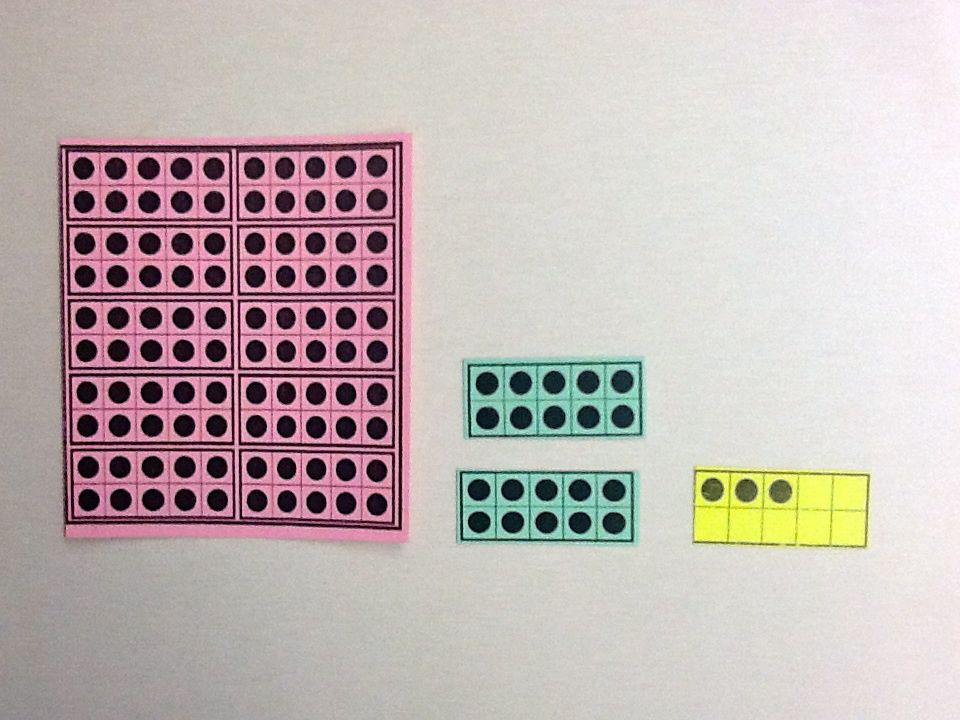
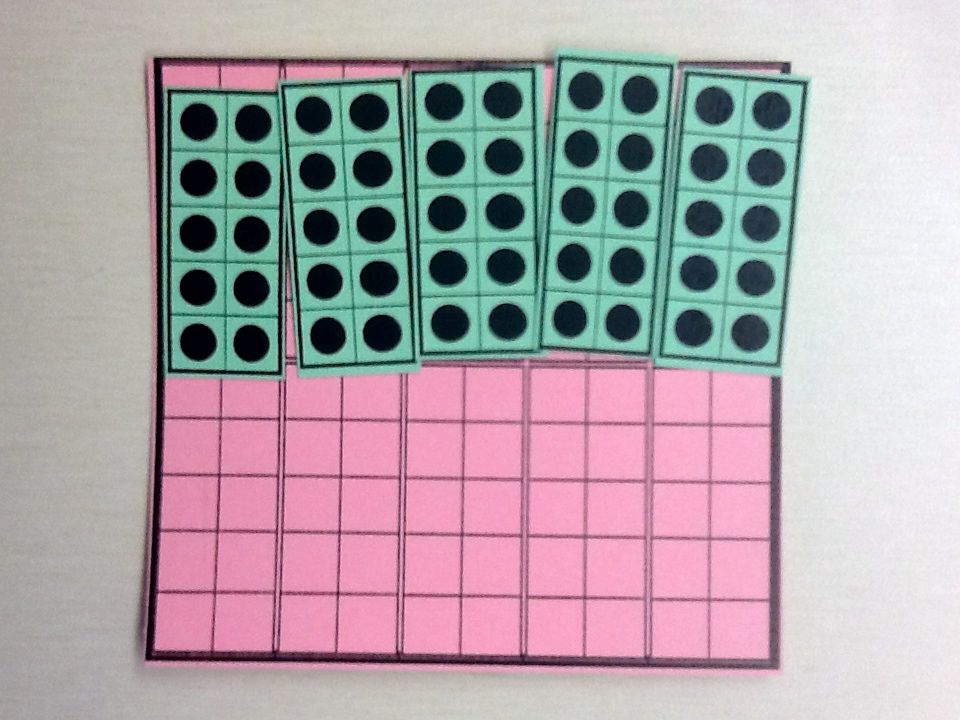
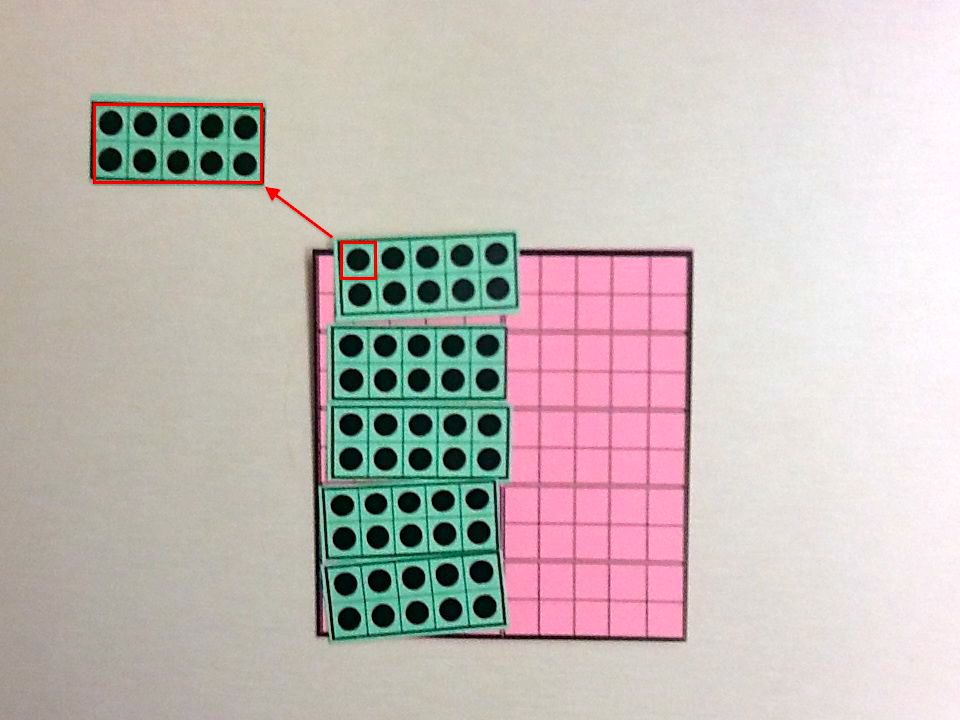
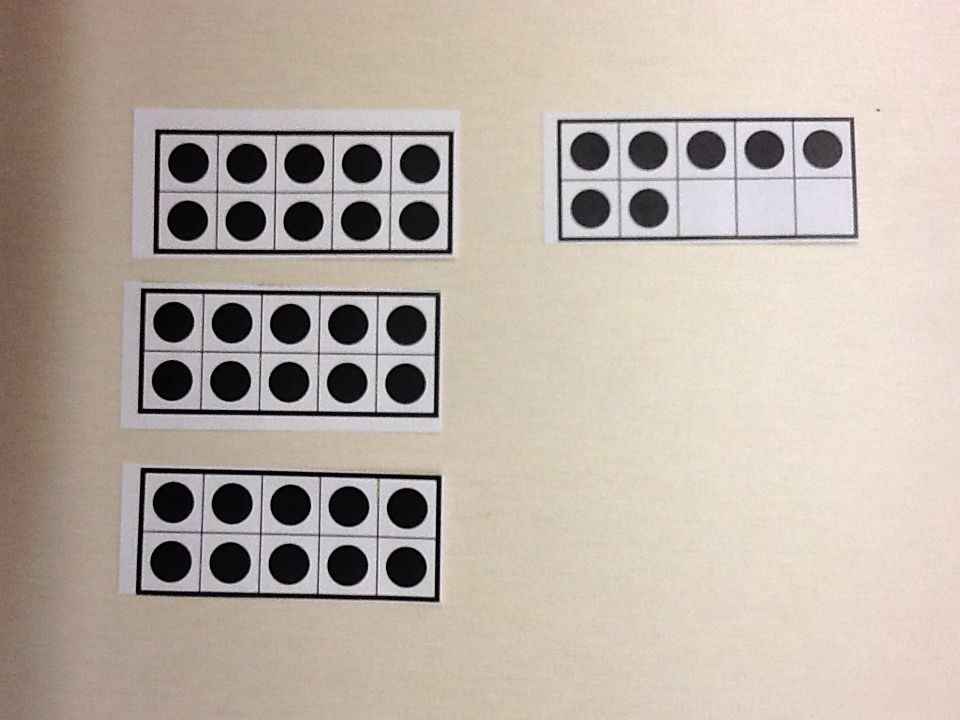
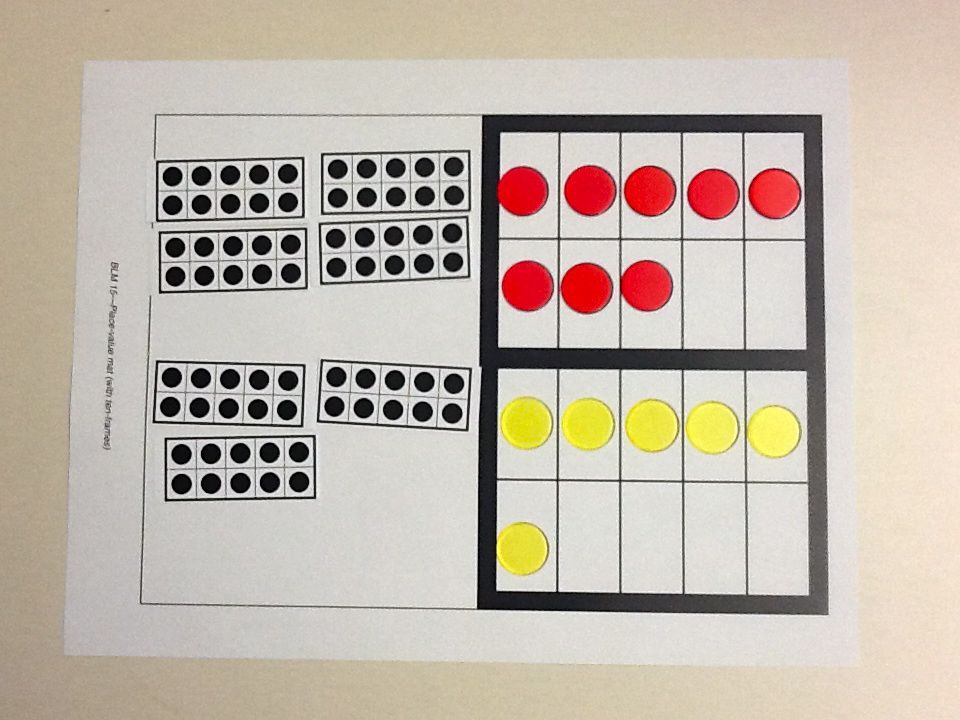
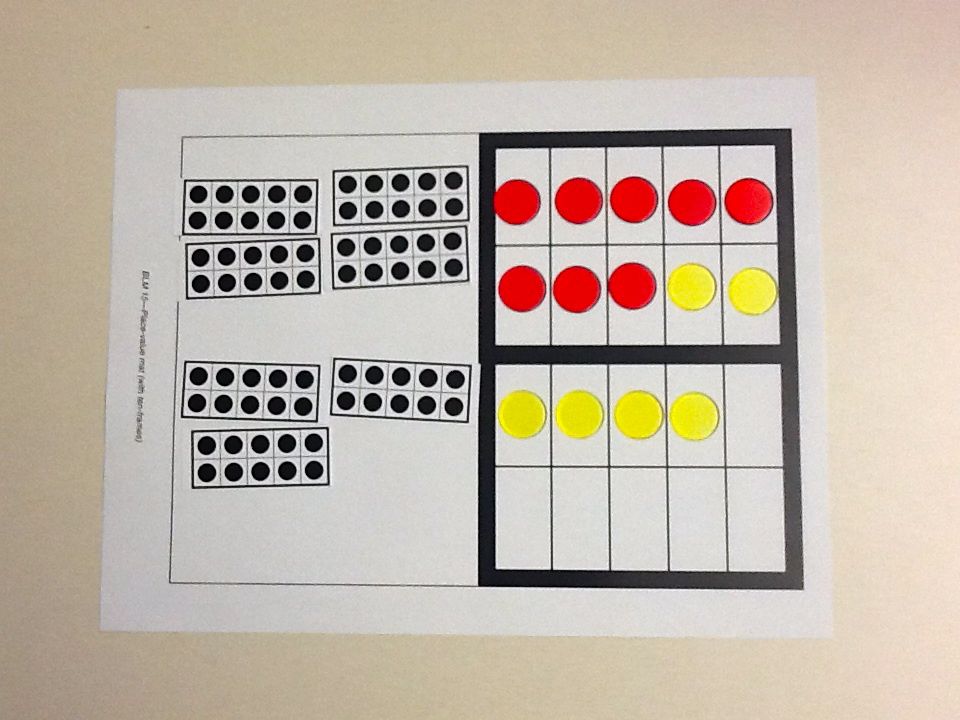
In our videos, we make use of virtual manipulatives–or virtual virtual manipulatives?–like pattern blocks, colour tiles, counters, multi-link cubes, base ten blocks, algebra tiles, tangram-like puzzles, Solo cups and paper clips, etc. We employ other pictorial representations such as hundred charts, decimal/percent grids, number lines, double number lines, factor trees, factor rainbows, tables of equivalent ratios, graphs, etc.

Make it conceptual.

I once watched a short video to fix an issue with my dishwasher. I carefully followed the directions, pausing the video at each step along the way. But no one is ever going to mistake me for a handyman! I don’t really understand how dishwashers work. I couldn’t connect the problem to any knowledge of the machine’s mechanical or electrical systems. If the solution shared online didn’t work, I was hooped. And even though I was successful, my procedure for fixing my dishwasher was useless for fixing my washing machine, let alone a different make and model of dishwasher. This skill–long-forgotten, by the way–didn’t transfer from one household appliance to another.

But it didn’t matter. I set out that morning to make one small repair, not become an appliance repair technician. Mathematics is different. The emphasis in math class must be on sense-making, not answer-getting. The same should be true of math videos. In our videos, we attempt to always address the why.

For example, we answer “Why is a negative divided by a negative a positive?” by revisiting what it means to divide whole numbers and then applying these two fundamental meanings to dividing integers. Later, a thermometer example reinforces dividing as measuring.

Conceptual understanding means seeing mathematics as a coherent whole rather than isolated procedures. Digital content can support students in developing conceptual understanding by creating opportunities for them to connect models and representations. For example, we ask learners to connect multiplying binomials to what they already know about multiplying two-digit numbers (i.e., an area model, partial products, the distributive property).

Of course, procedural fluency is important. Effective mathematics teaching focuses on the development of both conceptual understanding and procedural fluency. However, procedural fluency depends and builds on a foundation of conceptual understanding.

For example, percents are presented as fanatical comparisons to 100. No part-whole-percent triangles or is-over-of-equals-percent-over-100 cross-products here. Relating percents to decimals does not appear until grade 7. So, in our Mathematics 6 video, the emphasis is on equivalency and benchmark percents (i.e., 50%, 25%, 75%; 10%, 20%, … , 90%).

Procedural fluency includes the ability to apply procedures flexibly. Throughout each video, multiple strategies are discussed. For example, see the strategies–and representations–used in this proportional pizza problem.

To bridge conceptual understanding and procedural fluency, we try to build on learners’ own mathematical ideas. For example, before the elimination method for solving systems of linear equations is introduced, viewers are first encouraged to solve a puzzle using their intuition. Then, they are presented with a pictorial representation of a solution to a problem. It’s at this time that algebraic symbols and notation appear:

(Note: Each row and column is a sum. None of that fries times Coke nonsense!)
Foundations of Mathematics & Pre-calculus 10: Systems of Linear Equations (2/2)

This process plays out when solving equations in one variable (boxes of doughnuts; algebra tiles) in Math 7 and when solving systems using substitution (scale puzzle; two types of tickets problem) in Math 10.

Of course, we can build on viewers’ own ideas only to the extent to which they engage with and participate in the learning experiences that we design. This segues into our last principle…

Make it inviting.

I think that this is the right adjective. To me, inviting goes beyond accessible.

One way in which we make an effort to invite parents to “do the math” is to use open questions. Sometimes, this means open-ended. For example, Show me one-quarter in as many ways as you can, What could the numbers be? and What comparisons can you make? (and later What is being compared in the ratio 1:2?) are open-ended; they allow for many correct answers and signal that a range of responses are valued.

Other times, we used open middle problems. An open middle problem may have one correct answer but multiple ways of getting it. For example, there is an arrangement–or two–of number tiles that maximizes the expression below. The animated placement of the number tiles is meant to model one strategy and includes me making missteps and backtracking as I went along.

(Here’s a number tile factoring task from Math 10 that has both an open end and an open middle.)

In addition to openness, we try to hold off on introducing formal symbols and notation early. For example, Two numbers add to 12. What could they be? comes before Solve the system x + y = 12 & y = 2x. (See also Burgers, Fries, and Cokes and Tees and Hoodies above.)

Sometimes, when a task is not a soft place to start, we may still present it up front and then return to it later, after we’ve built up some knowledge. In this way, we hope to “make it inviting” by piquing the curiosity of viewers. For example, asking parents to pick two numbers that differ by two and multiply them is accessible whereas asking them to explain why this product is one less than the square of the number between them is not. A similar approach was taken with a gas vs. electric vehicle application of linear systems; it serves as a hook in the video’s introduction.

* * ** *** ***** ********

We believe that learners of mathematics should be active participants rather than passive spectators. There’s a tension between this belief and video. In our videos, we put a lot of trust in parents pressing pause when prompted. It’s in these moments that they “do” math, that they play, notice and wonder, solve problems, visualize, look for patterns, make conjectures, generalize, reason, explain, connect ideas, take risks, etc. We were limited by the medium–or our tech skills within this medium.

In a mathematics classroom–be it face-to-face or remote–this tension can be resolved. And this is one reason why we’re just as, if not more, excited about teachers using these videos. At the moments when we ask viewers to pause, students could be placed in visibly random groups or breakout rooms. Teachers are not limited by our prompts–or these moments. They can observe and adapt to what’s happening with their learners in the moment and ask How else might you have solved the problem/represented your thinking? What does this remind you of? How are these the same? How are they different? What would happen if… ? etc. There’s no need to “fake it” coming out of a pause as we had to do (e.g., “You might have noticed that…”).

These videos were intended to capture the big ideas or enduring understandings or key concepts of a topic–a whole chapter or unit. Although each clocks in at about twenty minutes, it would be inappropriate to have students experience an entire video in one sitting. Instead, a task or two clipped from a downloaded video could make up one day’s learning experience.

If you find this video series helpful, we’d love to hear from you. Drop a comment, question, or complaint in the comments.

Halving & Doubling: Very Fun to Play With

On last week’s Last Week Tonight with John Oliver, John Oliver used the mental math/computation strategy of halving and doubling as a punchline to a news story on nuclear waste.

The graphics nicely–and quickly!–illustrate why this strategy works. Starting with 1 × 20 (one football field twenty feet tall), if we double the first factor (area in football fields) and halve the second factor (height in feet), the product (volume in piles of nuclear waste), expressed as 2 × 10, remains the same. Similarly, we can halve and double to visualize that 1 × 20 is equivalent to ½ × 40. (Oliver also throws in the commutative property at the end–twenty football fields one foot tall.)

This reminded me of a video clip from Sherry Parrish’s Number Talks. In it, the teacher poses the problem 16 × 35. The fifth graders share several strategies: partial products (10 × 30 + 10 × 5 + 6 × 30 + 6 × 5); making friendly numbers (20 × 35 − 4 × 35); halving and doubling (8 × 70); and prime factors (ultimately unhelpful here).

I’ve probably shared this video in about a dozen workshops. There are some predictable responses from attendees. Often “not my kids” is the first reaction. I remind teachers that the teacher in this video has implemented this routine three to five times a week in her classroom. This isn’t her kids’ first number talk. Pose 16 × 35 in your fifth–or ninth!–grade classroom tomorrow and, yeah, the conversation will probably fall flat. Also, this teacher is part of a schoolwide effort (seen in other videos shared at these workshops).

Teachers are always amazed by Molly’s halving and doubling strategy. Every. Single. Time. I ask attendees to anticipate strategies but they don’t see this one coming. I note that doubling and halving wasn’t introduced through 16 × 35. I would introduce this through a string of computation problems (e.g., 1 × 12,  2 × 6, 4 × 3). “What do you notice? What patterns do you see? Does it always work? Why?” We can answer this by calling on the associative property: 16 × 35 = (8 × 2) × 35 = 8 × (2 × 35) = 8 × 70 above. Better yet, having students play with cutting and rearranging arrays provides another (connected) explanation.

Rather than playing with virtual piles of nuclear waste, I had fun with arrays of candy buttons:

Number Talks (pdf)

Update

(I added the math expressions beginning at 0:47.)

He did it again! Factoring as a punchline to a story on SLAPPs. “Math. Is. Fun!”

How many do you see? How do you see them?

This summer, as Gwyneth and I were packing up Othello, I started playing with different arrangements of discs – mostly arrays – and asked her “How many?” I remembered the following arrangement, taken from AIMS’ Cookie Combos activity.

3^2+4*4
3^2 + 4 * 4

“Sixteen plus nine, so nineteen plus six… twenty, twenty-five,” she said. (I don’t think that she actually said “twenty” aloud. That came after my clarifying question: “Wait. Huh?”)

There’s a lot happening in Gwyneth’s bridging through twenty strategy – partitioning of quantities, place value, commutative property, breaking apart to make (a multiple of) ten. All within a three count, standard algorithm be damned.

This invented strategy discussion was a happy accident. The goal of this problem when we pose it to teachers is to see different ways to visualize the group and represent these using expressions. It’s about valuing different methods; the solution – counting 25 cookies – is easy enough.

How many do you see? How do you see them? How many different ways can you find?

25

Some popular solutions:

7+2*5+2*3+2
7 + 2 * 5 + 2 * 3 + 2 * 1

3*5+2*4+2
3 * 5 + 2 * 4 + 2

4*5+5
4 * 5 + 5

If you look just right, you can see two arrays:

4*4+3*3
4 * 4 + 3 * 3

A creative solution that involves counting what’s not there:

7^2-4*6
7^2 – 4 * 6

And moving what is:

output_rf0ouE
5^2

If you plan on using these images with your students, I recommend displaying the photo with just white discs. This leaves the problem open. Two colours were used above to illustrate various visualizations. This can steer student thinking. (See how the use of colour is intended to be helpful here.) If students miss one of the visualizations above, display that photo and ask for the expression (or vice versa).

More Decimals and Ten-Frames

What number is this?

123

123? 12.3? 1.23? One has to ask oneself one question: Which one is one?

Earlier this year, I was invited into a classroom to introduce decimals. We had been representing and describing tenths concretely, pictorially, and symbolically. We finished five minutes short, so I gave the students a blank hundred-frame and asked them to show me one half and express this in as many ways as they could.

blank 100

5 tenths 50 hundredths

As expected, some expressed this as 5/10 and 0.5. They used five of the ten full ten-frames it takes to cover an entire hundred-frame. Others expressed this as 50/100 and 0.50. They covered the blank hundred-frame with fifty dots. I was listening for these answers.

One student expressed this as 2/4. I assumed he just multiplied both the numerator and denominator of 1/2 by 2. And then he showed me this:

two quarters

One student expressed this as 500/1000 and 0.500. I assumed he was just extending the pattern(s). “Yeahbut where do you see the 500 and 1000?” I asked challenged. “I imagine that inside every one of these *points to a dot* there is one of these *holds up a full ten-frame*,” he explained. As his teacher and I listened to his ideas, our jaws hit the floor.

annotated 500 thousandths

In my previous post, I discussed fractions, decimals, place value, and language. To come full circle, what if we took a closer look at 0.5, 0.50, and 0.500? These are equivalent decimals. That is, they represent equivalent fractions: “five tenths,” “fifty hundreds,” “five hundred thousandths,” respectively. From a place-value-on-the-left-of-the-decimal-point point of view, 0.5 is five tenths; 0.50 is five tenths and zero hundredths; 0.500 is five tenths, zero hundredths, zero thousandths. Equal, right?

Hat Tip: Max Ray‘s inductive proof of Why 2 > 4

Teaching Improper Decimals Using Ten-Frames

Professor Triangleman posed an interesting question a few weeks back:

If 15/10 is an improper fraction, then shouldn’t 1.5 be an improper decimal? Or is 1.5 a mixed decimal, having more in common with the mixed fraction 1 5/10? Both? Neither?

One definition of decimal:

A fraction whose denominator is a power of ten and whose numerator is expressed by figures placed to the right of a decimal point.

Thus, in 1.5, the implied denominator is 10 and the implied numerator is 5, the figure to the right of the decimal point. We read 1.5 as “one and five tenths,” a mixed decimal. The whole number part is treated separately, making an improper decimal an impossibility.

But what if we didn’t just look at the figures to the right? Nested tenths don’t stop/start at the decimal point. What if we looked at all the figures? We’d read 1.5 as “fifteen tenths,” an improper decimal.

Maybe the improper vs. mixed comparison is throwing me off track. Fractions can be classified as either proper or improper. Why not decimals? Decimals less than one, such as 0.5, would be proper; decimals greater than or equal to one, such as 1.5, would be improper (or, in Britain, top-heavy).

Christopher Danielson wasn’t trying to introduce new vocabulary to the world of math(s). Probably. Rather, he was making a point about place-value.

When we teach decimals using ten-frames we do.

If the whole is one full ten-frame, students may build 3.7 like this:

37

Students will describe 3.7 as “3 ones and 7 tenths,” “37 tenths,” or even “2 wholes and 17 tenths.” This mirrors what students know about place value and whole numbers: 37 can be described as “3 tens and 7 ones,” “37 ones,” or even “2 tens and 17 ones.”

Just like with whole numbers, thinking about place value makes calculations with decimals easier. For example, consider 4.8 + 3.6:

48 plus 3650 plus 34

  • 4 and 3 make 7
  • 0.8 (“8 tenths”) and 0.6 (“6 tenths”) make 1.4 (“14 tenths”)
  • 7 and 1.4 (“1 and 4 tenths”) make 8.4 (“8 and 4 tenths”)

Note the shift in thinking, not notation, from 1.4 as “14 tenths” to 1.4 as “1 and 4 tenths.” With fractions, it’s a shift in thinking and notation. Probably why we know about improper fractions but not improper decimals.

Blackline Masters:

Ten-Frames – Full
Ten-Frames – Less-Than-Ten
Ten-Frames – Place Value Mat

Quadratic Patterns

Having students write an equation that describes a pattern involving toothpicks, pattern blocks, or colour tiles is nothing new. However, students (teachers?) often focus on patterns in the table of values rather than properties of the pattern itself. Visualizing the pattern can help students write the equation. For some, this approach may be new.

For example, consider the following pattern:

In each figure, students may see a rectangle with two squares attached, one above and one below. That rectangle has a width of n and a length of n + 2. The expression is n(n + 2) + 2.

Some students may see the pattern in a different way. But what about the students who don’t see anything? For them, some scaffolding is necessary. Note the scaffolding in the pattern below.

Students may see one red square, two green rectangles, and two blue tiles in each figure. That is, they see n^2 + 2n + 2. The use of colour is intended to be helpful. Of course, some students may ignore this hint. I’m cool with that. They may see a large square with one tile attached, or (n + 1)^2 + 1.

Again, look for the scaffolding in the pattern below.

Students may see a rectangle with a number of tiles being removed, as suggested by the dotted lines. That rectangle has a width of n + 1 and a length of n + 2. The number of tiles being removed is equal to the figure number. Alternatively, students may visualize  2(n + 1) + n^2.

Did you notice that each of the expressions above are equivalent? They must be. Each of the three patterns begin with 5, 10, and 17 tiles. Each pattern/expression tells the same story, but in a different way.

My goal was to design three parallel tasks. Have students choose one of the three representations… just don’t tell them they’re the same.

My three-part lesson plan:

Marc and I created two more sets of patterns. All three:

For more, please see Fawn Nguyen’s Pattern Posters.

A Visual Approach to Simplifying Radicals (A Get Out of Jail Free Card)

The radical sign is like a prison. Twelve can be expressed as a product of prime factors so √12 = √(2×2×3). The 2’s pair up and try to break out. Sadly, only one of them survives the escape. √12 becomes 2√3.

That’s how I was taught to simplify radicals. No joke.

I imagined the numbers yelling “All in the name of liberty! Got to be free! JAlLBREAK!” as they scaled the prison walls. To this day, I can’t get this song out of my head when I teach this topic.

Many students are shown this method, albeit without the prison imagery. Write the prime factorization of the number. Circle the pairs. Write/multiply circled numbers outside the radical sign. There is real math behind this procedure. By definition, √2 × √2 = 2. However, I found that students who were taught this method couldn’t tell me why √(2×2×3) = 2√3. Where did the other 2 go?

Instead, I asked students to evaluate √12, then 2√3, using their calculators. Why are they equivalent? Students factored √12 as √4 × √3 (with some scaffolding for some). They understood where the 2 came from. Some began by factoring √12 as √6 × √2. Correct, but not helpful. The importance of finding factors that are perfect squares was discussed.

Marc Garneau shared with me his visual approach to simplifying radicals.

Consider a square with an area of 24. The side has length √24.

This square can be divided into 4 smaller squares, each with an area of 6. The sides of these smaller squares have length √6. Two of these lengths make up the side length of the large square, so √24 = 2√6.

24 can also be divided into 3 rectangles, each with an area of 8. Again, correct, but not helpful. How to simplify √45 as 3√5 and √72 as 6√2 are also shown above. Again, factors that are perfect squares are key.

I think it would be interesting to try this out. Some students may prefer this method, but most students will likely move towards simplifying radicals without drawing pictures. But by drawing pictures as they are learning this skill, students will be connecting mathematical ideas and building conceptual understanding. New learning (simplifying radicals in Math 10) will be connected to prior learning (concept of a square root introduced in Math 8). Students will have a more solid understanding of why perfect squares are used.