Long Overdue: A Task for Calculus?

This week, the Vancouver Public Library is offering amnesty on long overdue fines. Readers with overdue fines stay away from libraries. The VPL wants them — patrons and their books — back.

Last year, someone dropped off a vinyl record at the VPL that was due in 1952. I wonder, “How much would have been accumulated in fines?”

Earlier this year, a man returned “The Real Book of Snakes” 41 years late to a library in Ohio. He enclosed $299.30 — 2¢ a day for 41 years. Seems a tad light. Safe to say, the Champaign County Library does not charge two pennies a day in 2013. The Vancouver Public Library charges 25¢ a day. Let’s go with that. Two bits a day for 41 years works out to $3741.25. Seems a tad excessive.

overdue

So, what’s “fair”? Averaging doesn’t work. That assumes the amount of the daily overdue fine as a function of time is a linear relation, with a constant rate of change of about 0.5¢/year. An increase of one penny from 2¢ to 3¢ in the early seventies is a 50% increase whereas an increase of one penny today is a 4% increase.

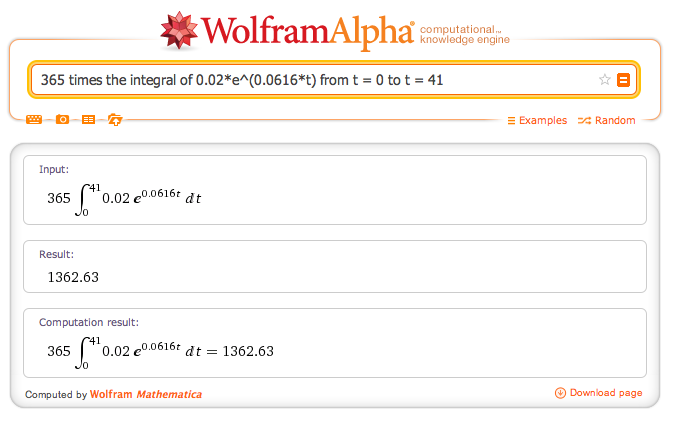
Instead, assuming the percentage increase is constant, an exponential function can be used (to approximate a step function). Solving 0.25 = 0.02*e^(r*41) for r gives r = 0.0616. Integrals, like overdue fines, have to do with change and the accumulation of change.

Does the following calculation give the total amount accumulated in fines? My calculus is rusty.

Screen shot 2013-10-29 at 9.03.40 AM

Also this year, “Fire of Francis Xavier” — along with a cheque for $100 — was returned 55 years late to the New York Public Library. How much should he have enclosed?

Remember this?

The start of a three-act task for Calculus, maybe? (Note: Click the links above to watch the news stories from Vancouver and New York.)

In the “real world,” overdue fines at the VPL max out after 42 days, or $10.50, at which time the book is regarded as lost and replacement fees and handling fees kick in. Once again, the “real world” is less interesting than asking “What if?”

Less Play-by-Play, More Colour Commentary

To many, Explain your thinking = Tell me your steps.

Which got me thinking about hockey.

In sports broadcasting, the play-by-play announcer gives a detailed account of the action. The colour commentator provides expert analysis and insight. The sideline reporter does this.

Listen for the difference (play-by-play vs. colour commentary) here:

From ‘Doc’ Emrick, play-by-play announcer, we learn:

  • Sidney Crosby tries to split the defence
  • Ryan Miller steers the puck into the corner
  • Crosby “crunches” the puck along to Jarome Iginla
  • Crosby scores
  • the game is over
  • Canada wins the gold medal

Emrick’s enthusiastic call certainly added to my enjoyment of the broadcast, but it did little to add to my understanding of the events. It’s the stuff of who, what, where, & when. I didn’t really need ‘Doc’ for this; I saw it for myself.

From colour commentator Ed Olczyk, who comes in at 0:50, we learn:

  • a two-on-two turns into a one-on-nothing
  • Sidney Crosby beats Ryan Miller under the pads
  • Jarome Iginla, as he’s falling down, makes a beautiful pass to Sidney Crosby
  • it’s man-on-man coverage in overtime
  • Crosby gets offensive position on Brian Rafalski

Olczyk answers how & why Crosby scores.

Back to the math classroom…

Explain your thinking.

Two fictional responses at two extremes:

Doc: First, I minused 5 from both sides. Then, I divided by 2 and got x equals 3.

Ed: We modelled open & closed using red & yellow counters. We looked for a pattern and noticed that the first three open lockers–1, 4, & 9–are perfect squares. We tested 24 & 25. Switching has to do with factors. Only the perfect squares have an odd number of factors: you only count the 5 for 25 once.

In many math classrooms (mine included), student explanations can sound more like the former than the latter; more detailed account of the calculations on the page than insight into mathematical thinking.

Math teachers can work backwards and determine that Doc completed a practice exercise; he solved 2x + 5 = 11 for x. They’ll also recognize that Ed solved a problem–the well-known locker problem. Students are more likely to explain their thinking if they are being asked to think.

But practice or problem, creating a culture of why–consistently asking “Why?”/”How do you know?”–can also insert colour.

At first, I thought this analogy might be helpful to students–a small part of conversations that also involve post-game analysis of shared student responses (formative feedback, exemplars, etc.).

Whiteboard apps, such as Explain Everything or Show Me, can be used to capture and share student thinking. Student-created videos shared with me (so far) are more play-by-play than colour commentary. There is a place for a description of events as they happen. In fact, I just used a step-by-step video tutorial to help me repair my dishwasher. But we’re talking about mathematics, not home appliance repair. Behind the bench of each student-created tutorial that gets a “meh” from me, there’s a teacher passionate about mathematics and/or technology. I think we have different gameplans. Maybe the sports broadcaster analogy would be helpful to teachers, too?

Got a student-created video that’s more colour commentary than play-by-play? See you in the comments.

And just for fun, the finer points of hockey:

A Turkey of a Graph

This news story could make for an engaging math task. The reporter even lists some questions students may have.

Thanksgiving

But what I really want to know is …

what is this?

Thanksgiving Graph

Graphs should reveal information about a situation (e.g., relationships, trends). Does this graph do that? The pictograph is cute, but does it suit the data? Choice of format aside, what’s with the different symbols/scales between categories? The reader can compare pounds of mashed potatoes to pounds of vegetables (kind of) and litres of gravy to litres of cranberry sauce, but what conclusion can he or she draw from comparing the mashed potato category to the gravy category (or to turkeys, rolls, or pies, for that matter)? And the spacing? At first glance, it looks like there are 80, not 100, pounds more mashed potatoes than vegetables. But wait–there’s an extra partial column of broccoli. At least it wasn’t Brussels sprouts.

Happy Thanksgiving.

Related:

xkcd: Tall Infographics

Ann, Brad, Carol, …

One of my favourite open questions we present to teachers:

Extend the pattern Ann, Brad, Carol, … , in as many ways as you can.

That’s it. Simple, but brings out some big ideas.

So what’s next? Daniel gets a lot of early votes: starts with D, male, six letters. At some point, the increasing pattern–start at three letters and add one each time–becomes challenging. Take Elizabeth. Starts with E? Check. Female? Check. Seven letters? Crap. Extending the pattern in this way eventually means hyphenated names.

Ted
Wait; was it any of those names with a “Lynn” after it?

After exhausting Ann, Brad, Carol, … as an increasing pattern–Eleanor!–teachers get creative with repeating patterns.

For example, looking at one attribute:

  • Aaron, Blake, Caleb (ABC)
  • Olivia, Jackson, Isabella (female-male-female)
  • Max, Liam, Jacob (3-4-5)

Looking at two or more attributes:

  • Andrew, Brooklyn, Christopher (ABC & female-male)
  • Ava, Bono, Chloe (ABC & female-male-female & 3-4-5)

What if Ann-Brad-Carol wasn’t the core of the pattern?

  • Ann, Brad, Carol, Connor, Amy, Bryn, Caden, Carter (ABCC & 3-4-5-6)

A different attribute:

  • Ann, Brad, Carol, Elijah, Genevieve (1-1-2-3-5 vowels)

Not mathy enough for you? Remember, not all teachers will have a positive attitude towards mathematics. This is a safe icebreaker. You can always follow it up with the mathier “Extend the pattern 5, 10, 15, … in as many ways as you can.”

The big idea? Patterns involve something that repeats. Sometimes items repeat, sometimes its the rule that repeats.

Ann, Brad, Carol, … can focus teachers/students on another big idea: the way you show information can make patterns easier to see. Moving from names to SET, spot the pattern in the photos below:

SET1

SET2

When I last posed the Ann, Brad, Carol, … problem, I encouraged teachers to rearrange the names to highlight patterns. One teacher connected this to 100 charts–an aha moment for her.

Big ideas above paraphrased from Marian Small’s Big Ideas.

This is part of this.

[TMWYK] Aero Bubble Bar

Recently, Nestlé launched the new AERO bubble bar throughout Canada and the UK.

For the benefit of the American readership:

cta_aero_bubblebar
Ten-frame!

From the press release:

As well as offering a unique bar design, guaranteed to stand out from the crowd, AERO’s innovation isn’t just for show. The new design sees the bar divided into ten easily snappable ‘bubbles’, making it less messy to eat and more portionable. What’s more, each of the ten ‘bubbles’ are designed to melt more easily in the mouth, maximising the taste of AERO’s signature bubbly chocolate.

I brought one home a couple weeks ago. I put the bar’s portionability to the test.

ow2ad

I snapped off two bubbles each for Keira (5), Gwyneth (8), and Marnie (N/A). Plus, two for me. (Missed math teacher opportunity, I know.) Two pieces were left over. “How much more should we each get?” I asked.

“Half,” Keira answered. She told me to make two cuts: two becomes four, or n(Keira’s family). For shits and giggles, we played with different cuts. What I learned from Keira:

the halves and the halve nots

“Or two-quarters,” Gwyneth piped up.

“Huh?” I returned, caught off-guard. “Tell me more,” I recovered. Gwyneth told me to cut each of the two bubbles into four quarters, giving us eight quarters. Eight pieces can be shared equally between four people. Each of us should get two pieces, or two-quarters.

Gwyneth’s strategy–divide each piece into fourths rather than make four pieces in all like her sister–surprised me. It’s a strategy that makes sense to her: dividing each piece into fourths means she’ll be able to form four equal groups. It’s a strategy that’s flexible: I don’t think she’ll be fazed by a curveball, like an additional bubble or family member.

Symbolically, we have:

0002W4

The result is trivial; her thinking is not.

For more math talk with kids, please follow Christopher Danielson’s new blog.