Monster Mash(-up)

The blog is going to be a 2013 version of itself for Halloween…

Act 1

Any questions?

  • How many different monsters can you make?

Here, a monster is made up of three cards: head, torso, and legs. In Bears vs Babies, a monster can be just a head or a head with one to four body parts. I’ve simplified the task to get at the fundamental counting principle.

Act 2

What information would be helpful to have here?

  • How many head, torso, and legs cards are there?

Students may want to act this out. Give them these cards. Encourage them to find a systematic way of counting the possibilities. How can the number of monsters be determined from the number of head, torso, and legs cards? Start with heads and torsos, if need be.

Act 3

The reveal…

Introduce tree diagrams. Connect this representation to students’ strategies. These might help:

Sequels

  • You have about 50 monsters in your hand. How many head, torso, and legs cards might you have?

Okay, So, Um, Mathematical Modelling, You Know

“Okay, so, um, square both sides of…”

At that moment, three students jumped to their feet and cheered. High fives may have even been shared. I asked them what was up. They asked if we could talk about it later. (Never press here, by the way. Rookie mistake. If kids give you an out, take it.) So we did. Each student had estimated how many times I would say “Okay, so, um…” during the lesson. Their earlier excitement? I hit the highest of the three estimates.

I had completely forgotten about this episode until last spring when Canucks rookie Brock Boeser’s first ever NHL postgame interview made it into my Twitter timeline. At that time, I was helping teachers make sense of the Ministry of Education’s (MoE’s) “Process for Solving Numeracy Tasks” (a/k/a a mathematical modelling cycle). This post is a collision between the two.

Interpret

Mathematical Modeling.002

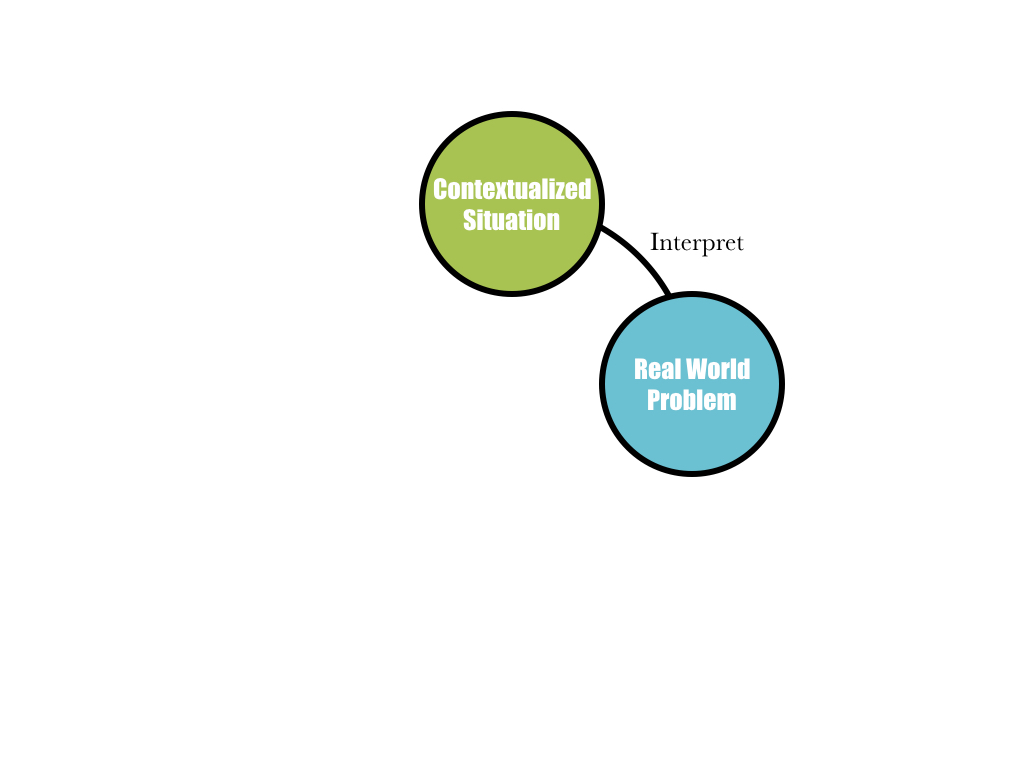
The Interpret process in this mathematical modelling cycle involves reading contextualized situations in order to identify real-world problems.

In this task, we can start with the following clip and ask “What do you notice?”

I noticed the sports clichés (NSFW). Brock Boeser’s “I just want to come here and help the team get a win” is damn close to “Nuke” Laloosh’s “I’m just happy to be here, hope I can help the ball club.” I also noticed that Boeser says “you know.” A lot. I wasn’t alone.

From here, we can develop a real-world problem by asking “What do you wonder?” or “What’s the first question that comes to mind?” My question: How many times does Brock Boeser say “you know” in the postgame interview?

Note: the starting point — in the diagram and in the video — is a situation, not a problem.

Apply (Mathematize)

Mathematical Modeling.003

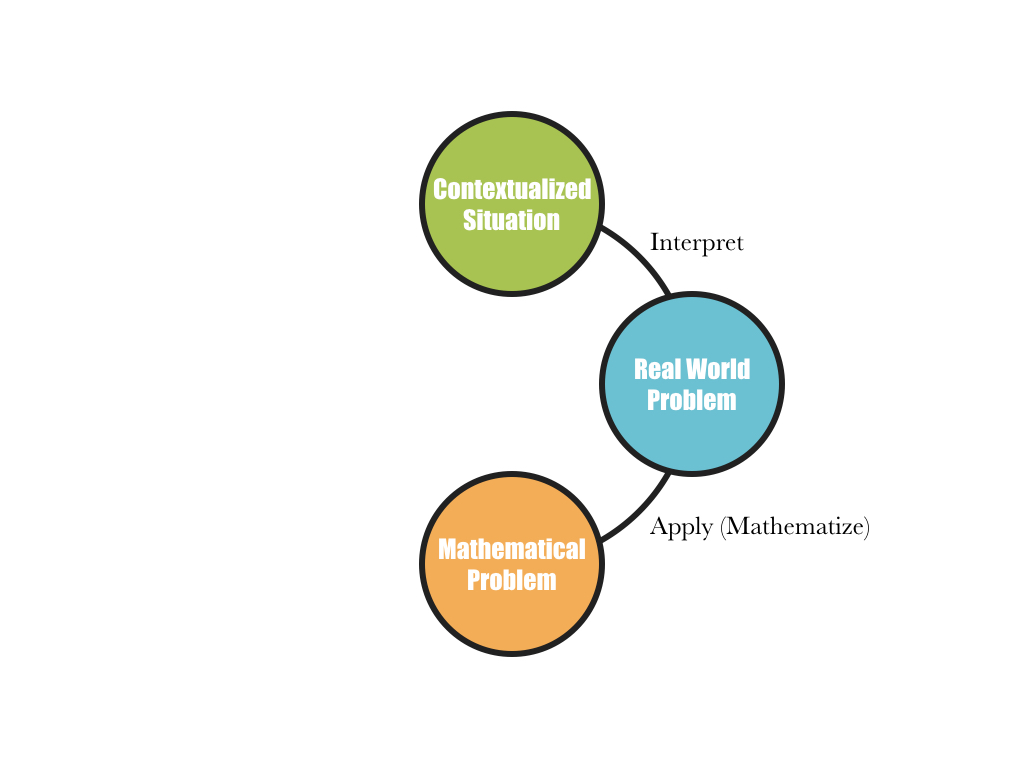
The next process involves identifying and activating mathematical understanding in order to translate real-world problems into mathematical problems. The MoE calls this Apply, a misused and abused term in mathematics education. Thankfully, Mathematize immediately follows in brackets throughout the documents.

We can ask “What information would be helpful to know here?” Students might want to know:

  • the number of times that Boeser says “you know” in the clip (12)
  • the length, in seconds, of the clip (44)
  • the length of the entire interview (2:58)
  • the rate at which Boeser says “you know” (?)
  • the fraction of the time in which Boeser is speaking (?)

This process also involves — among other things — creating relationships to represent the real-world problems. Here, a proportional relationship. A simple approach might involve setting up 12/44 = x/178. A math problem.

Solve

Mathematical Modeling.004

At first glance, this looks trivial: simply cross-multiply and divide. But the Solve process involves using a variety of approaches and representations. For example, students might use scale factors or unit rates; bar models or ratio tables. Or, not proportions, but linear relations. Tables, equations, graphs. Does the solution make mathematical sense?

Analyze

Mathematical Modeling.005

Does the mathematical solution (x = 48.545454…) make sense within the contextualized situation? The Analyze process involves identifying possible limitations and improvements. Brock Boeser says “you know” 12 times in the 44 second Act 2 video. But he reaches this count at 33 seconds and finishes answering the reporter’s question at 40 seconds. Does any of this matter? Is my simple proportional approach still useful?

Communicate

Mathematical Modeling.006

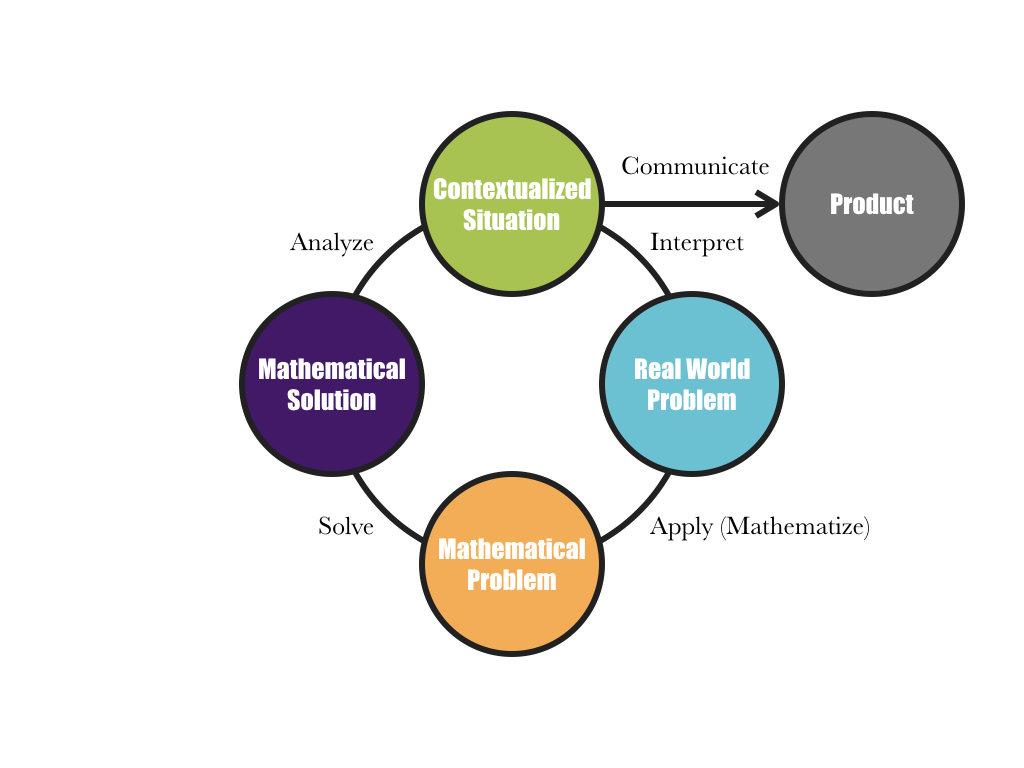
Students communicate throughout the Interpret, Mathematize, Solve, and Analyze processes. This communication happens within their groups. The Communicate process in this mathematical modelling cycle involves clearly and logically defending, explaining, and presenting their thinking and solutions outside of their groups.

There are better tasks that I could have picked to illustrate this mathematical modelling cycle. In fact, last year — in the absence of sample numeracy tasks from the MoE — my go-to here was Michael Fenton’s Charge. BC’s Graduation Numeracy Assessment aside, mathematical modelling with three-act math tasks (and the pedagogy around these tasks) has played an important role in my work with Surrey math teachers for several years. The MoE did release a sample numeracy assessment in late September; I am now able to include a Reasoned Estimates, Plan and Design, Fair Share, and Model task in these conversations with colleagues. For more numeracy tasks, see Peter Liljedahl’s site.

Okay, so, um, if I didn’t pick this Brock Boeser task because it, you know, epitomizes the mathematical modelling cycle, then why did I share it? Coming full circle to the story of my three students at the beginning of this post, there’s a missing piece. Yeah, we shared a laugh and I was more self-conscious of my verbal fillers for the rest of the year (2005 ± 3). But the most embarrassing part is that I have no idea how my students came up with their estimates. Because I didn’t ask. I mean, three girls spontaneously engaged in mathematical modelling — I promise there was more mathematical thinking here than in the task at hand — and not a single question from their math teacher! In my defence, it would be several years before mathematical modelling was on my radar — an unknown unknown. Still, what a complete lack of curiosity!

On Pace

Act 1

Steph Curry On Pace Headline Retouch

The retouched headline is designed to have students ask “How many 3-pointers will Stephen Curry make this season?” There are related questions: “At what pace (rate) is Curry making 3-pointers? What makes this pace historically ridiculous? What’s the difference between a historically ridiculous pace and a ridiculously historic pace?”

Here’s the thing about historic paces: historically, they happen weekly.

history-making historically dominant

Act 2

I retouched the first sentence in the article to open things up a bit. Pre-edit: “We’re nearly through 20 percent of the 2015-16 season…” Only the number of 3-pointers made to date (74) is needed. We don’t need to know the number of games played to date (15) or the number of games played in an NBA season (82). That’s the point of percent: fanatical comparison to 100. (I wonder if students would ask for this superfluous information anyway.) Post-edit, this information might, in fact, be useful to know. And help draw out multiple strategies. Perhaps students will ask for a fraction, rather than a percent, to fill in the blank. Games played and 3-pointers made to date can be determined from the following graph:

Steph Curry On Pace Graph 1:2

I cropped the infographic because it resolves an extension (see it from the waist down below). And because it’s too damn long.

Act 3

Steph Curry On Pace Headline

The article suggests two possible extensions: “How many 3-pointers does Steph Curry need per game remaining to reach 300? How many games will this take?”

Steph Curry On Pace Graph 2:2

Source: http://www.cbssports.com/nba/eye-on-basketball/25386027/steph-curry-3-point-tracker-on-pace-for-404-makes-in-2015-16

April 7, 2016: Steph Curry Is On Pace To Hit 102 Home Runs

May 11, 2016: 3-Point Tracker — 2015-16 Season

May 11, 2016: Misleading y-axis (h/t Geoff Krall)

Keypad

From The Blacklist…

Act 1

If you do know the four digits, how many combinations¹ could there be?

Act 2

Students may ask to see the four digits.

Keypad - Act 2
Keypad – Act 2

Remember to ask later if this information matters. That the digits are 1, 3, 4, 5 doesn’t; that there are four different digits — no repetition — does.

Act 3

My hope is that this resolution feels sort of anticlimactic — that Raymond Reddington’s “Now there’s only twenty-four combinations” on the screen doesn’t measure up to students’ shared strategies in the classroom.

Elizabeth Keen’s “Could be thousands of combinations” prior to Red’s sand trick could be an extension. At first viewing, it seems far-fetched that the character — an FBI profiler — doesn’t understand that there are exactly ten thousand four-digit possibilities (0000, 0001, 0002, …, 9999). But has Liz assumed that the digits cannot repeat? If so, how many combinations could there be? Students can no longer answer this question by systematically listing and counting each possibility.

I imagine this task as an introduction to, not an application of, permutuations. It provides a context for students to develop — not practice! — methods of counting without counting. Don’t bother if you’re anticipating a lot of knee-jerk 4!s from your students.

¹I know, I know… permutations.

[Misleading Graph] Peyton Manning vs. Russell Wilson

Does the graph create the impression that Peyton Manning has about 10 times as many pass attempts as Russell Wilson?

What can you do with this?

One approach would be to show students the graph and ask how this visual representation could be misleading. Point to the sizes of the circles.

A different approach could be to remove information (and add perplexity). Show them this:

PMvsRW (w: perplexity)

Have students estimate Peyton Manning’s career pass attempts. I’m anticating many students will compare the sizes of the circles. They’ll think about how many green circles could fit in the orange circle. They may not think 100, but I’m confident they’ll think much more than 10. They may have other strategies. Have students share them.

Give students rulers (and the formula A = Ï€r² if they ask for it). Ask them if they’d like to revise their estimate.

Reveal this:

PMvsRW (w:o perplexity)

Were students misled? I’m anticipating some will compare the diameters. Take advantage of that. If not, challenge them to find out why the circles are the sizes they are.

Given Manning’s circle, have students draw Wilson’s circle to the correct size. Again, have students share strategies.

(I’ve created this applet in GeoGebra. Not sure what, if anything, it gets me.)

Screen shot 2014-01-29 at 11.41.35 AM

Allowing students to possibly be misled by a misleading graph… should’ve thought of that earlier.

I don’t think @ESPNStatsInfo is trying to suggest a much wider experience gap. Seahawks fans may disagree, but the tweet backs me up. This is accidental: the result of focussing on graphic, not info, in infographic.

Parts Unknown

Last night, I caught a recent episode of “Anthony Bourdain: Parts Unknown.”

My first thought, “Ten-frame!” My second, “A possible three-act math task?”

Act One

I wrestled with including the first fifteen seconds of the clip. Will students ask their own questions if they suspect they’re going to answer one of Bourdain’s? Does the remainder of the clip make sense without this? Or, are the first fifteen seconds the first act, the remainder the second? By the way, Bourdain does a pretty good job on his blog of tossing out questions students may have:

Was I doing a good thing? Is it OK to be in the chocolate business? I don’t have any problem with wealthy people who can afford making impulse buys in expensive gourmet shops spending a lot of money on my chocolate. But where does the money go? In fact, where does this chocolate come from anyway? Just about everybody loves the stuff. It’s everywhere. A fundamental element of gastronomy. But I knew so little about it. Where does it come from? How is it made? Most importantly, who does it come from? And are they getting a good piece of the action? Or are the producers, as in so many cases, getting screwed over? I very much hoped to find that whoever was growing our cacao was, at the end of the day, happy about the enterprise — that life after Eric and Tony’s Excellent Chocolate Adventure was, on balance, better than life before.

Act Two

What information would be good to know? I wanted to know, what is a “nosebleed price”? From the man himself:

Thing is, it’s a very boutique-y, very high end, screamingly expensive end of the biz. One of the only 7,000 bars we were able to produce (the whole year’s supply sold off in just a few months) cost the nosebleed price of $18. Even reflecting the remote location, the rarity of the raw ingredient, the long trip from the mountains to the city to Switzerland and then to the States — the whole artisanal process — that’s still a f**k of a lot of money for a chocolate bar.

It looks to me like the producers get 15% of each chocolate ten-frame for the raw cacao, labour another 2.5%. For comparison, the three investors get 5% each.

Act Three

Raw Cacao: $2.70/bar; $18 900 in total
Labour: 45¢/bar; $3150 in total

Doesn’t exactly answer “Are they doing a good thing?” does it? And is it even possible to “show the answer” to this question? Can we adapt this task so that students use proportional reasoning to make a case for our cacao growers rather than just perform a couple of quick calculations? That is, can students use math to answer “How fair?” rather than “How much?” Differences in purchasing power and cost of living between nations now come into play.

Maybe this just doesn’t fit the three-act framework. Too bad. I kinda liked this sequel: How long would a Peruvian cacao grower have to work to purchase a luxury chocolate bar in Manhattan?

Suggestions?

Toblerone Task

“I couldn’t help but admire your large triangular prism,” I wrote. Sadly, this is not the strangest way I have begun an email to a colleague.

“Are you talking about the giant Toblerone-shaped thing? You math guys are weird,” she replied.

Anyway… my three-act math task:

act one

  • About how many regular size Toblerone chocolate bars fit inside the giant Toblerone-shaped thing?
  • Give an answer that’s too big.
  • Give an answer that’s too small.

act two

  • What information would be useful to know?

toblerone task act two 1

toblerone task act two 2

act three

63. Relax. The video is coming soon.

sequel

  • If 72 regular size Toblerone chocolate bars fit inside a mega Toblerone-shaped thing, how large would it be?
  • If 112 regular size Toblerone chocolate bars fit inside a mega Toblerone-shaped thing, how large would it be?

better still…

  • A mega Toblerone-shaped thing is a little bigger than a giant Toblerone-shaped thing. What could its dimensions be?
  • How many regular size Toblerone chocolate bars would fit inside?

I like the phrase “a little bigger.” Probably “borrowed” from Marian Small. The ambiguity here allows for multiple solutions. Students could increase the length of the prism or the size of the triangle base. Which has the greater effect?

Also, there’s something interesting happening here with the sum of consecutive odd numbers.

Oh yeah… a shout-out goes to Andrew Stadel for his Couch Coins task.

Fool me once, shame on… shame on you. Fool me… you can’t get fooled again.

Lately I’ve been enjoying Veritasium’s videos on misconceptions about science. From the Veritasium YouTube channel:

If you hold views that are consistent with the majority of the population, does that make you stupid? I don’t think so. Science has uncovered a lot of counterintuitive things about the universe, so it’s unsurprising that non-scientists hold beliefs inconsistent with science. But when we teach, we must take into account what the learners know, including their incorrect knowledge. That is the reason a lot of Veritasium videos start with the misconceptions.

I’ve been thinking about students’ misconceptions about mathematics. What math concepts are counterintuitive? How might starting with the misconception play out in the math classroom? Probability probably provides the most potential, from a pedagogical point of view. (Do robot graders give high marks for alliteration?) The classic Monty Hall problem or birthday problem are just two examples of this. Exponential growth can also be counterintuitive – see Chris Lusto’s alternative to the doubling penny problem.

One common misconception students have is that (a + b)^2 is equal to a^2 + b^2. In my classroom, I’d start with this misconception then have students substitute values before exploring this with algebra tiles. Not exactly Why does the Earth spin? type stuff. Still, addressing this misconception right off the bat provided us with a problem to solve – if (a + b)^2 is not equal to a^2 + b^2, then what is it equal to and why?

Recently, I was fascinated by Dan Meyer’s Coke v. Sprite question because my gut reaction was wrong. Twice. Please watch Dan’s act one video now. I’ll wait.

What fraction must you drink to balance the Coke can on edge?

My guess was that there was more Sprite in the Sprite glass than there was Coke in the Coke glass. After all, I reasoned, the Coke that was added to the Sprite also contained a small amount of Sprite.

When I did the calculations, I was surprised to learn that the amount of Sprite in the Sprite glass and the amount of Coke in the Coke glass were the same:

  • Assume the original amount of each is 100 mL.
  • Assume 10 mL of Sprite is transferred to the Coke.
  • 10 mL of pop is transferred back to the Sprite. Stirring means 10/110, or 1/11, of this is Sprite. 100/110, or 10/11, of this is Coke.
  • The amount of Sprite in the Sprite glass is now 90 mL + (1/11)*10 mL = 90 10/11 mL.
  • The amount of Coke in the Coke glass is now 100 mL – (10/11)*10 mL = 90 10/11 mL.

Before watching Dan’s act 3 video, my colleague Shelagh Lim and I modelled this with colour tiles:

  • Start with 12 green tiles on the left and 12 red tiles on the right.
  • Move 4 green tiles to the right. Now, 4/16, or 1/4, of the tiles on the left are green. 12/16, or 3/4, are red.
  • 4 tiles are moved back to the left. To simulate the effect of stirring, 1 of these 4 are green. 3 of these 4 are red.
  • The number of green tiles on the left is now 8 + 1 = 9.
  • The number of red tiles on the right is now 12 – 3 = 9.

Shelagh asked, “What if you don’t move back 1 green and 3 red? What if you close your eyes and take out 4 random tiles?” In other words, does stirring matter? I argued it did. “Something something proportions,” I said.

Mind. Blown.

I want students to experience this feeling of enjoyment at being led astray by their intuition. But, more importantly, students must also experience the feeling of enjoyment that comes from following their intuition and being correct. The former is not possible without the latter; to be amused by failure, there needs to be an expectation of success.