Open Middle Math

In my previous post, I shared some of the principles that guided Marc and me when creating a series of math videos for parents (Mathematics 6 & 7; 8–10): make it visual, make it conceptual, and make it inviting. In this way, we also set out to make these videos representative of math class. It was our hope that they presented parents with a view into their child’s classroom (“window”). Further, we hoped that Surrey teachers saw their classrooms in what was reflected (“mirror”). In that spirit, several videos in this summer’s collection included an open-middle problem.

In Open Middle Math, Robert Kaplinsky describes what makes a math problem an open-middle problem:

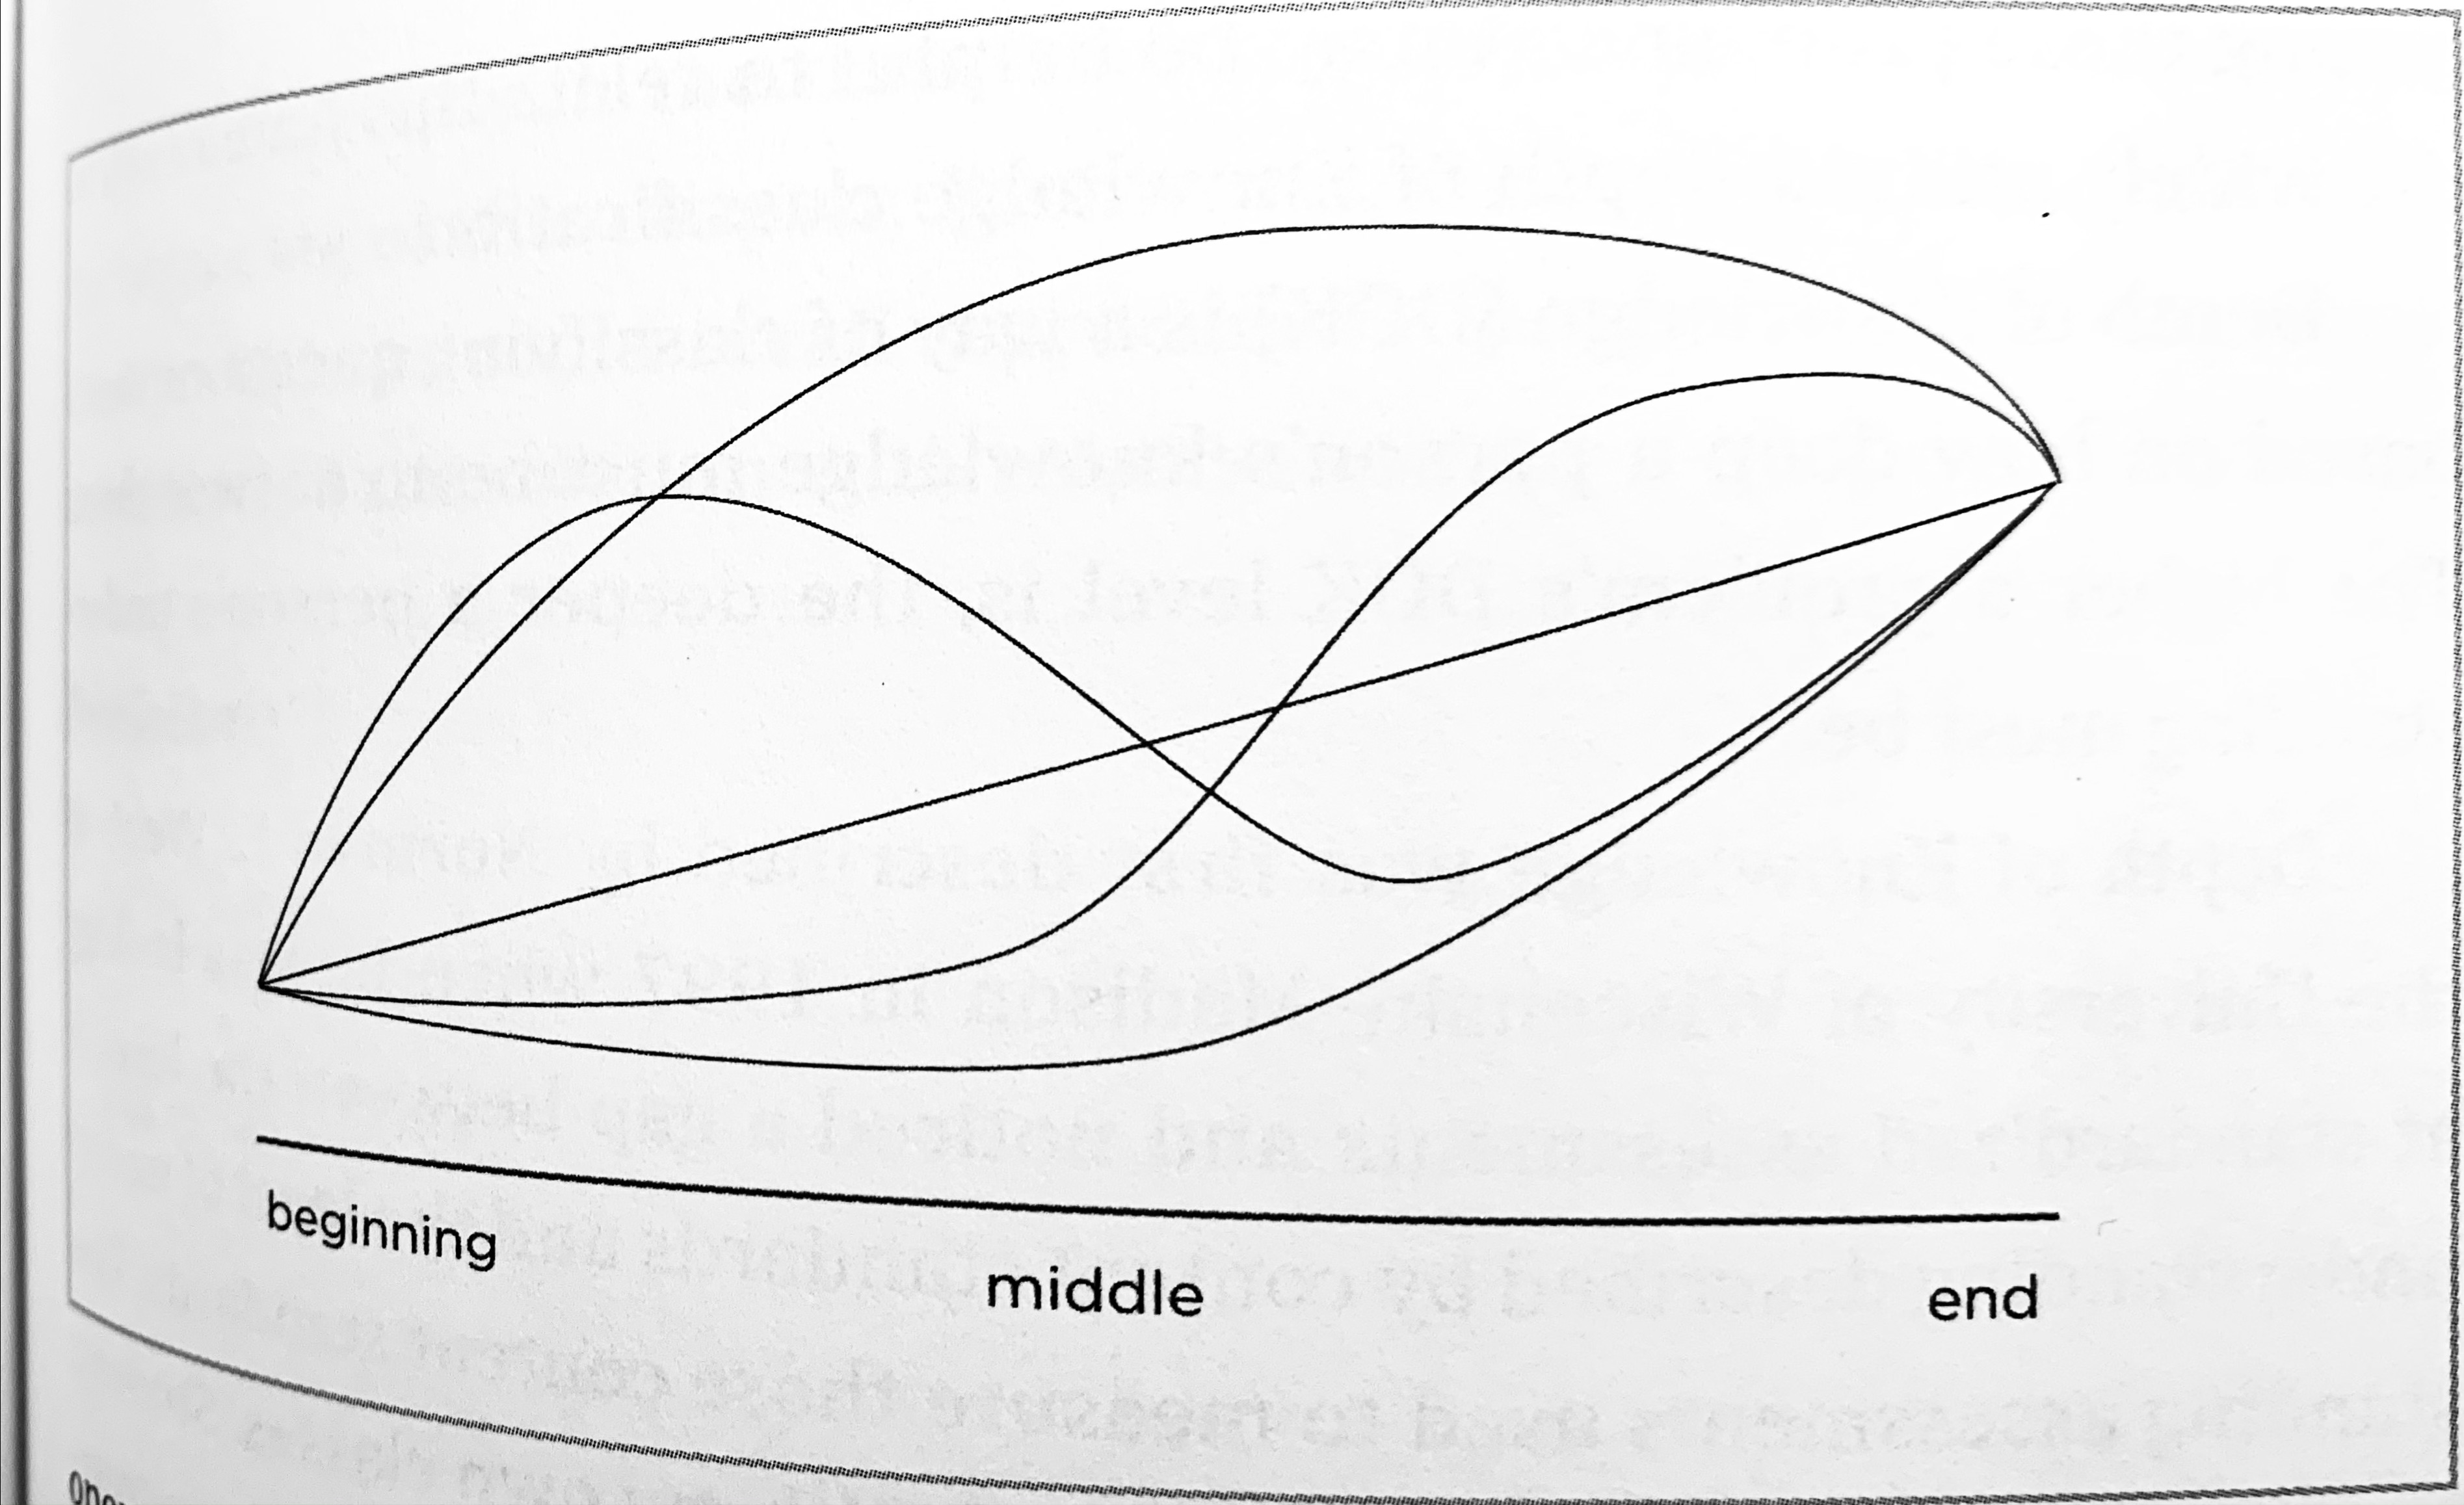
[M]ost math problems begin with everyone having the same problem and working toward the same answer. As a result, the beginning and ending are closed. What varies is the middle. Sometimes a problem’s instructions tell students to complete a problem using a specific method (a closed middle). Other times, there are possibly many ways to solve the problem (an open middle). Problems with open middles tend to be much more interesting and lead to richer conversations.

Robert Kaplinsky
Visual depiction of problems with a closed beginning, open middle, and closed ending from Dan Meyer

This use of open-middle to describe problems has always irked me. There, I said it. To me, open- vs. closed-middle is not a characteristic of a problem itself. Robert argues that a problem’s instructions can close a problem’s middle. Agreed! But I go a step further. There are other ways through which students are told to use a specific method. It’s us. For example, consider a boilerplate best-buy problem. The middle is wide open! Doubling, scaling up, common multiples, unit rates — dollars per can or cans per dollar — and marginal rates are all viable strategies. However, we close the middle when we give this task after demonstrating how to use unit prices to determine best deals (i.e., “now-you-try-one” pedagogy). If students — and teachers! — believe that mathematics is about plucking numbers to place into accepted procedures then they are unlikely to experience the rich “open-middleness” of this task, regardless of its instructions. It’s no accident that the book’s introduction is titled “What Does an Open Middle Classroom Look Like?”

Most of the problems posted on the open middle site involve number — or digit — tiles. But I get why Robert didn’t go with “Number Tile Math.” The boxes in 25 × 32 = ⬚⬚⬚ and 63 − 28 = ⬚⬚ give each a fill-in-the-blanks answer-getting feel. The routine nature misses the problem-solving mark (despite their open middles). So, “open-middle” as an adjective for problems it is. Besides, math class could use more openness, which needn’t come at the end for problems to be interesting and conversations to be rich.

When I look at an Open Middle problem from the site, the mathematical goal of the teacher who created the problem isn’t always clear to me. (The same is true, by the way, of wodb.ca.) What is the deep conceptual understanding that they anticipate their students will develop by working on the problem? What ideas will emerge? What misconceptions might be addressed? Throughout Open Middle Math, Robert describes how Open Middle problems can give us X-ray vision into our students’ mathematical understanding. Similarly, he provides readers with X-ray vision into his thinking during the process of creating these problems. Below, I’ll share a few of the open-middle problems from our video series (plus some that ended up on the cutting room floor) as well as a peek behind the curtain into my thinking.

Polynomials

Towards the end of the Math 10 Factoring Polynomials video, I present two open-middle/number-tile problems. Teachers will recognize these as familiar “find k” problems: For what value(s) of k is x2 + kx − 8 factorable? x2 − x − k? See the answer animations below.

x2 + kx − 8 (solution)
x2 − x − k (solutions)

I think that the number tiles add an element of play to these problems. The tiles are forgiving. Make a mistake? No biggie, just move ’em around. (The decision to show an initial misstep in the first animation above was deliberate.) This upholds our third principle: make it inviting.

These two sample tasks above highlight the role of students’ prior knowledge in solving open-middle problems. My assumption here is that teachers have not “proceduralized” these problems — that students have not been provided with predetermined solution pathways (e.g., “First, list all the factors of the constant term c. Then, …”). Note the open end of the second problem. The intent of my animation is to convey that there are infinitely many solutions. The problem presents students with an opportunity to generalize.

Each of these problems can be classified as Depth of Knowledge Level 2 (Skill/Concept). In both, students need a conceptual understanding of factoring x2 + bx + c where b and c are given. The second requires pattern-sniffing (or logic). I created a third problem that asks students to think about these two equations — and a third — simultaneously.

set of equations

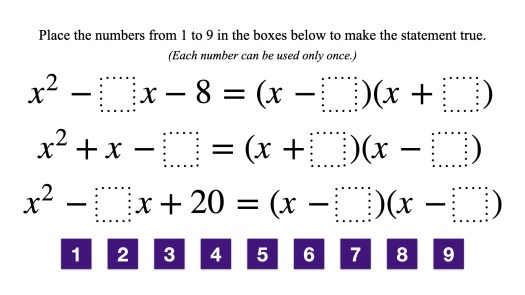
Note that x − 4 could be a factor of each trinomial. However, students need to determine where to put 4 so that the other digits can be placed in the remaining boxes. This twist might not be enough to raise it to DOK 3 (Strategic Thinking). Roughly speaking, Robert’s DOK 2 problems involve making statements true. Sometimes it’s satisfying an equation, sometimes it’s satisfying a condition (e.g., a system of equations having no solution). Robert’s DOK 3 problems call for optimizing a result — least, greatest, closest to.

In my Math 9 Polynomials video, I pose the following open question in the style of Marian Small: Two trinomials add to 3x2 + 7x + 6. What could they be? Here’s a problem, adapted from Open Middle Math, that also tackles adding polynomials:

adding polynomials

Both tasks can help reveal students’ understanding of combining like terms and manipulating coefficients and exponents. (In Task 1, I specify that the two polynomials be trinomials. This rules out responses such as (3x2) + (7x + 6) that sidestep like terms.) Task 2 is much more likely to show what students know about additive inverses, although a small tweak to Task 1 (e.g., Two trinomials add to 3x2 + 7x + 6. What could they be?) bridges this gap.

Integers

I include one open-middle problem in the application section of each of my Math 7 integer videos:

adding and subtracting integers
order of operations with integers

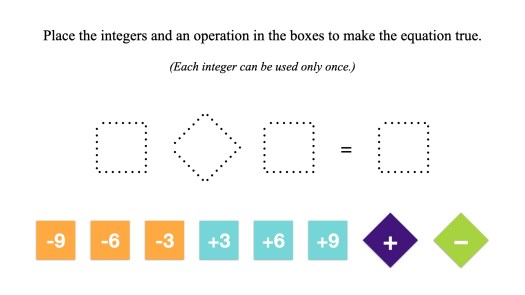
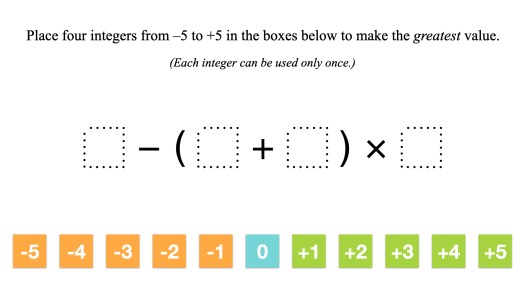
Note that the first is DOK 2 whereas the second is DOK 3. Maybe. I don’t want to quibble. What matters more than the differences between DOK 2 and 3 is that these questions require a deeper understanding than DOK 1 problems such as Evaluate: (−9) + (+3) or Evaluate: (+3) − [(−5) + (−4)] × (+5).

In the first video, I ask “How might finding one solution help you find more? How are some of the solutions related to one another?” These questions aren’t answered in the video — an exercise left to the viewer. Here are just some of the ideas that I would anticipate to emerge in an Open Middle classroom discussion:

  • addition and subtraction facts are related
    • e.g., (+6) + (+3) = +9 and (+9) − (+3) = +6 belong to the same “fact family”
  • this relationship extends from whole numbers to integers
    • e.g., (−6) + (−3) = −9 and (−9) − (−3) = −6 also form a fact family
  • subtracting a number can be thought of as adding it’s opposite
    • e.g., if (+6) + (+3) = +9 makes the equation true then so, too, does (+6) − (−3) = +9
  • swapping the number being subtracted (subtrahend) and the number it is subtracted from (minuend) changes the sign of the result (difference)
    • e.g., (+9) − (+3) is equal to positive 6 whereas (+3) − (+9) is equal to negative 6

Order of operations is a natural fit for optimization problems. In the second video, the intent of my answer animation is to communicate my mathematical reasoning. Once more, note that I show a couple of slight missteps and revisions to my thinking.

order of operations with integers (solution)

In addition to performing the operations in the correct order, students must think about how to maximize sums and minimize products. They must consider how subtracting a number increases the result. See one of Marc’s Math 7 decimal videos for another open-middle order of operations example.

Percents

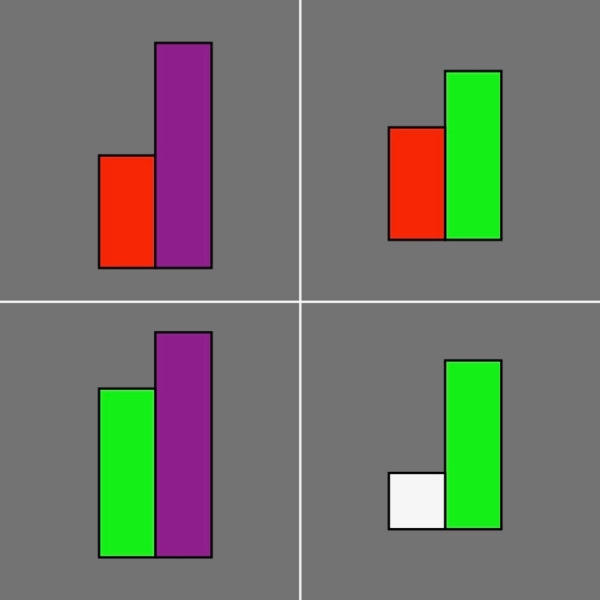
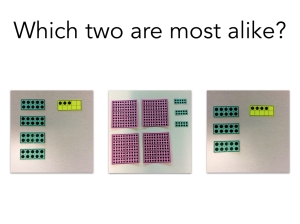
I did not include an Open Middle problem in my Math 7 Percents video. Rather, I chose to present a percents number talk: Estimate 78% of 49. Note that I show two strategies: one that makes use of quarters…

75% of 48

… and another that utilizes tenths.

80% of 50

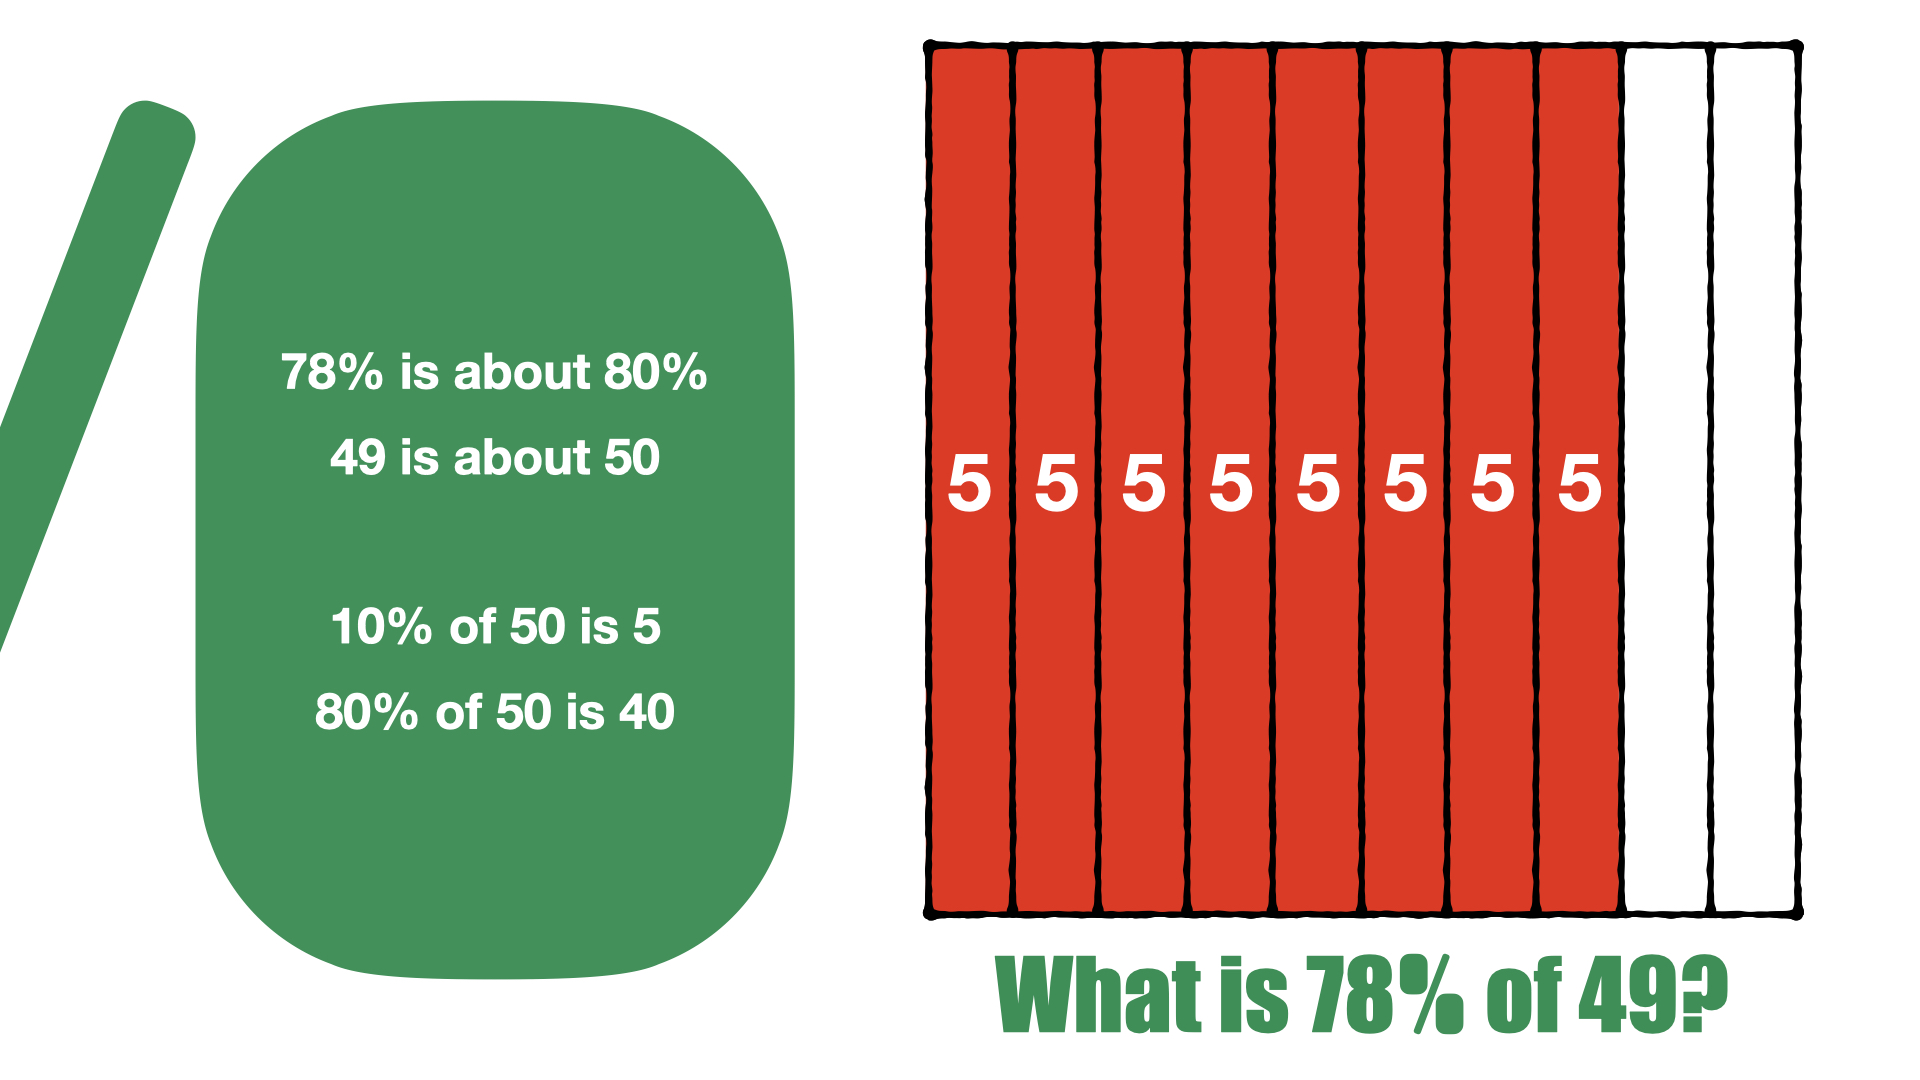
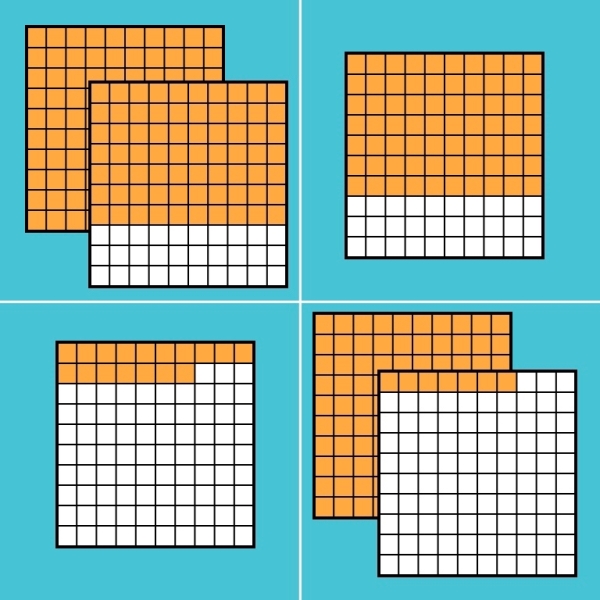
Because there are many ways to solve this problem, it can be thought of as a having an open middle despite it not having number tiles. A third, interesting, solution pathway can be taken. Instead of 78% of 49, we can estimate 49% of 78: 50% — or one-half — of 78 is 39. The idea that x% of y is equal to y% of x should emerge from the following:

commutative percents

It’s for this reason that I did not add the constraint Each number can be used only once. You can always add it later, which should bring about doubling and halving — and tripling and “thirding”!

x% of y is equal to 2x% of y/2; x% of y is equal to kx% of y/k

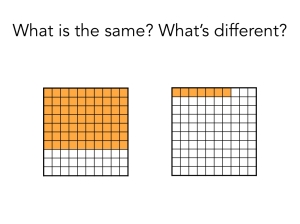
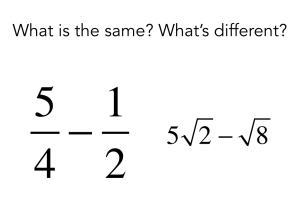
I like that the double number line problem below incorporates estimation; both 20 and 25 per cent are perfectly reasonable estimates. Also, it embraces our first principle — make it visual — which is largely missing from my other open-middle examples.

I wrestle a bit with whether or not to include the “only once” constraint. Does it enhance the problem above? I guess that it necessitates more practice; disqualifying 25% of 64 is 16 does compel students to seek out 25% of 68 is 17 or 25% of 76 is 19. But concentrating on unique tens and units digits of parts and wholes is irrelevant to percents. Again, you can always add this constraint later. (Update: Check out this slick Desmos activity from @TimBrzezinski!)

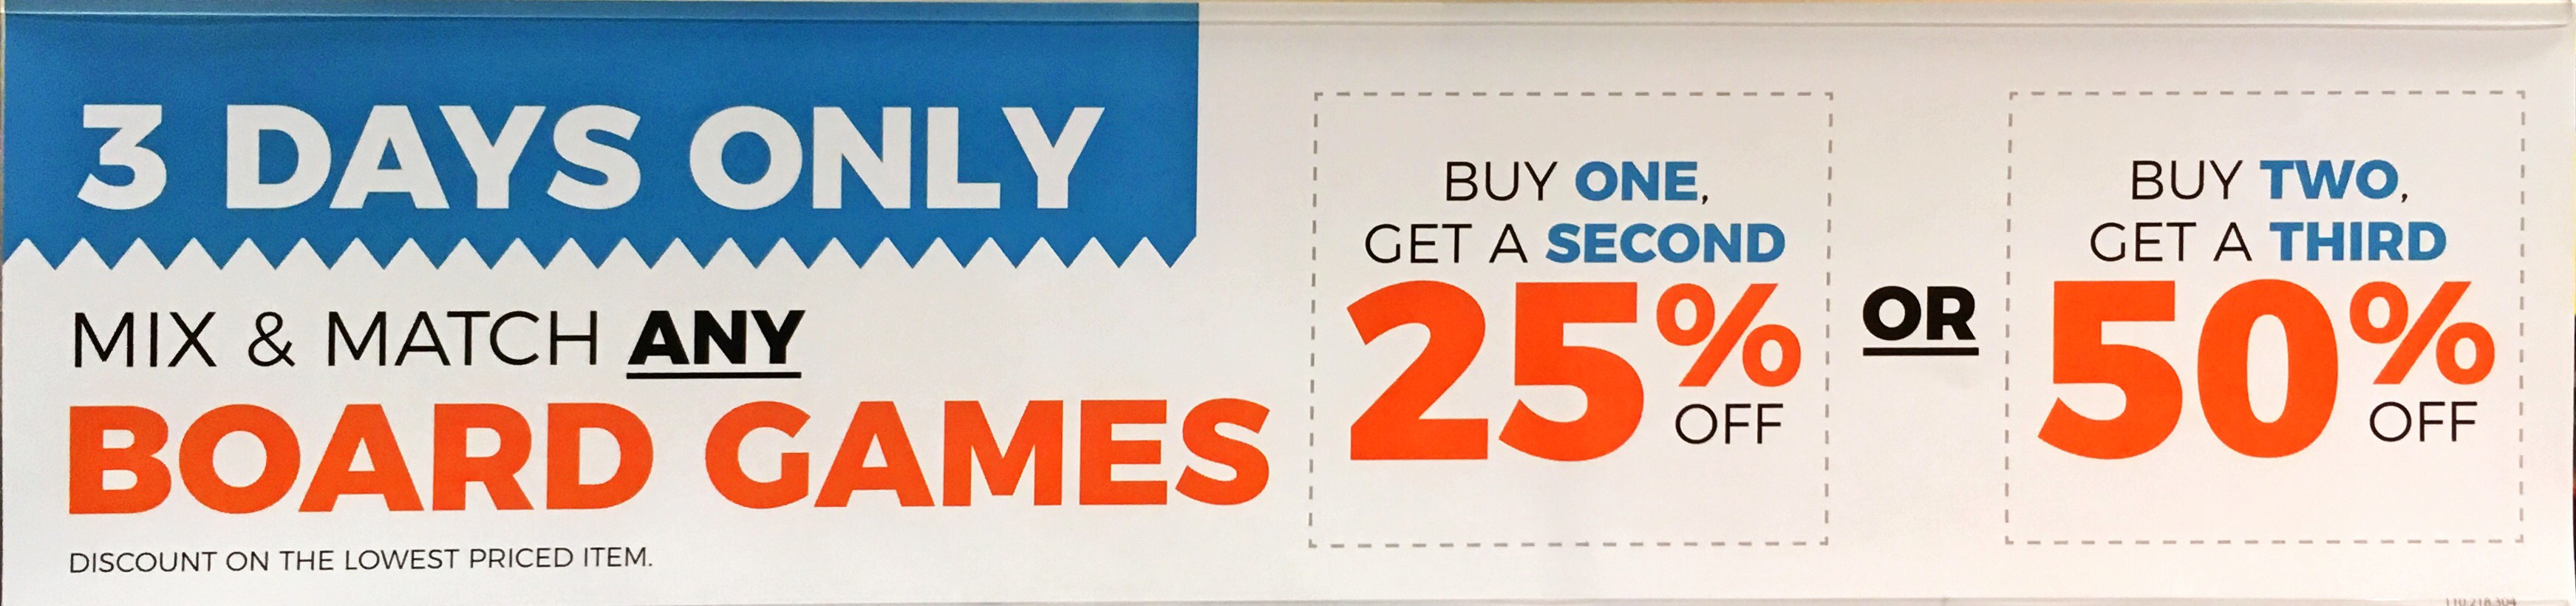
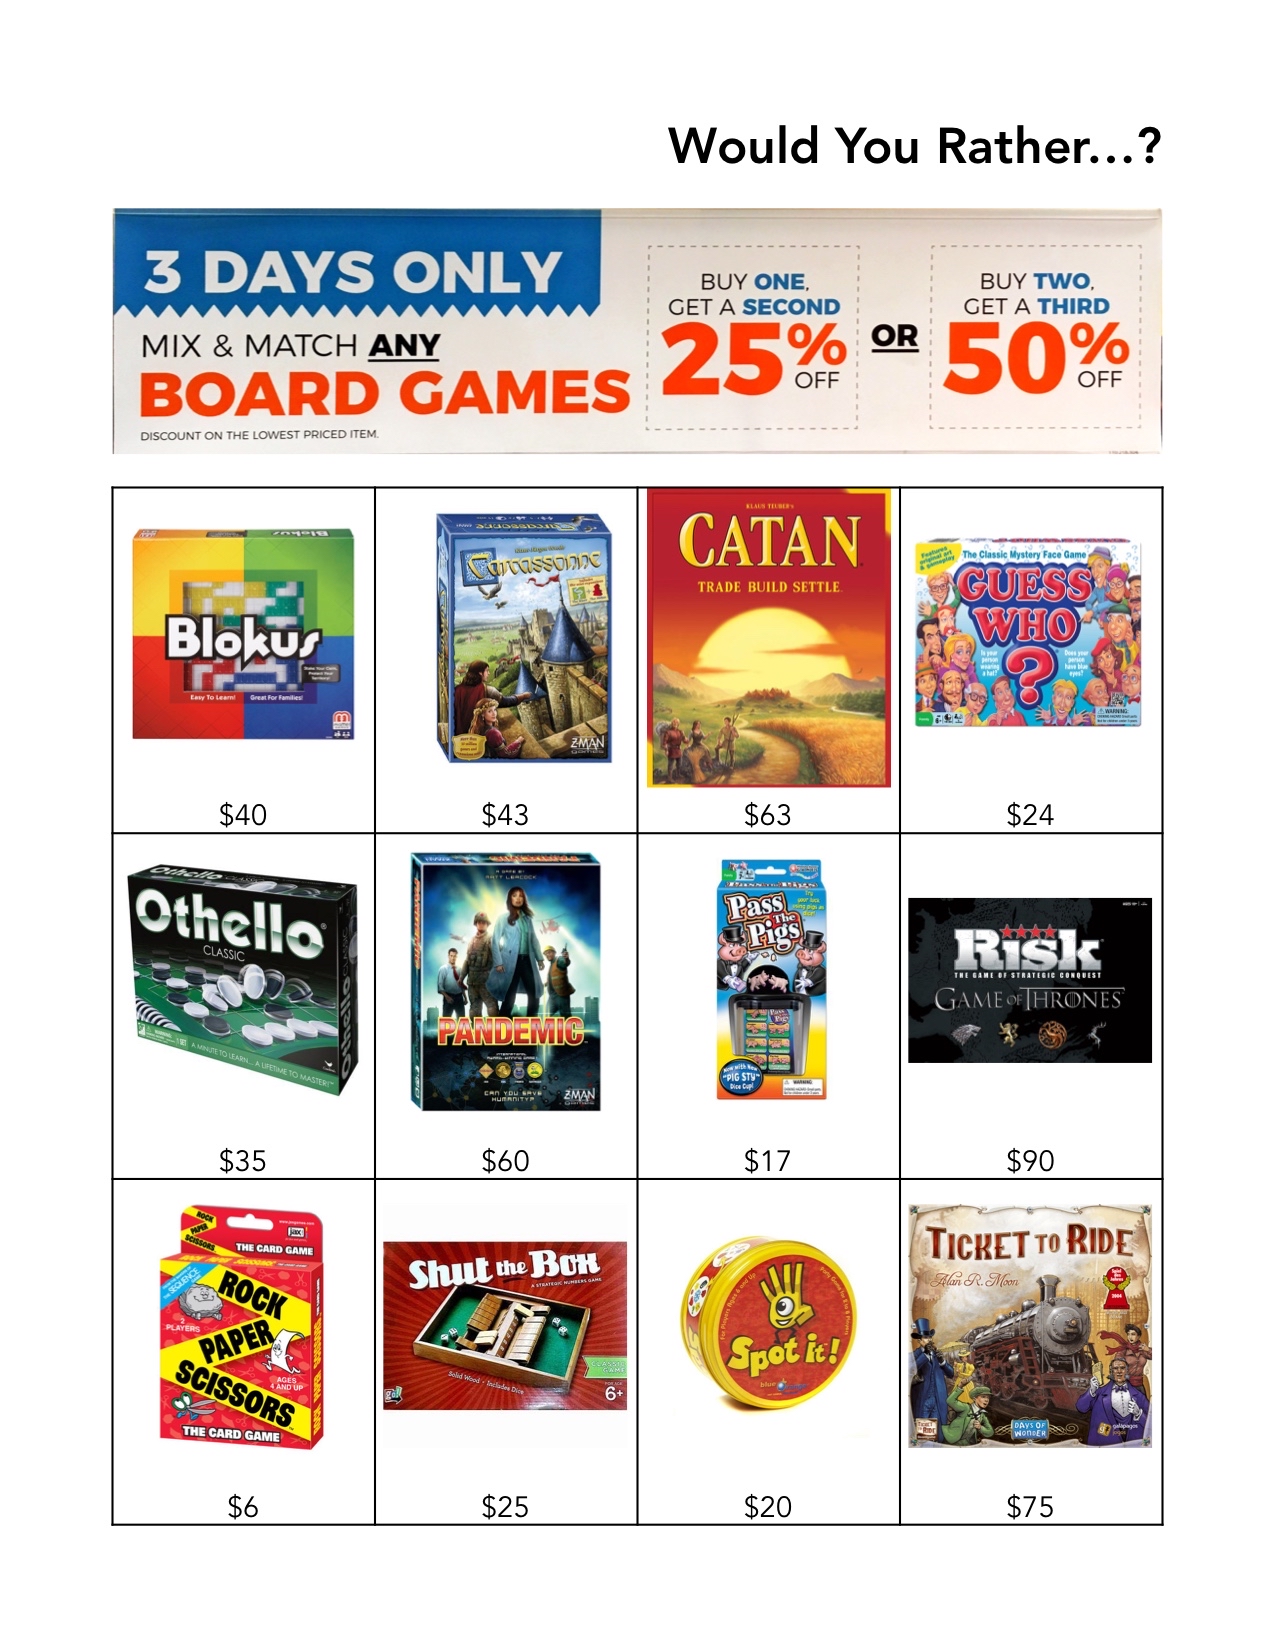
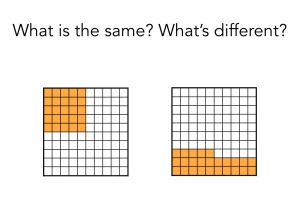
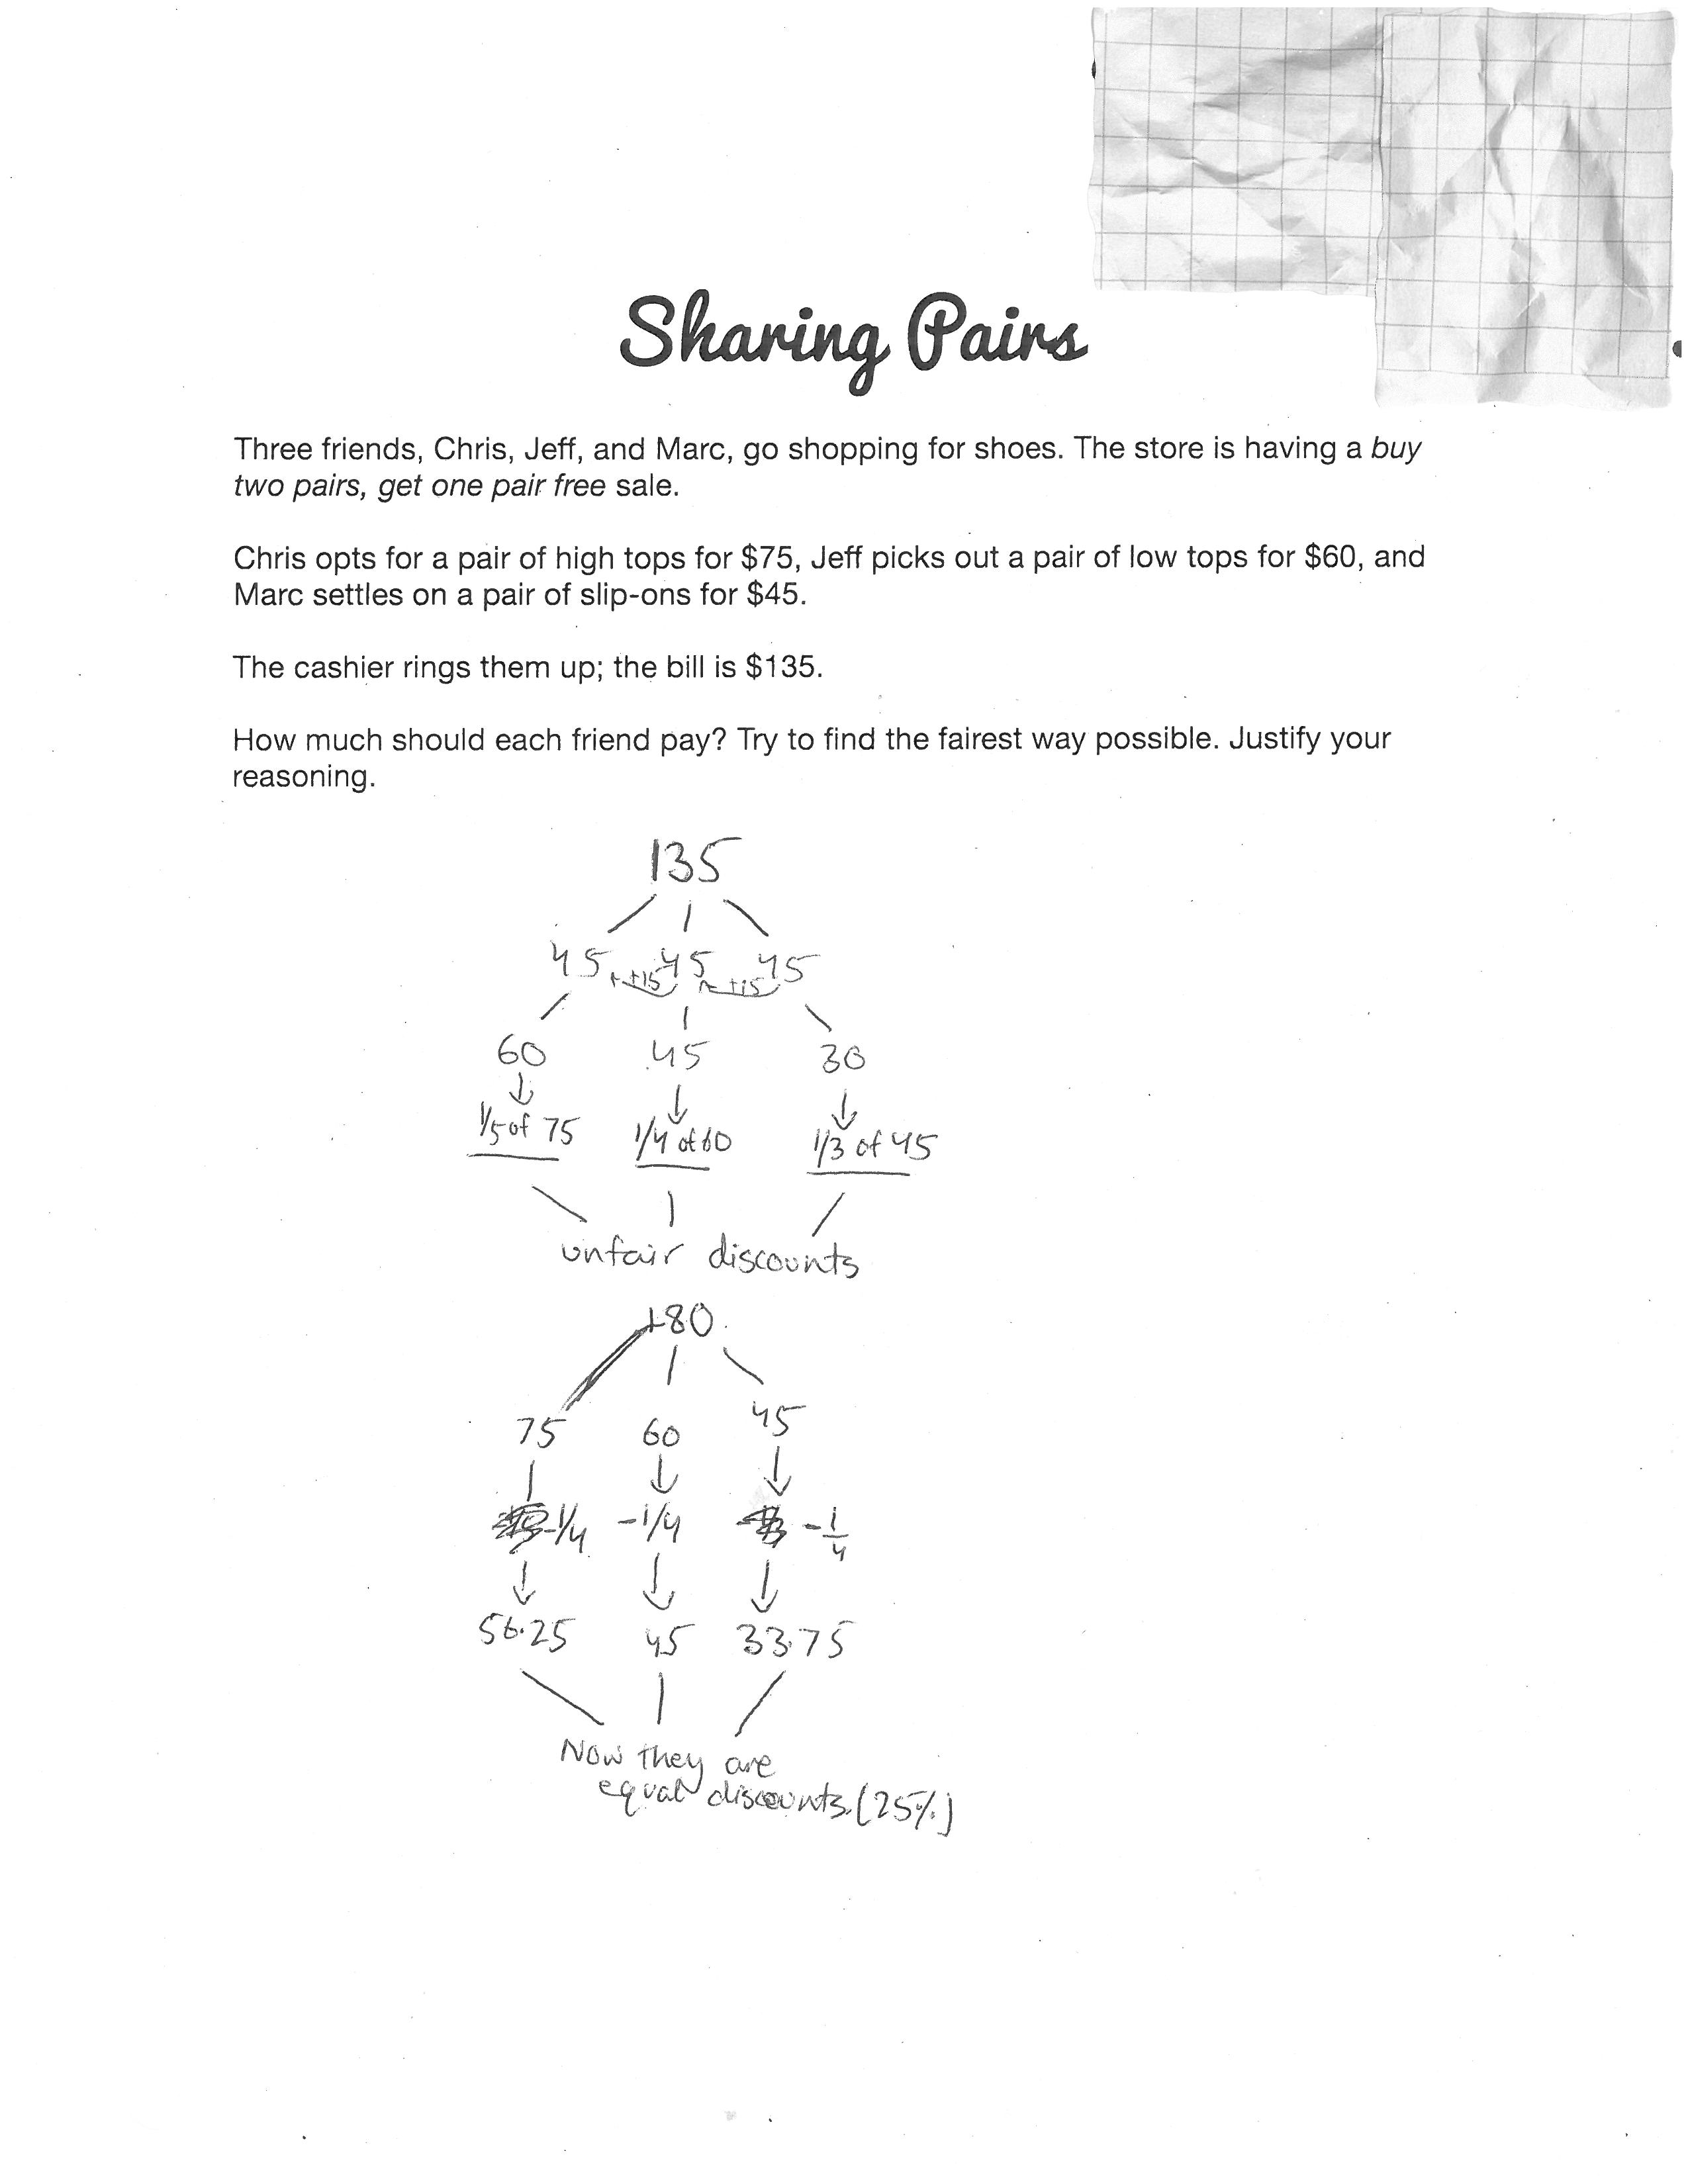
What might a DOK 3 Open Middle percent problem look like? Below is a possibility — or three! — that uses Robert’s optimization approach. (I haven’t played with the dollar value amounts so treat them as placeholders.)

percent discounts

Open Middle Math is a must read that will help you implement these engaging tasks. Whether you’re new to Open Middle problems or think you know all about ’em, you’ll love the glimpse into how Robert designs opportunities for students to persevere in problem solving and for teachers to gain insights into what students really understand.

Would You Rather: Board Games BOGO

A few weeks ago, I took my daughter to the mall. Later, she complained that “Dad spent half the time taking math photos!” Five of one hundred twenty minutes is not half!¹

One of those photos:

Board Game BOGO.JPG

I thought that this would make a great “Would You Rather…?” math task. I considered a few approaches. My preference is probably to just display the offer and have students make up their own prices and riff on “What if…?” That might be a tall order. I created a few combinations. (More on these in a sec.) But I wanted something more open.

Here’s where I landed:

wyr -- board games.pdf

The idea is that students would mix & match specific combinations of board games to justify their decisions.

For example, consider Carcassonne ($43) and Blokus ($40). With “buy one, get a second 25% off” the discount is $10 (25% of $40). Add Othello ($35) and with “buy two, get a third 50% off” the discount is $17.50 (50% of $35). It looks like the second option is the clear winner. But if we think about the (total) percent discounts, we get about 12% ($10/$83) and 15% ($17.50/$118), respectively. Proportionally, the gap shrinks.

What if we replace Othello above with Spot it! ($20)? Again, the discount is $10 (50% of $20). But it’s not a tie. Saving $10 on $83 is better than saving $10 on $103 (about 12% vs. 10%).

There are a couple of combinations where we can’t justify the second option. For example, consider Catan ($63) and Pandemic ($60). With “buy one, get a second 25% off” the discount is $15. Add Rock Paper Scissors ($6) and with “buy two, get a third 50% off” the discount sinks to $3.

Beyond making and justifying a decision using mathematics, I’d push students to generalize: When would you rather…?

A couple more photos from the mall:

3*5

3*6

“Dad, stop taking photos of arrays! Are these like the paint splatter thing?” Yep. Partially covered arrays in the wild. Lack of fraction sense aside, it’s nice to know that she’s paying attention. And making connections.

¹BTW, I use Microsoft Office Lens to quickly crop, clean up, and colour these photos on the fly. An essential app for teachers using vertical non-permanent surfaces (#VNPS on twitter). Check it out.

March 2023

A few WYR…? prompts involving discounts (and more):

Alike & Different: Which One Doesn’t Belong? & More

I have no idea what I was going for here:

WODB? Cuisenaire Rods

At that time, I was creating Which One Doesn’t Belong? sets. Cuisenaire rods didn’t make the cut. Nor did hundreds/hundredths grids:

WODB? Hundreds Grids

I probably painted myself into a corner. Adding a fourth shape/graph/number/etc. to a set often knocks down the reason why one of the other three doesn’t belong. Not all two-by-two arrays make good WODB? sets (i.e., a mathematical property that sets each element apart).

Still, there are similarities and differences among the four numbers above that are worth talking about. For example, the top right and bottom right are close to 100 (or 1); the top left and bottom right are greater than 100 (or 1); top left and top right have seven parts, or rods, of tens (or tenths); all involve seven parts in some way. There is an assumed answer to the question, “Which one is 1?,” in these noticings — a flat is 100 if we’re talking whole numbers and 1 if we’re talking decimals. But what if 1 is a flat in the top left and a rod in the bottom left? Now both represent 1.7. (This flexibility was front and centre in my mind when I created this set. The ten-frame sets, too.)

Last spring, Marc and I offered a series of workshops on instructional routines. “Alike and Different: Which One Doesn’t Belong? and More” was one of them. WODB? was a big part of this but the bigger theme was same and different (and justifying, communicating, arguing, etc.).

So rather than scrap the hundreds/hundredths grids, I can simplify them:

Alike&Different.006

Another that elicits equivalent fractions and place value:

Alike&Different.007

For more, see Brian Bushart’s Same or Different?, another single-serving #MTBoS (“Math-Twitter-Blog-o-Sphere”) site.

Another question that I like — from Marian Small — is “Which two __________ are most alike?” I like it because the focus is on sameness and, like WODB?, students must make and defend a decision. Also, this “solves” my painted-into-a-corner problem; there are three, not six, relationships between elements to consider.

Alike&Different.009

The numbers in the left and right images are less than 100 (if a dot is 1); the numbers in the centre and right can be expressed with 3 in the tens place; the left and centre image can both represent 43, depending on how we define 1.

At the 2017 Northwest Mathematics Conference in Portland, my session was on operations across the grades. The big idea that ran through the workshop:

“The operations of addition, subtraction, multiplication, and division hold the same fundamental meanings no matter the domain in which they are applied.”
– Marian Small

That big idea underlies the following slide:

Alike&Different.013

At first glance, the second and third are most alike: because decimals. But the quotient in both the first and second is 20; in fact, if we multiply both 6 and 0.3 by 10 in the second, we get the first. The first and third involve a partitive (or sharing) interpretation of division: 3 groups, not groups of 3. (Likely. Context can determine meaning. My claim here is that for each of these two purposefully crafted combinations of naked numbers, division as sharing is the more intuitive meaning.)

Similar connections can be made here:

Alike&Different.015

This time, the first and second involve a quotative (or measurement) interpretation of division: groups of (−3) or 3x, not (−3) or 3x groups. (What’s the reason for the second and third? Maybe this isn’t a good “Which two are most alike?”?)

I created a few more of these in the style of Brian’s Same or Different?, including several variations on 5 âˆ’ 2.

Alike&Different.017
Alike&Different.023

Note: this doesn’t work in classrooms where the focus is on “just invert and multiply” (or butterflies or “keep-change-change” or…).

And I still have no idea what I was going for with the Cuisenaire rods.

The slides:

Updates:

An edited version of this post appeared in Vector.

[BC’s Curriculum] “Know-Do-Understand” Model

This year, BC teachers (K-9) implement a new curriculum. For the past two years, much of my focus has been on helping teachers–in all subjects–make sense of the framework of this “concept-based, competency-driven” curriculum. This will be the topic of these next few posts.

In this series on curriculum, I’ll do my best not to use curriculum. There is no agreed upon definition. I imagine that if any educator in the “MathTwitterBlogoSphere” (#MTBoS) followed the link above, she’d be shouting “Those are standards, not curriculum!” Similarly, when #MTBoS folks talk about adopting curriculum, I’m shouting “That’s a resource, not curriculum!”

My union makes the following distinction: “Pedagogy is how we teach. Curriculum is what we teach.” Curriculum as standards. For the most part, this jibes with how curriculum is used in conversations with colleagues and is echoed in this Ministry of Education document. But Dylan Wiliam doesn’t make this distinction: “Because the real curriculum – sometimes called the ‘enacted’ or ‘achieved’ curriculum – is the lived daily experience of young people in classrooms, curriculum is pedagogy.” Curriculum as experiences. Or pedagogy.

Rather than curriculum, I’ll try to stick with learning standards, learning resources, or learning experiences.

Three elements–Content, Curricular Competencies, and Big Ideas–make up the “what” in each subject and at each grade level. Last summer, the Ministry of Education simplified this as the “Know-Do-Understand” (“KDU”) model. The video below describes how content (what students will know), curricular competencies (what students will do), and big ideas (what students will understand) can be combined to direct the design of learning activities in the classroom.

I imagined planning a proportional reasoning unit in Mathematics 8 using the KDU model and shared my thinking throughout this process.

This slideshow requires JavaScript.

Teachers can start with any of the three elements; I started by identifying content. (It’s a math teacher thing.) Then, I paired this content with a big idea. In English Language Arts and Social Studies, it makes sense to talk about you, as the teacher, making decisions about these combinations. In Mathematics and Science, this mapping is straightforward: algebra content pairs with a big idea in algebra, not statistics; biology content pairs with a big idea in biology, not Earth sciences. (BC math teachers may notice that the big idea above is different than the one currently posted on the Ministry of Education website. It may reflect a big idea from a previous draft. I can’t bring myself to make that change.)

Identifying curricular competencies to combine with content and big ideas is where it gets interesting. Here, my rationale for choosing these two curricular competencies was simple: problems involving ratios, rates, and percent lend themselves to multiple strategies… we should talk about them. The video makes the point that I could go in the opposite direction; if I had started with “use multiple strategies,” I likely would have landed at proportional reasoning. Of course, other curricular competencies will come into play, but they won’t be a focus of this unit. This raises questions about assessment. (More on assessment in an upcoming post.)

Note that “represent” is missing from my chosen curricular competencies. Why is that? My informed decision? Professional autonomy for the win? Or my blindspot? A teacher who sees proportional reasoning as “cross-multiply and divide,” who is unfamiliar with bar models, or double number lines, or ratio tables, or who sees graphs as belonging to a separate and disconnected linear relations chapter wouldn’t think of connecting this content to “represent.” Making connections between these representations is an important part of making sense of proportional reasoning. Will this build-a-standard approach mean missed learning opportunities for students? This speaks to the importance of collaboration, coaching, and curriculum, er, I mean quality learning resources.

In early talks, having these three elements fit on one page was seen as a crucial design feature. Imagine an elementary school teacher being able to view–all at once!–the standards for nine different subjects, spread out across her desk. As a consequence, the learning standards are brief. Some embraced the openness; others railed at the vagueness. In some circles, previous prescribed learning outcomes are described using the pejorative “checklist”; in others, there is a clamouring for “limiting examples.” (Math teachers, compare these content standards with similar Common Core content standards.)

I wonder if the KDU model oversimplifies things. If you believe that there is a difference between to know and to understand, then you probably want your students to understand ratios, rates, proportions, and percent. For a “concept-based” curriculum, it’s light on concepts. Under content, a (check)list of topics. To that end, I fleshed out each of the three elements (below). But I have the standards I have, not the standards I wish I had. (Free advice if you give this a try: don’t lose the that in that stem below.)

kdu-for-blog

kdu-proportional-reasoning.pdf

I wonder if the KDU model overcomplicates things. Again, U is for what students will understand. But “understanding” is one of the headers within the D, what students will do.

Despite this, I have found the KDU model to be helpful. In particular, it’s been helpful when discussing what it means to do mathematics. The math verbs that we’re talking about are visualize, model, justify, problem-solve, etc., not factor, graph, simplify, or solveforx. Similar discussions take place around doing science (scientific inquiry) and social studies (historical thinking).

More broadly, the model has been helpful in making sense of the framework of our new curriculum, or standards. It’s a useful exercise to have to think about specific combinations–far more useful than:

Q: “Which competencies did we engage in?”
A: “All of ’em!”

We’re still some distance from “the lived daily experience of young people in classrooms” but it isn’t difficult to imagine learning experiences in which this specific combination of the three elements come together.


Fair Share Pair

A couple weeks ago, I was discussing ratio tasks, including Sharing Costs: Travelling to School from MARS, with a colleague who reminded me of a numeracy task from Peter Liljedahl. Here’s my take on Peter’s Payless problem:

Three friends, Chris, Jeff, and Marc, go shopping for shoes. The store is having a buy two pairs, get one pair free sale.

 Chris opts for a pair of high tops for $75, Jeff picks out a pair of low tops for $60, and Marc settles on a pair of slip-ons for $45.

The cashier rings them up; the bill is $135.

How much should each friend pay? Try to find the fairest way possible. Justify your reasoning.

Sharing Pairs.pdf

I had a chance to test drive this task in a Math 9 class. I asked students to solve the problem in small groups and record their possible solutions on large whiteboards. Later, each student recorded his or her fairest share of them all on a piece of paper. If you’re more interested in sample student responses than my reflections, scroll down.

The most common initial approach was to divide the bill by three; each person pays $45. What’s more fair than same? I poked holes in their reasoning: “Is it fair for Marc to pay the same as Chris? Why? Why not?” Students notice that Chris is getting more shoe for his buck. Also, Marc is being cheated of any discount, as described by Student A. (This wasn’t a happy accident; it’s the reason why I chose the ratio 5:4:3.)

Next, most groups landed on $60-$45-$30. Some, like Student A, shifted from equal shares of the cost to equal shares of the discount; from ($180 − $45)/3 to $45/3. Others, like Students B, C, and D, arrived there via a common difference; in both $75, $60, $45 and $60, $45, $30, the amounts differ by $15. This approach surprised me. Additive, rather than multiplicative, thinking.

Student C noticed that this discount of $15 represented different fractions of the original prices; $15/$75 = 1/5, $15/$60 = 1/4, $15/$45 = 1/3. He applied a discount of 1/4 to all three because “it’s the middle fraction.” Likely, this is a misconception that didn’t get in the way of a reasonable solution.

Student D presented similar amounts. Note the interplay of additive and multiplicative thinking. She wants to keep a common difference, but changes it to $10 to better match the friends’ discounts as percents.

Student E applies each friend’s percent of the original price to the sale price. This approach came closest to my intended learning outcome: “Solve problems that involve rates, ratios and proportional reasoning.”

In spite of not reaching my learning goal, I think that this lesson was a success. The task was accessible yet challenging, allowed students to make and justify decisions, and promoted mathematical discourse.

Still, to increase the future likelihood that students solve this problem using ratios, I’m wondering about changes I could make. Multiples of 20 ($100-$80-$60) rather than 15 ($75-$60-$45)? Different ratios, like 4:3:2 or 5:3:2, might help; the doubles/halves could kickstart multiplicative thinking. (Also, 5:3:2 breaks that arithmetic sequence.)

Or, I could make changes to my questioning.

Sharing PairsWhen I asked “What do you notice?” students said:

  • the prices of the shoes are different
  • Chris’ shoes are the most expensive
  • Marc’s shoes are the cheapest
  • Chris’ shoes are $15 more than Jeff’s, which are $15 more than Marc’s
  • Jeff’s shoes are the fugliest

Maybe I could ask “What else could you say about the prices of Chris’ shoes compared to Marc’s?” etc. to prompt comparisons involving ratios. If that fails, I’m more comfortable connecting ratios to the approaches taken by students themselves than I am forcing it.

BTW, “buy one, get one 50% off” vs. “buy two, get one free” would make a decent “Would you rather?” math task.

h/t Cam Joyce, Carley Brockway

Sharing Pairs - Sample Student Response A
Sharing Pairs – Sample Student Response A

Sharing Pairs - Sample Student Response B
Sharing Pairs – Sample Student Response B

Sharing Pairs - Sample Student Response C
Sharing Pairs – Sample Student Response C

Sharing Pairs - Sample Student Response D
Sharing Pairs – Sample Student Response D

Sharing Pairs - Sample Student Response E
Sharing Pairs – Sample Student Response E

Parts Unknown

Last night, I caught a recent episode of “Anthony Bourdain: Parts Unknown.”

My first thought, “Ten-frame!” My second, “A possible three-act math task?”

Act One

I wrestled with including the first fifteen seconds of the clip. Will students ask their own questions if they suspect they’re going to answer one of Bourdain’s? Does the remainder of the clip make sense without this? Or, are the first fifteen seconds the first act, the remainder the second? By the way, Bourdain does a pretty good job on his blog of tossing out questions students may have:

Was I doing a good thing? Is it OK to be in the chocolate business? I don’t have any problem with wealthy people who can afford making impulse buys in expensive gourmet shops spending a lot of money on my chocolate. But where does the money go? In fact, where does this chocolate come from anyway? Just about everybody loves the stuff. It’s everywhere. A fundamental element of gastronomy. But I knew so little about it. Where does it come from? How is it made? Most importantly, who does it come from? And are they getting a good piece of the action? Or are the producers, as in so many cases, getting screwed over? I very much hoped to find that whoever was growing our cacao was, at the end of the day, happy about the enterprise — that life after Eric and Tony’s Excellent Chocolate Adventure was, on balance, better than life before.

Act Two

What information would be good to know? I wanted to know, what is a “nosebleed price”? From the man himself:

Thing is, it’s a very boutique-y, very high end, screamingly expensive end of the biz. One of the only 7,000 bars we were able to produce (the whole year’s supply sold off in just a few months) cost the nosebleed price of $18. Even reflecting the remote location, the rarity of the raw ingredient, the long trip from the mountains to the city to Switzerland and then to the States — the whole artisanal process — that’s still a f**k of a lot of money for a chocolate bar.

It looks to me like the producers get 15% of each chocolate ten-frame for the raw cacao, labour another 2.5%. For comparison, the three investors get 5% each.

Act Three

Raw Cacao: $2.70/bar; $18 900 in total
Labour: 45¢/bar; $3150 in total

Doesn’t exactly answer “Are they doing a good thing?” does it? And is it even possible to “show the answer” to this question? Can we adapt this task so that students use proportional reasoning to make a case for our cacao growers rather than just perform a couple of quick calculations? That is, can students use math to answer “How fair?” rather than “How much?” Differences in purchasing power and cost of living between nations now come into play.

Maybe this just doesn’t fit the three-act framework. Too bad. I kinda liked this sequel: How long would a Peruvian cacao grower have to work to purchase a luxury chocolate bar in Manhattan?

Suggestions?

Math in the Shark Tank

A recent “Shark Tank” episode featured two entrepeneurs pitching MiX Bikini, the world’s first interchangeable swimsuit. Here’s a sneak peek:

Two things piqued my interest.

Thing One: The Product

“It’s no secret women love to stand out, but there is nothing worse for [a] woman than being at the beach and seeing another girl in the same bikini,” one partner says.

Nothing? Really?

Here’s how it works:

First, assuming [a] woman is not offended by the claim above, she selects a style of bikini top (halter or triangle). Next, she chooses one of 40 colours/patterns for the bikini top. She does this twice (right and left). She then selects a style of bikini bottom (classic or ‘scrunchie’) and picks out one of 33 colours/patterns. (In the “Shark Tank” video, the second model switches out the back bottom. On the Mix Bikini website, the front & back of the bikini bottoms always match.) The bikini tops must be connected. Customers must choose between rings or strings. Rings are available in 10 colours, strings in 9. Of course, bikini tops also need neck strings (right and left). Double neck strings come in 9 colours, rings & strings in 10.

This begs the question… How many Frankenkinis (sp?) are possible?

The website advertises it is possible to create thousands of bikinis.

Thousands? Try millions.

What number do you get? What assumptions do you make? Is fuschia & leopard print different than leopard print & fuschia? I maintain it is. It is best that I not elaborate.

Thing Two: The Pitch

“We are seeking fifty thousand dollars in exchange for five percent of our business,” says the first partner.

“That means that you’re saying the company is valued at one million dollars,” says Daymond, one of the Sharks.

“It was ten percent we were asking,” interrupts the second partner.

“So half a million dollars,” Daymond clarifies.

Uh-oh. The budding businessmen are confused. Mathematically disoriented. The Sharks smell blood. SPOILER ALERT– all does not end well. How did this happen? What went wrong?

My guess? The Sharks have number sense. They have mental math strategies. Daymond understands 5% is equal to 1/20. Therefore, if 1/20th of the business is valued at $50 000, then the total value of the company can be calculated by multiplying by 20 (or, more likely, by doubling and multiplying by 10). If $50 000 is 10%, or 1/10th, of the company, then the Sharks can multiply $50 000 by 10 (or, more likely, halve $1 000 000, the original evaluation).

In the “Shark Tank”, the Sharks often counter with benchmark percentages– 5%, 10%, 25%, 50%, 75%. I suspect the Sharks have strategies for other popular percentages (eg, for 40% they may halve, halve, and multiply by 10).

Our pitchmen, on the other hand, do not have number sense. They do not have mental math strategies. The bikini guys have procedures. The bikini guys have this:

BTW, if you’re looking for a lesson on combinations, check out Pair-alysis from Mathalicious.