This summer, Marc and I created a series of videos designed to help parents support their children in Math 8 and 9. As best we could, we tried to have parents actively “do the math” rather than passively consume content. The explorations were meant to simulate the classroom experiences of their children. Here’s one of my favourites…
Display the original photo and five enlargements.
Ask “Which of these photos look the same as the original?” This phrasing is intentionally vague. Have students talk about what it means to “look the same.” Introduce labels — it’ll make conversations easier.
At this stage, no numbers are given. I want learners to use their intuition and get a “feel” for the problem. Tell them not to worry about making an incorrect choice — they’ll get a chance to revise their thinking later on. Likely, they’ll rule out photos B and D. Photo B looks like a square; it looks like photo D has been stretched more horizontally than vertically. Photos A, C, and E are contenders. For example, students might suspect that the dimensions of E are double those of the original. Ask “How confident are you?”
Now is the time for numbers.
Ask “Would you like to revise your thinking? How confident are you now?” The numbers confirm this hunch about photo E (and C). They can also determine close calls, like photo A. Here, scale factors of 0.75 (height_original : width_original) versus 0.8 (height_A : width_A) or 1.25 (width_A : width_original) versus 1.33 (height_A : height_original) prove that photo A is not a true enlargement of the original. (Note that this might surface if students are making absolute rather than relative comparisons: after all, adding 1″ to both the width and height of the original gets us photo A.)
This context can also be used to explore strategies for determining a missing value in a proportion. What if the photo were “posterized”?
Although these videos were designed for parents, we’re hopeful that teachers find them helpful.
At that moment, three students jumped to their feet and cheered. High fives may have even been shared. I asked them what was up. They asked if we could talk about it later. (Never press here, by the way. Rookie mistake. If kids give you an out, take it.) So we did. Each student had estimated how many times I would say “Okay, so, um…” during the lesson. Their earlier excitement? I hit the highest of the three estimates.
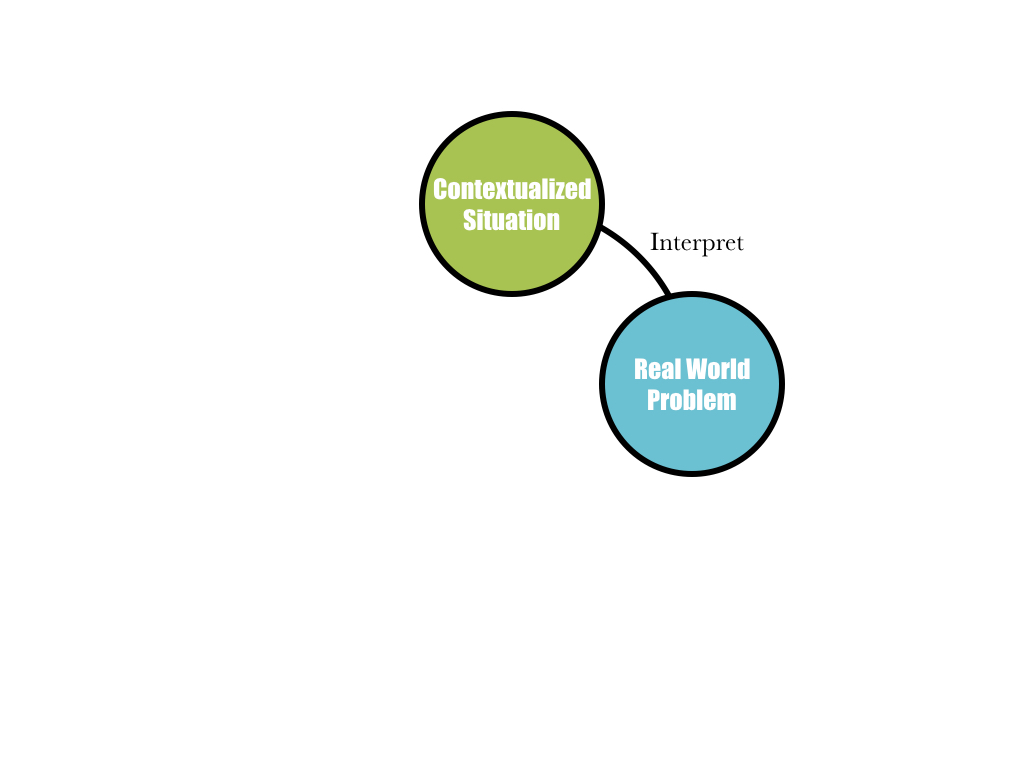
The Interpret process in this mathematical modelling cycle involves reading contextualized situations in order to identify real-world problems.
In this task, we can start with the following clip and ask “What do you notice?”
I noticed the sports clichés (NSFW). Brock Boeser’s “I just want to come here and help the team get a win” is damn close to “Nuke” Laloosh’s “I’m just happy to be here, hope I can help the ball club.” I also noticed that Boeser says “you know.” A lot. I wasn’t alone.
From here, we can develop a real-world problem by asking “What do you wonder?” or “What’s the first question that comes to mind?” My question: How many times does Brock Boeser say “you know” in the postgame interview?
Note: the starting point — in the diagram and in the video — is a situation, not a problem.
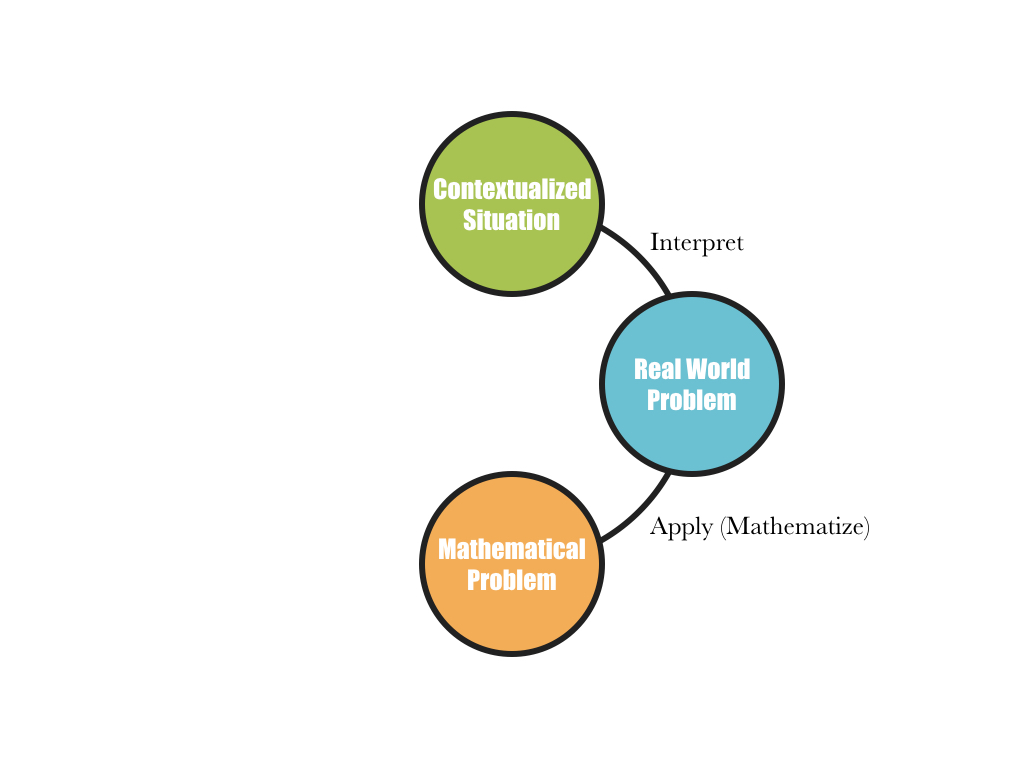
Apply (Mathematize)
The next process involves identifying and activating mathematical understanding in order to translate real-world problems into mathematical problems. The MoE calls this Apply, a misused and abused term in mathematics education. Thankfully, Mathematize immediately follows in brackets throughout the documents.
We can ask “What information would be helpful to know here?” Students might want to know:
the number of times that Boeser says “you know” in the clip (12)
the length, in seconds, of the clip (44)
the length of the entire interview (2:58)
the rate at which Boeser says “you know” (?)
the fraction of the time in which Boeser is speaking (?)
This process also involves — among other things — creating relationships to represent the real-world problems. Here, a proportional relationship. A simple approach might involve setting up 12/44 = x/178. A math problem.
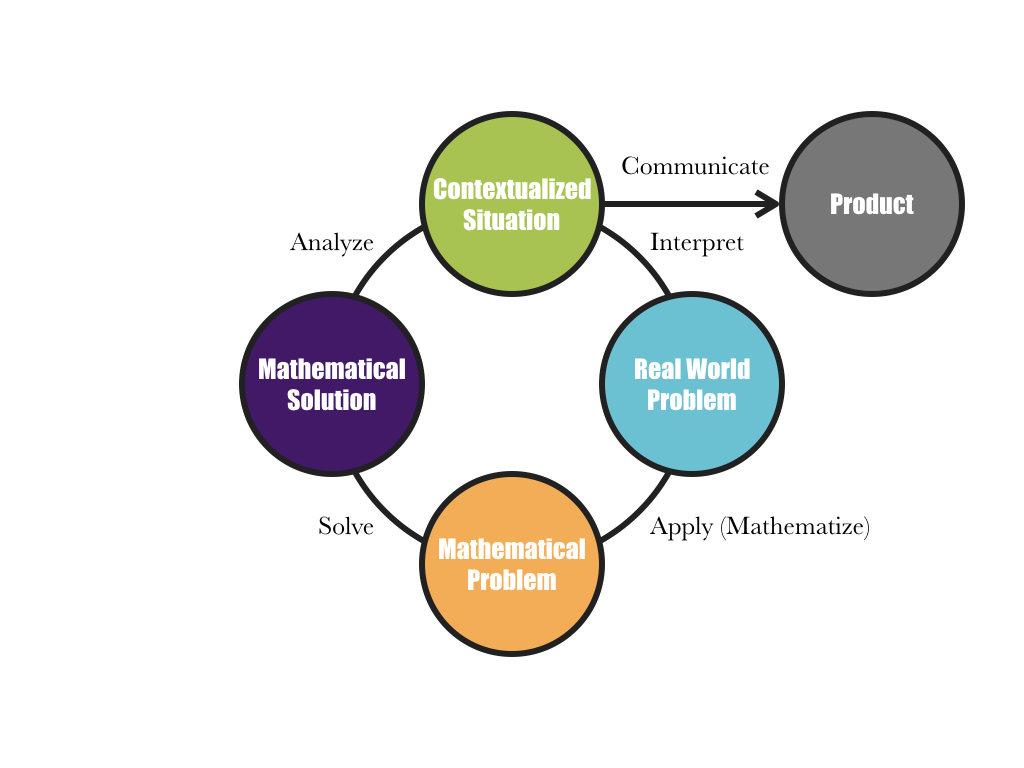
Solve
At first glance, this looks trivial: simply cross-multiply and divide. But the Solve process involves using a variety of approaches and representations. For example, students might use scale factors or unit rates; bar models or ratio tables. Or, not proportions, but linear relations. Tables, equations, graphs. Does the solution make mathematical sense?
Analyze
Does the mathematical solution (x = 48.545454…) make sense within the contextualized situation? The Analyze process involves identifying possible limitations and improvements. Brock Boeser says “you know” 12 times in the 44 second Act 2 video. But he reaches this count at 33 seconds and finishes answering the reporter’s question at 40 seconds. Does any of this matter? Is my simple proportional approach still useful?
Communicate
Students communicate throughout the Interpret, Mathematize, Solve, and Analyze processes. This communication happens within their groups. The Communicate process in this mathematical modelling cycle involves clearly and logically defending, explaining, and presenting their thinking and solutions outside of their groups.
There are better tasks that I could have picked to illustrate this mathematical modelling cycle. In fact, last year — in the absence of sample numeracy tasks from the MoE — my go-to here was Michael Fenton’s Charge. BC’s Graduation Numeracy Assessment aside, mathematical modelling with three-act math tasks (and the pedagogy around these tasks) has played an important role in my work with Surrey math teachers for several years. The MoE did release a sample numeracy assessment in late September; I am now able to include a Reasoned Estimates, Plan and Design, Fair Share, and Model task in these conversations with colleagues. For more numeracy tasks, see Peter Liljedahl’s site.
Okay, so, um, if I didn’t pick this Brock Boeser task because it, you know, epitomizes the mathematical modelling cycle, then why did I share it? Coming full circle to the story of my three students at the beginning of this post, there’s a missing piece. Yeah, we shared a laugh and I was more self-conscious of my verbal fillers for the rest of the year (2005 ± 3). But the most embarrassing part is that I have no idea how my students came up with their estimates. Because I didn’t ask. I mean, three girls spontaneously engaged in mathematical modelling — I promise there was more mathematical thinking here than in the task at hand — and not a single question from their math teacher! In my defence, it would be several years before mathematical modelling was on my radar — an unknown unknown. Still, what a complete lack of curiosity!
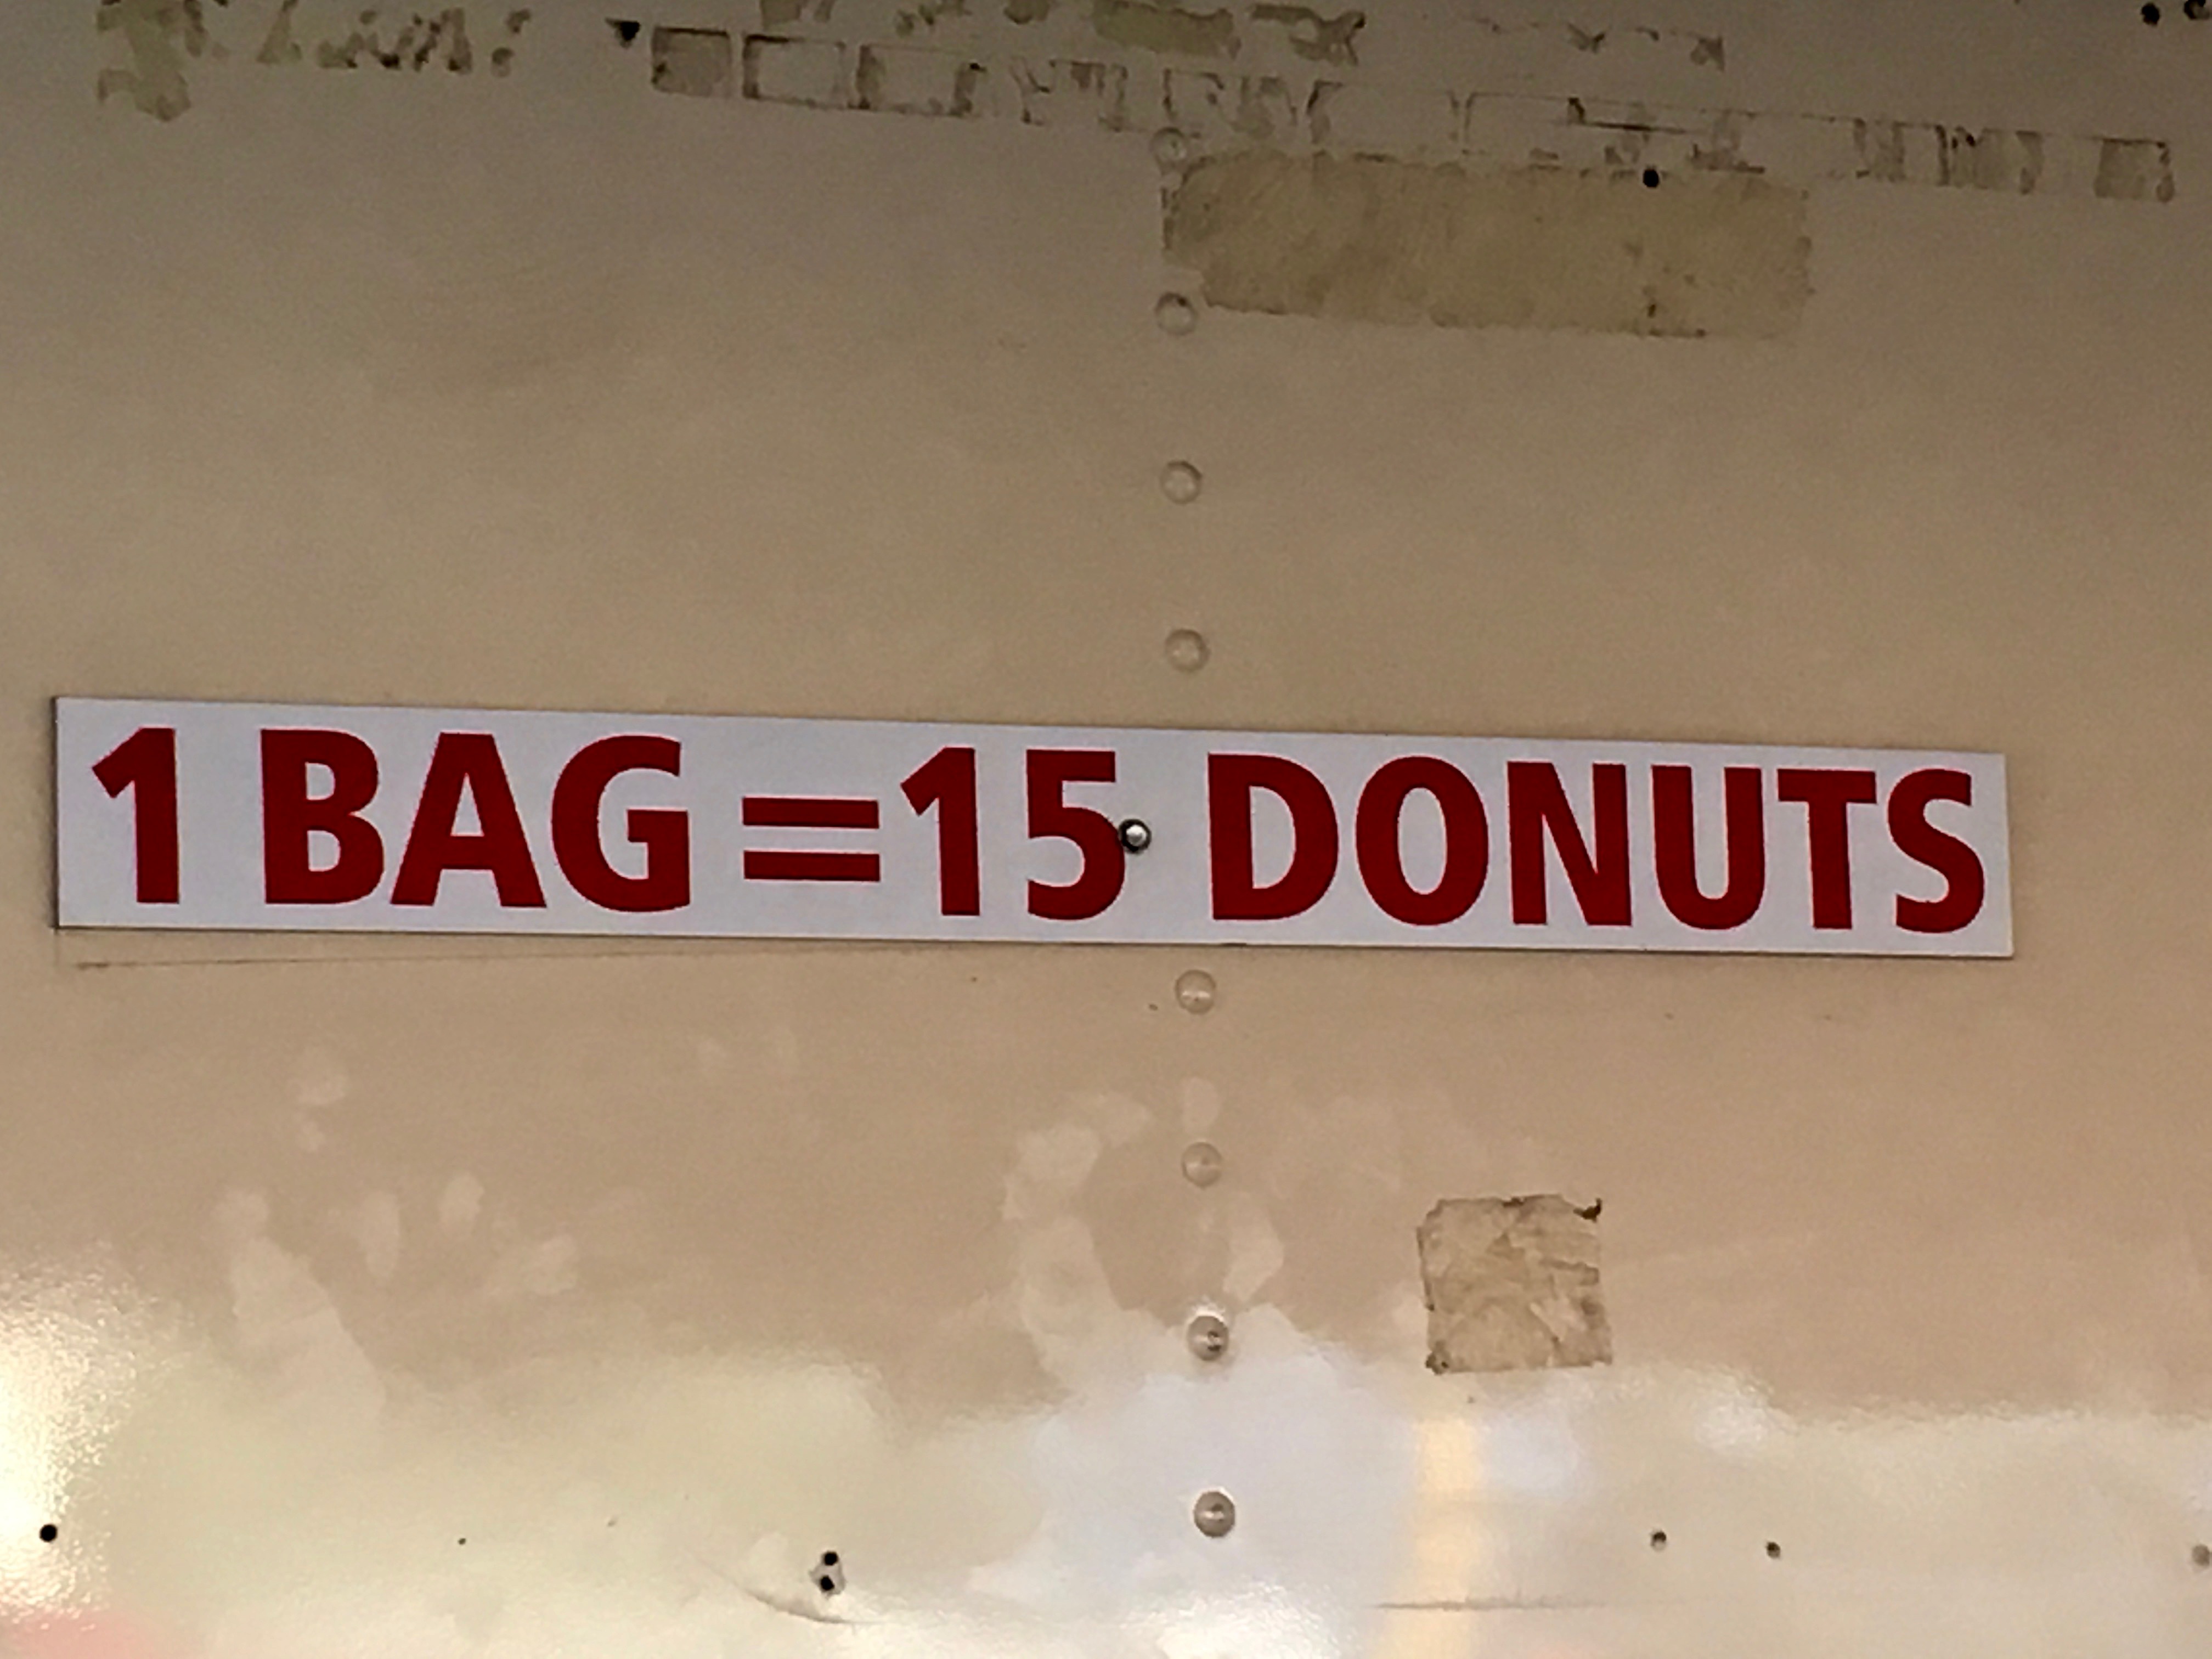
A week and a half ago, I was at The Fair and noticed this:
Two different mini donut vendors, two different sets of prices. I wondered “What’s the best deal?” As much as I love asking students “What do you notice? What do you wonder?” when introducing problems–see this introduction to “I Notice, I Wonder” from The Math Forum— I’m thinking about skipping this routine here and just presenting the context and problem (using these photos). Let me explain that decision later in this post.
I love best buy problems because they lend themselves to multiple strategies. From students, not “let me show you six different ways to solve these.” For example, I anticipate that many–most?–students will determine and compare unit rates. It’s an intuitive thing to do. (Or not. See Robert Kaplinsky’s discussion of his Carnival Tickets task.) At FunDunkers, it’s $12 for 3 bags, or $4 per bag; at those little DONUTS, it’s $10 for 2 bags, or $5 per bag. Winner: FunDunkers. Students may also think common multiples (or scale up). At Fundunkers, it’s $12 for 3 bags, so $24 for 6 bags; at those little DONUTS, it’s $10 for 2 bags, or $20 for 4 bags, or $30 for 6 bags. We can easily compare ratios or rates when one term is the same, be it one bag or six.
After having some students present their solutions, I’d display these photos…
FunDunkers
those little DONUTS
… and ask students if they’d like to revise their solutions. Now, students will likely determine and compare new unit rates. “One” has changed: dollars per one donut instead of dollars per one bag (#unitchat). Here some students may also consider one dollar to be the unit (and avoid fractions or decimals in doing so). At FunDunkers, it’s 36 donuts for $12, so 3 donuts per dollar; at those little DONUTS, it’s 45 donuts for $15, so 3 donuts per dollar. A tie. Less interesting than a reversal but, hey, “real world” numbers.
I like the teacher move of gradually providing students with new information and asking them if they’d like to revise their thinking. (It’s a strategy I used with Sinusoidal Sort and “Selfiest” Cities.) Not all the time. But in this task, if students wonder how many donuts are in each bag, then you kinda have to provide this up front. This means that we might not get the dollars per bag idea on the table at all–a missed opportunity to compare and connect strategies.
(Anyone else notice my donut hole-like tunnel vision in that last FunDunkers photo? One step back and maybe there’s a math task involving souvenir cups and pop refills.)
This year, BC teachers (K-9) implement a new curriculum. For the past two years, much of my focus has been on helping teachers–in all subjects–make sense of the framework of this “concept-based, competency-driven” curriculum. This will be the topic of these next few posts.
In this series on curriculum, I’ll do my best not to use curriculum. There is no agreed upon definition. I imagine that if any educator in the “MathTwitterBlogoSphere” (#MTBoS) followed the link above, she’d be shouting “Those are standards, not curriculum!” Similarly, when #MTBoS folks talk about adopting curriculum, I’m shouting “That’s a resource, not curriculum!”
My union makes the following distinction: “Pedagogy is how we teach. Curriculum is what we teach.”Curriculum as standards. For the most part, this jibes with how curriculum is used in conversations with colleagues and is echoed in this Ministry of Education document. But Dylan Wiliam doesn’t make this distinction: “Because the real curriculum – sometimes called the ‘enacted’ or ‘achieved’ curriculum – is the lived daily experience of young people in classrooms, curriculum is pedagogy.” Curriculum as experiences. Or pedagogy.
Rather than curriculum, I’ll try to stick with learning standards, learning resources, or learning experiences.
Three elements–Content, Curricular Competencies, and Big Ideas–make up the “what” in each subject and at each grade level. Last summer, the Ministry of Education simplified this as the “Know-Do-Understand” (“KDU”) model. The video below describes how content (what students will know), curricular competencies (what students will do), and big ideas (what students will understand) can be combined to direct the design of learning activities in the classroom.
I imagined planning a proportional reasoning unit in Mathematics 8 using the KDU model and shared my thinking throughout this process.
This slideshow requires JavaScript.
Teachers can start with any of the three elements; I started by identifying content. (It’s a math teacher thing.) Then, I paired this content with a big idea. In English Language Arts and Social Studies, it makes sense to talk about you, as the teacher, making decisions about these combinations. In Mathematics and Science, this mapping is straightforward: algebra content pairs with a big idea in algebra, not statistics; biology content pairs with a big idea in biology, not Earth sciences. (BC math teachers may notice that the big idea above is different than the one currently posted on the Ministry of Education website. It may reflect a big idea from a previous draft. I can’t bring myself to make that change.)
Identifying curricular competencies to combine with content and big ideas is where it gets interesting. Here, my rationale for choosing these two curricular competencies was simple: problems involving ratios, rates, and percent lend themselves to multiple strategies… we should talk about them. The video makes the point that I could go in the opposite direction; if I had started with “use multiple strategies,” I likely would have landed at proportional reasoning. Of course, other curricular competencies will come into play, but they won’t be a focus of this unit. This raises questions about assessment. (More on assessment in an upcoming post.)
Note that “represent” is missing from my chosen curricular competencies. Why is that? My informed decision? Professional autonomy for the win? Or my blindspot? A teacher who sees proportional reasoning as “cross-multiply and divide,” who is unfamiliar with bar models, or double number lines, or ratio tables, or who sees graphs as belonging to a separate and disconnected linear relations chapter wouldn’t think of connecting this content to “represent.” Making connections between these representations is an important part of making sense of proportional reasoning. Will this build-a-standard approach mean missed learning opportunities for students? This speaks to the importance of collaboration, coaching, and curriculum, er, I mean quality learning resources.
In early talks, having these three elements fit on one page was seen as a crucial design feature. Imagine an elementary school teacher being able to view–all at once!–the standards for nine different subjects, spread out across her desk. As a consequence, the learning standards are brief. Some embraced the openness; others railed at the vagueness. In some circles, previous prescribed learning outcomes are described using the pejorative “checklist”; in others, there is a clamouring for “limiting examples.” (Math teachers, compare these content standards with similar Common Core content standards.)
I wonder if the KDU model oversimplifies things. If you believe that there is a difference between to know and to understand, then you probably want your students to understand ratios, rates, proportions, and percent. For a “concept-based” curriculum, it’s light on concepts. Under content, a (check)list of topics. To that end, I fleshed out each of the three elements (below). But I have the standards I have, not the standards I wish I had. (Free advice if you give this a try: don’t lose the that in that stem below.)
I wonder if the KDU model overcomplicates things. Again, U is for what students will understand. But “understanding” is one of the headers within the D, what students will do.
Despite this, I have found the KDU model to be helpful. In particular, it’s been helpful when discussing what it means to do mathematics. The math verbs that we’re talking about are visualize, model, justify, problem-solve, etc., not factor, graph, simplify, or solveforx. Similar discussions take place around doing science (scientific inquiry) and social studies (historical thinking).
More broadly, the model has been helpful in making sense of the framework of our new curriculum, or standards. It’s a useful exercise to have to think about specific combinations–far more useful than:
Q: “Which competencies did we engage in?”
A: “All of ’em!”
We’re still some distance from “the lived daily experience of young people in classrooms” but it isn’t difficult to imagine learning experiences in which this specific combination of the three elements come together.
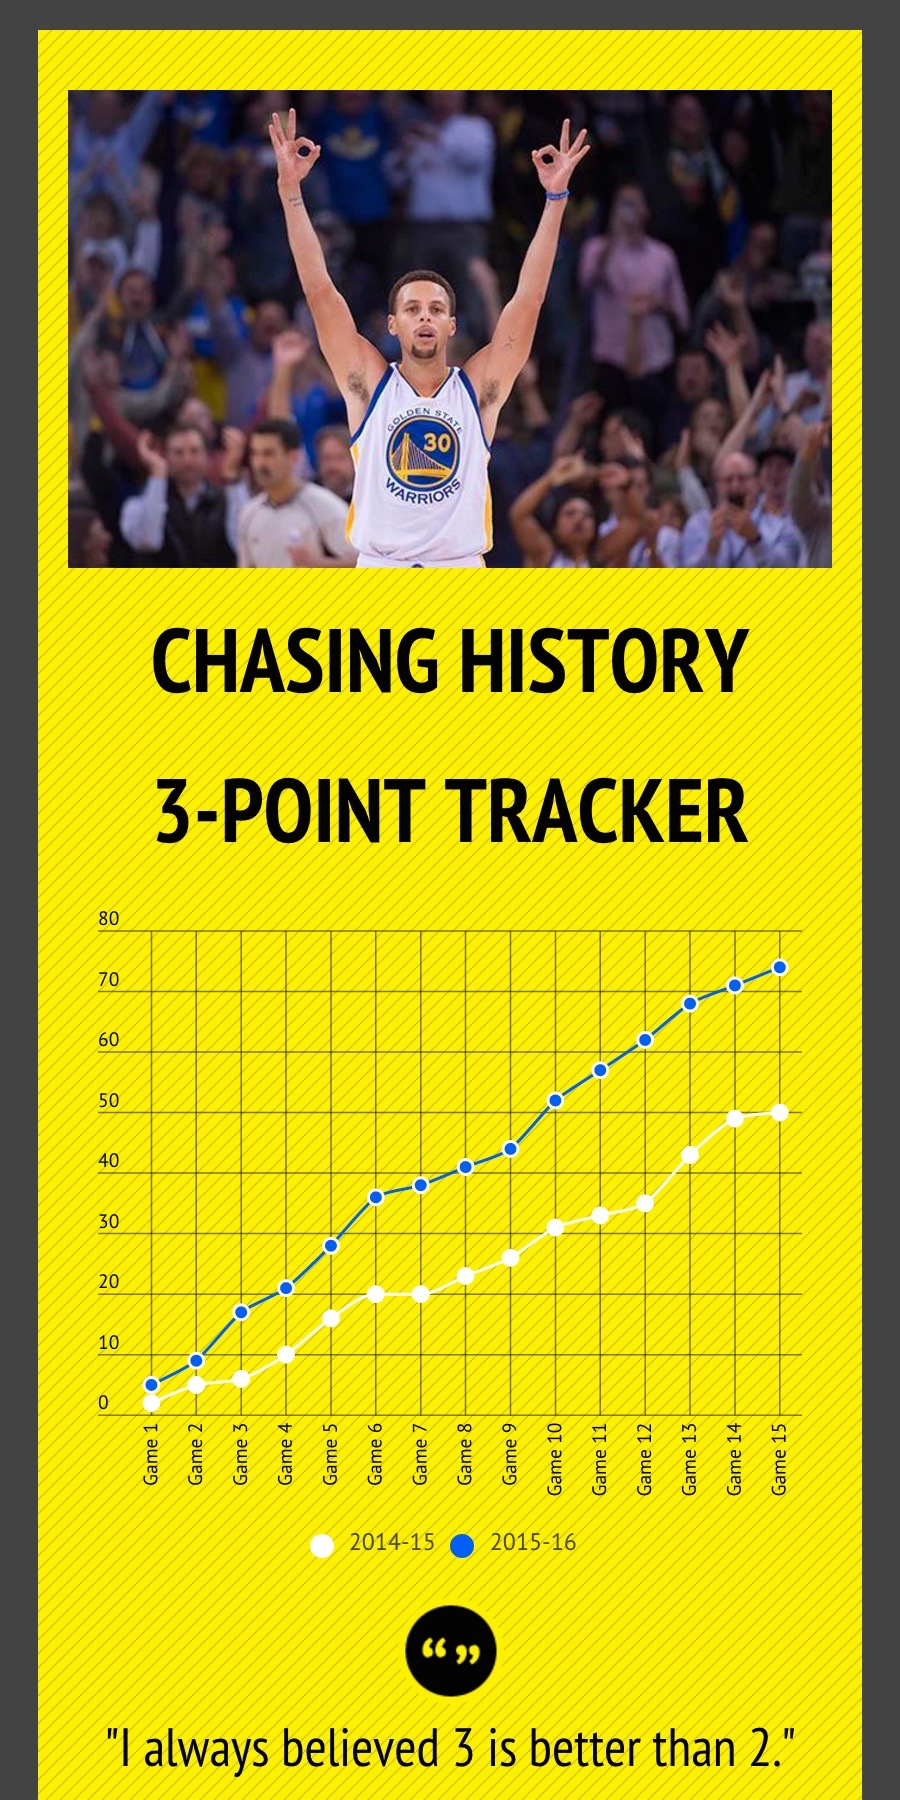
The retouched headline is designed to have students ask “How many 3-pointers will Stephen Curry make this season?” There are related questions: “At what pace (rate) is Curry making 3-pointers? What makes this pace historically ridiculous? What’s the difference between a historically ridiculous pace and a ridiculously historic pace?”
Here’s the thing about historic paces: historically, they happen weekly.
Act 2
I retouched the first sentence in the article to open things up a bit. Pre-edit: “We’re nearly through 20 percent of the 2015-16 season…” Only the number of 3-pointers made to date (74) is needed. We don’t need to know the number of games played to date (15) or the number of games played in an NBA season (82). That’s the point of percent: fanatical comparison to 100. (I wonder if students would ask for this superfluous information anyway.) Post-edit, this information might, in fact, be useful to know. And help draw out multiple strategies. Perhaps students will ask for a fraction, rather than a percent, to fill in the blank. Games played and 3-pointers made to date can be determined from the following graph:
I cropped the infographic because it resolves an extension (see it from the waist down below). And because it’s too damn long.
Act 3
The article suggests two possible extensions: “How many 3-pointers does Steph Curry need per game remaining to reach 300? How many games will this take?”
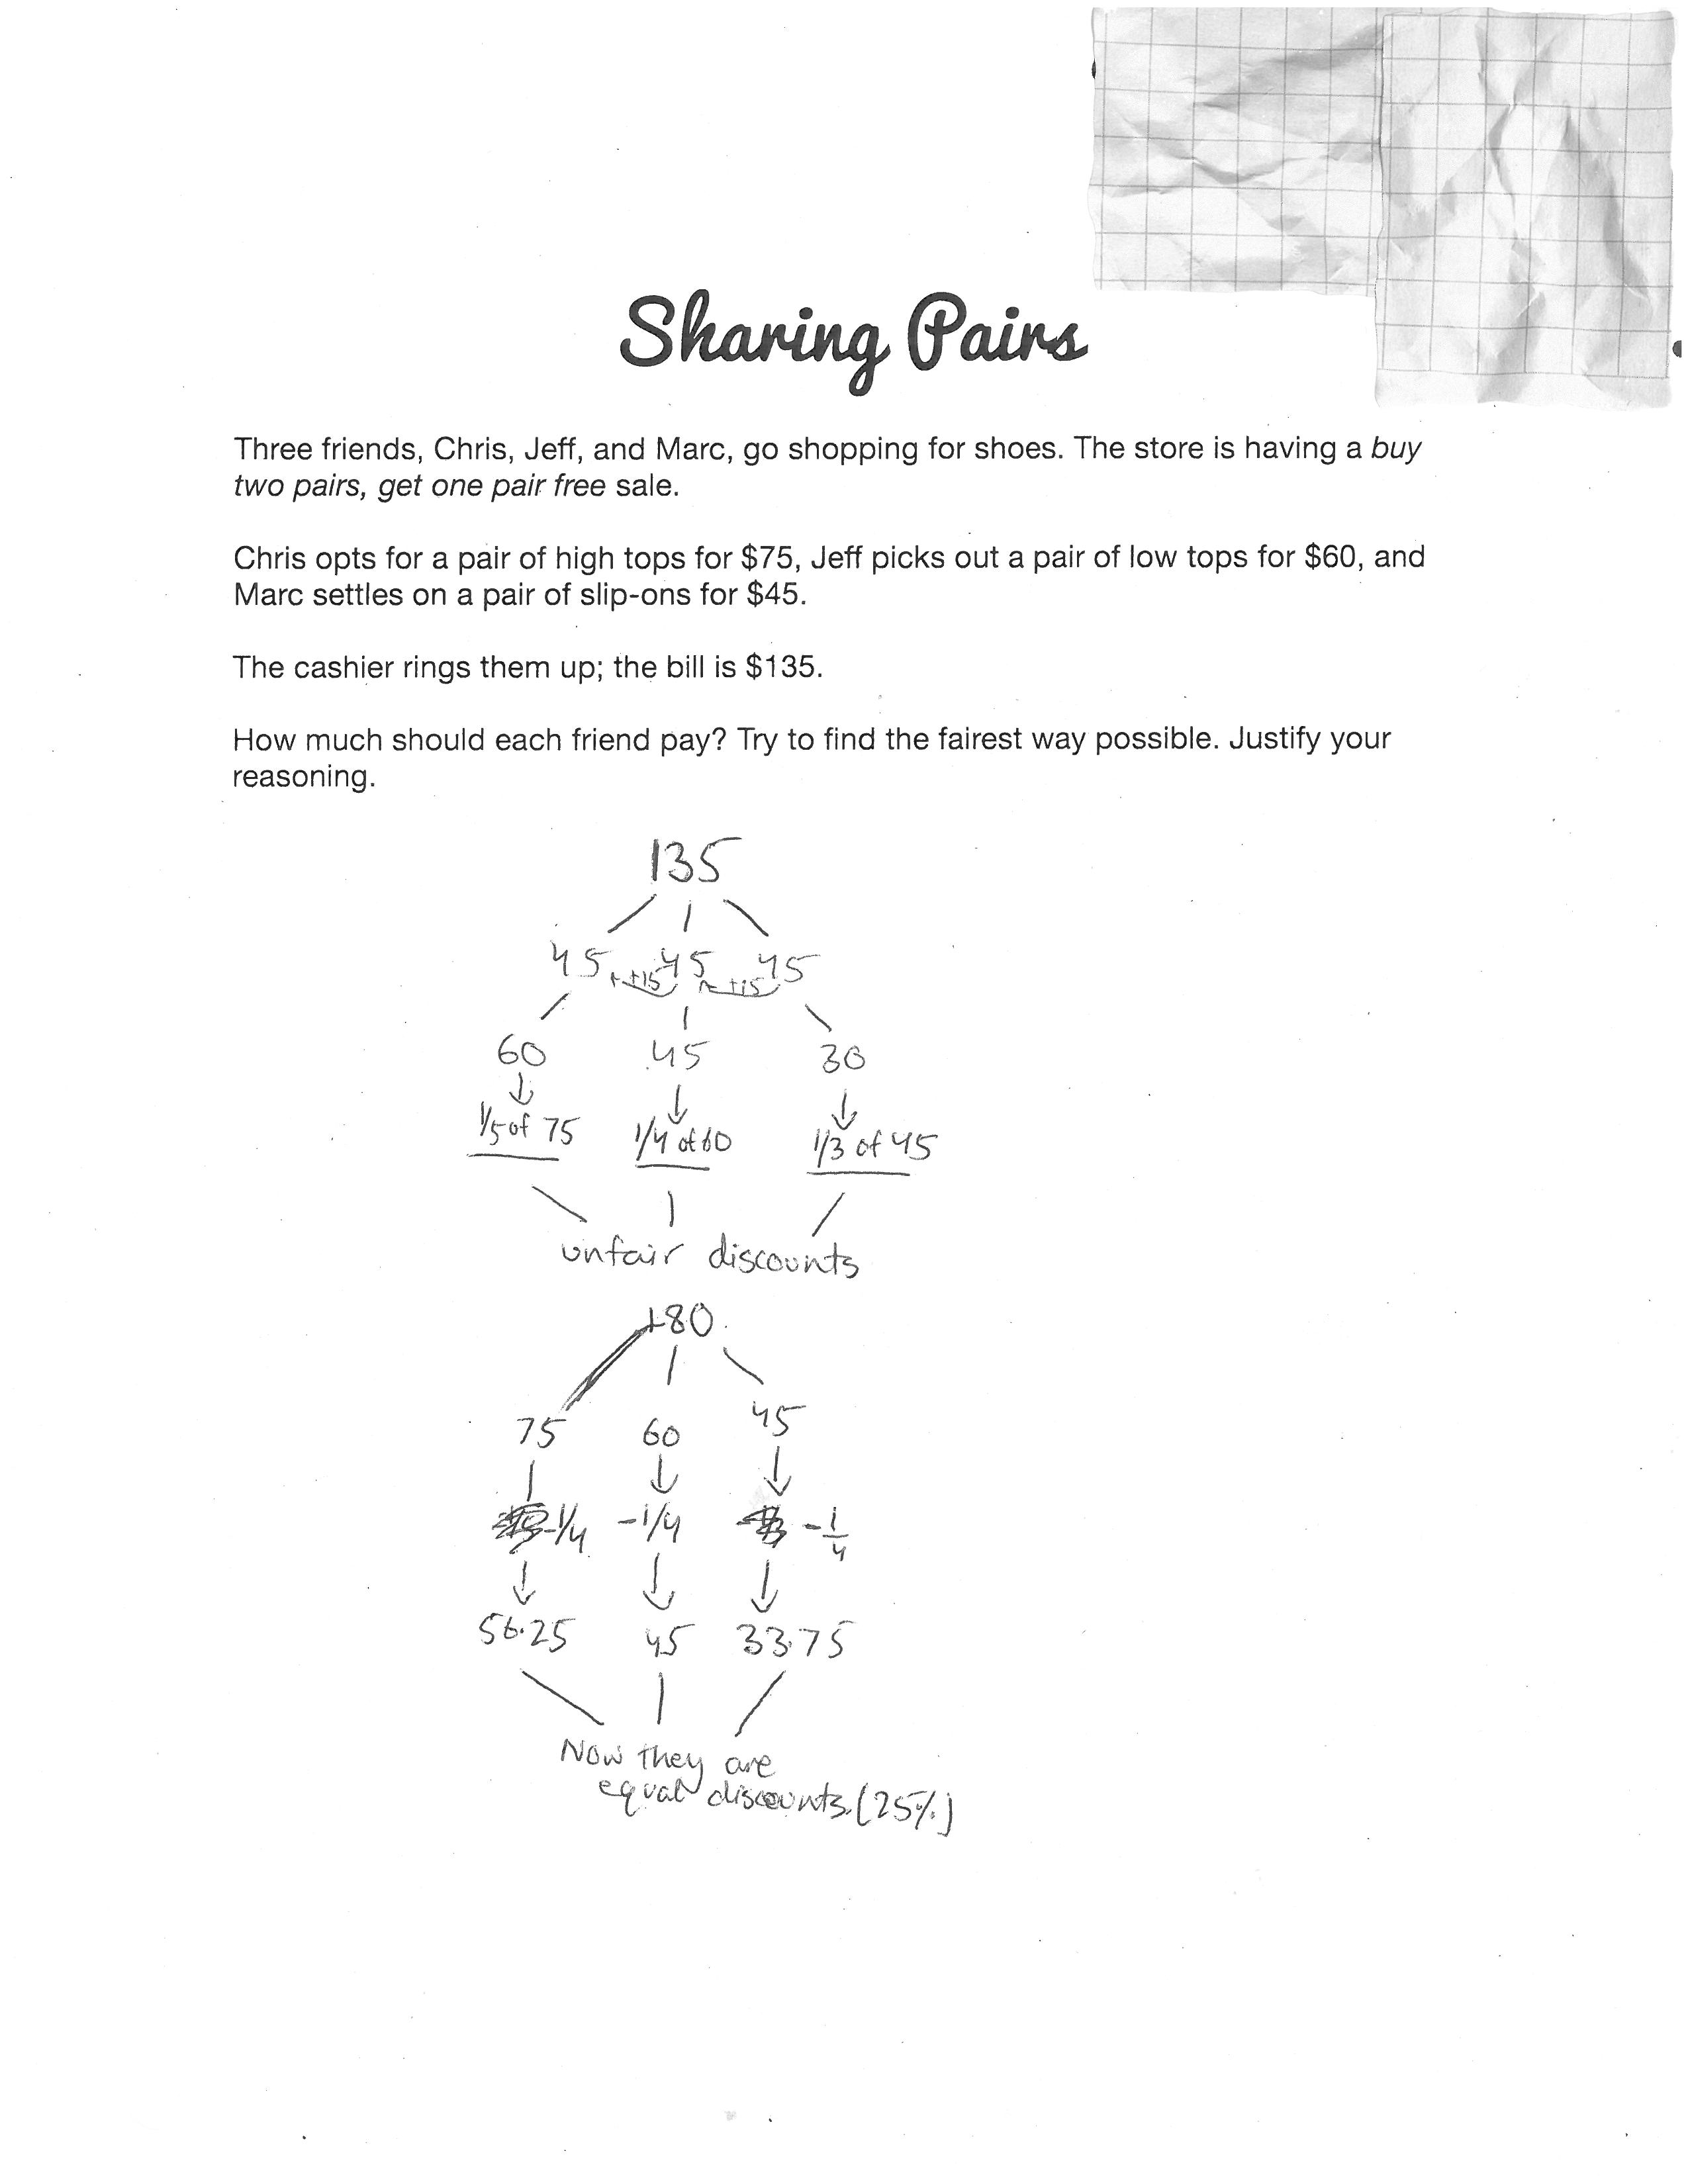
I had a chance to test drive this task in a Math 9 class. I asked students to solve the problem in small groups and record their possible solutions on large whiteboards. Later, each student recorded his or her fairest share of them all on a piece of paper. If you’re more interested in sample student responses than my reflections, scroll down.
The most common initial approach was to divide the bill by three; each person pays $45. What’s more fair than same? I poked holes in their reasoning: “Is it fair for Marc to pay the same as Chris? Why? Why not?” Students notice that Chris is getting more shoe for his buck. Also, Marc is being cheated of any discount, as described by Student A. (This wasn’t a happy accident; it’s the reason why I chose the ratio 5:4:3.)
Next, most groups landed on $60-$45-$30. Some, like Student A, shifted from equal shares of the cost to equal shares of the discount; from ($180 − $45)/3 to $45/3. Others, like Students B, C, and D, arrived there via a common difference; in both $75, $60, $45 and $60, $45, $30, the amounts differ by $15. This approach surprised me. Additive, rather than multiplicative, thinking.
Student C noticed that this discount of $15 represented different fractions of the original prices; $15/$75 = 1/5, $15/$60 = 1/4, $15/$45 = 1/3. He applied a discount of 1/4 to all three because “it’s the middle fraction.” Likely, this is a misconception that didn’t get in the way of a reasonable solution.
Student D presented similar amounts. Note the interplay of additive and multiplicative thinking. She wants to keep a common difference, but changes it to $10 to better match the friends’ discounts as percents.
Student E applies each friend’s percent of the original price to the sale price. This approach came closest to my intended learning outcome: “Solve problems that involve rates, ratios and proportional reasoning.”
In spite of not reaching my learning goal, I think that this lesson was a success. The task was accessible yet challenging, allowed students to make and justify decisions, and promoted mathematical discourse.
Still, to increase the future likelihood that students solve this problem using ratios, I’m wondering about changes I could make. Multiples of 20 ($100-$80-$60) rather than 15 ($75-$60-$45)? Different ratios, like 4:3:2 or 5:3:2, might help; the doubles/halves could kickstart multiplicative thinking. (Also, 5:3:2 breaks that arithmetic sequence.)
Or, I could make changes to my questioning.
When I asked “What do you notice?” students said:
the prices of the shoes are different
Chris’ shoes are the most expensive
Marc’s shoes are the cheapest
Chris’ shoes are $15 more than Jeff’s, which are $15 more than Marc’s
Jeff’s shoes are the fugliest
Maybe I could ask “What else could you say about the prices of Chris’ shoes compared to Marc’s?” etc. to prompt comparisons involving ratios. If that fails, I’m more comfortable connecting ratios to the approaches taken by students themselves than I am forcing it.
So to determine the best buy, I couldn’t just double. I use that strategy all the time; it’s my Frank’s RedHot. The exclamation point is there because I think that 20 leads to more strategies than 24. (Some of) these strategies are listed in my 5 Practices monitoring tool below. I’m curious if you think that I have anticipated likely student responses correctly. What incorrect strategy could I have anticipated? I wonder how you’d purposefully sequence these responses during the discussion.
More than SWBAT solve problems using unit rates, I want my students to recognize that there are many ways to solve rate problems and understand that we can easily compare rates with one term the same. This big ideas connects the strategies. In the fourth strategy above, we can think of 24 cans as a unit. Call it a “two-four” (Is that just a Canadian convention?) or a “flat” (Are we cool with calling the Pepsi cube a flat?). In fact, Save-On-Foods wants us to think of 24 as one; we’re encouraged to buy two packs of 12, a composed unit. For this task, I’d prefer that they didn’t, so I went back to the store and found this:
Comparing 20 packs with 15 packs is more likely to lead to common multiples than comparing 20 packs with 24 packs as above. Numbers matter. There’s this, but it doesn’t get us a clear winner:
Last week, Keith Olbermann named the Canucks’ Tom Sestito “World’s Worst Person In Sports.” In a game against the Kings, Sestito racked up 27 penalty minutes. His total ice time for the night? One second.
27:00 to 0:01 is an impressive stat. It’s hard to imagine this being surpassed. Sure, twenty-seven minutes can be topped. Randy Holt holds the NHL record for most penalty minutes in one game (67). The NHL record for most penalties in one game (10) belongs to Chris Nilan. But to do so in one second?! Inconceivable.
“I’d describe [Sestito] as a hockey player except he’s not,” Olbermann says. To make this point, he goes on to compare Sestito to Gretzky. That’s right: “The Great One” is his hockey player/”boxing hobo on skates” referent. In 101 games, Sestito had scored 9 goals, 885 shy of Gretzky’s record. Olbermann notes that Sestito would have to play about 10 000 games, or 123 seasons, to break the NHL record. Well, yeah, assuming he can keep up this pace.
I considered giving this the three-act treatment and bleeping Olbermann. But “When will Sestito break Gretzky’s record?” is not the first question that comes to your mind, is it? A more natural question re: Sestito might be “How many seasons would Sestito have to play to break Dave “Tiger” Williams’ record of 3966 career PIMs?” Apples to apples.
Olbermann, 54, followed this up by feuding with Tom Sestito’s sister, 13, on Twitter. Nice use of a unit rate by the kid: