OoO: Four 4’s

Back in late July, the call went out to the mathtwitterblogosphere to share first day/week activities. Since late July isn’t even the halfway point of my summer vacation, I resisted the urge to blog at that time. Instead, I lurked and reflected. A month later I received an email from a colleague asking for some first day ideas. In this post I’ll share one of those ideas.

It’s common for middle/high school teachers to begin the year by reviewing order of operations. The thought here is that a mastery of OoO within arithmetic is necessary for student success in algebra. I’m not convinced (see Timon’s post).

On Day 1, I’d often overhear a student say “What a geek! He’s got a math clock.”

Taking advantage of this, I’d ask students to find expressions for the numbers 1 to 12 using four 4’s and mathematical symbols (+, −, ×, ÷, brackets, decimal point). If I were to start the year with OoO, the the four 4’s puzzle would be an improvement on the BEDMAS worksheet. Each student can contribute something and gain confidence by solving the problem. This is important on Day 1 (and Day 93). Multiple solutions are shared and appreciated.

By giving students a target number, rather than an expression, the need for a rule to clarify ambiguity arises. It becomes more than a mnemonic to memorize. For example, students may present the first expression below as a solution to target numbers of 3 or 9:
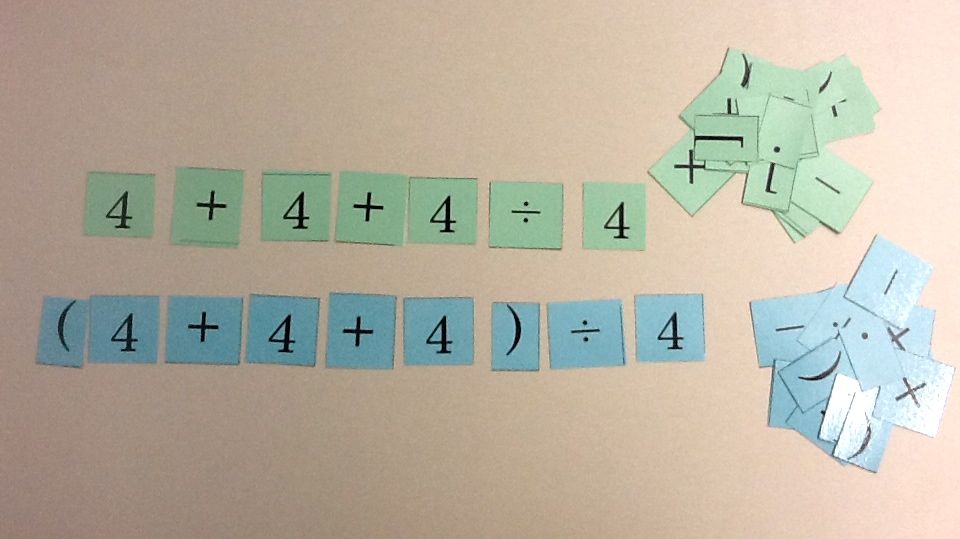
(I’m not sure if these add anything to this activity, but if you want these cards, here they are: Four 4’s)

Last year, I wrote

I’m just not able to lecture students for 75 minutes about consequences of unexcused absences, procedures for handing in homework, and lists of food & drink items that are acceptable to have in the classroom. Imagine sitting through this four times on Day 1. Welcome back!

On a personal note, I hope that Gwyneth is as excited about the first day of Grade 12 as she was about the first day of Grade 2 (and Kindergarten). I hope that she’s doing math on Day 1 (and Day 93).

Gwyneth Day 1 of Grade 2
Gwyneth Day 1 of Kindergarten

Building Capacity

This week, we spent one day with 15 math teams (almost 50 teachers and administrators) from 15 elementary schools in Surrey. (I’ll blog about this project soon.) Part of this day was  devoted to having teachers work together to solve problems. These problems help set the stage for some of the important themes schools will be exploring by participating in this project over three years. These include:

  • conceptual understanding
  • concrete, pictorial, and symbolic representations
  • use of manipulatives
  • communication
  • connections between mathematical ideas
  • learning and teaching through problem-solving
  • multiple solutions
  • reasoning
  • attitudes and self-confidence

We gave the following problem, from Figure This!:

Take two identical sheets of paper (8½ inches by 11 inches). Roll one sheet into a short cylinder and the other into a tall cylinder. Does one hold more than the other?

A common misconception is that the two cylinders hold the same because the two pieces of paper are the same size. Teachers use a variety of strategies to explore the relationship between surface area and volume.

The first approach most teams take is to calculate the volume of each cylinder. They’ll ask for (or google!) formulas. Even after determining the volume of each cylinder, many will remain unconvinced. Prompted with “How might young children solve this?” teachers will fill each cylinder with manipulatives available at their tables and compare the results, similar to the third act of Dan Meyer’s Popcorn Picker or John Scammell’s Surface Area vs. Volume.

One of the things that I enjoy most about posing these problems to teachers is that each time someone will come up with a solution that I haven’t seen before. For example, this week one team solved this problem by solving a simpler problem. That is, they compared rectangular prisms. (Is ‘squarular prism’ a thing? It should be.)

They argued that the conclusion would be the same but the calculations would be easier. They found a way around the formulas V = πr²h and C = 2πr. True problem-solving!

Part of me geeks out at seeing innovative solutions. The other part of me kicks himself for not making this a bigger part of my own classroom. A lot of missed opportunities– maybe one day I’ll get a do-over.

Math Picture Book Post #1: Cats’ Night Out

My background is in secondary, but I have spent the majority of the past two years in elementary. This blog hasn’t always reflected that shift. This year, I plan to blog more about my experiences teaching math in K-7.

Often, I use picture books to launch math lessons. Picture books allow teachers to leverage literature-based methodologies. The plan is to make this a series of posts.

I classify math picture books into three categories:

  1. mathematics is explained
  2. mathematics is weaved into the storyline
  3. mathematics is hidden

Books in the first category are, by and large, horrible. The reader is told that learning a particular mathematical concept is important and this concept is explained. Sometimes, art imitates life and a teacher-like character explains a topic to student-like characters. That’s just cheating.

There are some great picture books in the second category. In these books, math (not the characters’ learning about math) is central to the story. For example, in Bean Thirteen by Matthew McElligott, divisibility is introduced when the characters don’t want to get stuck with the unlucky thirteenth bean. In If a Chicken Stayed for Supper by Carrie Weston, part-part-whole relationships are explored when each fox counts the others and concludes someone is missing. Often, these books provide more questions than answers.

Books in the third category are the most difficult (and most rewarding– think #anyqs) to find. In these books, the author did not set out to write a math book. You won’t find these books in the math section of your local independent bookstore. But the math is there if the reader looks at the story through a mathematical lens. (More on this later.)

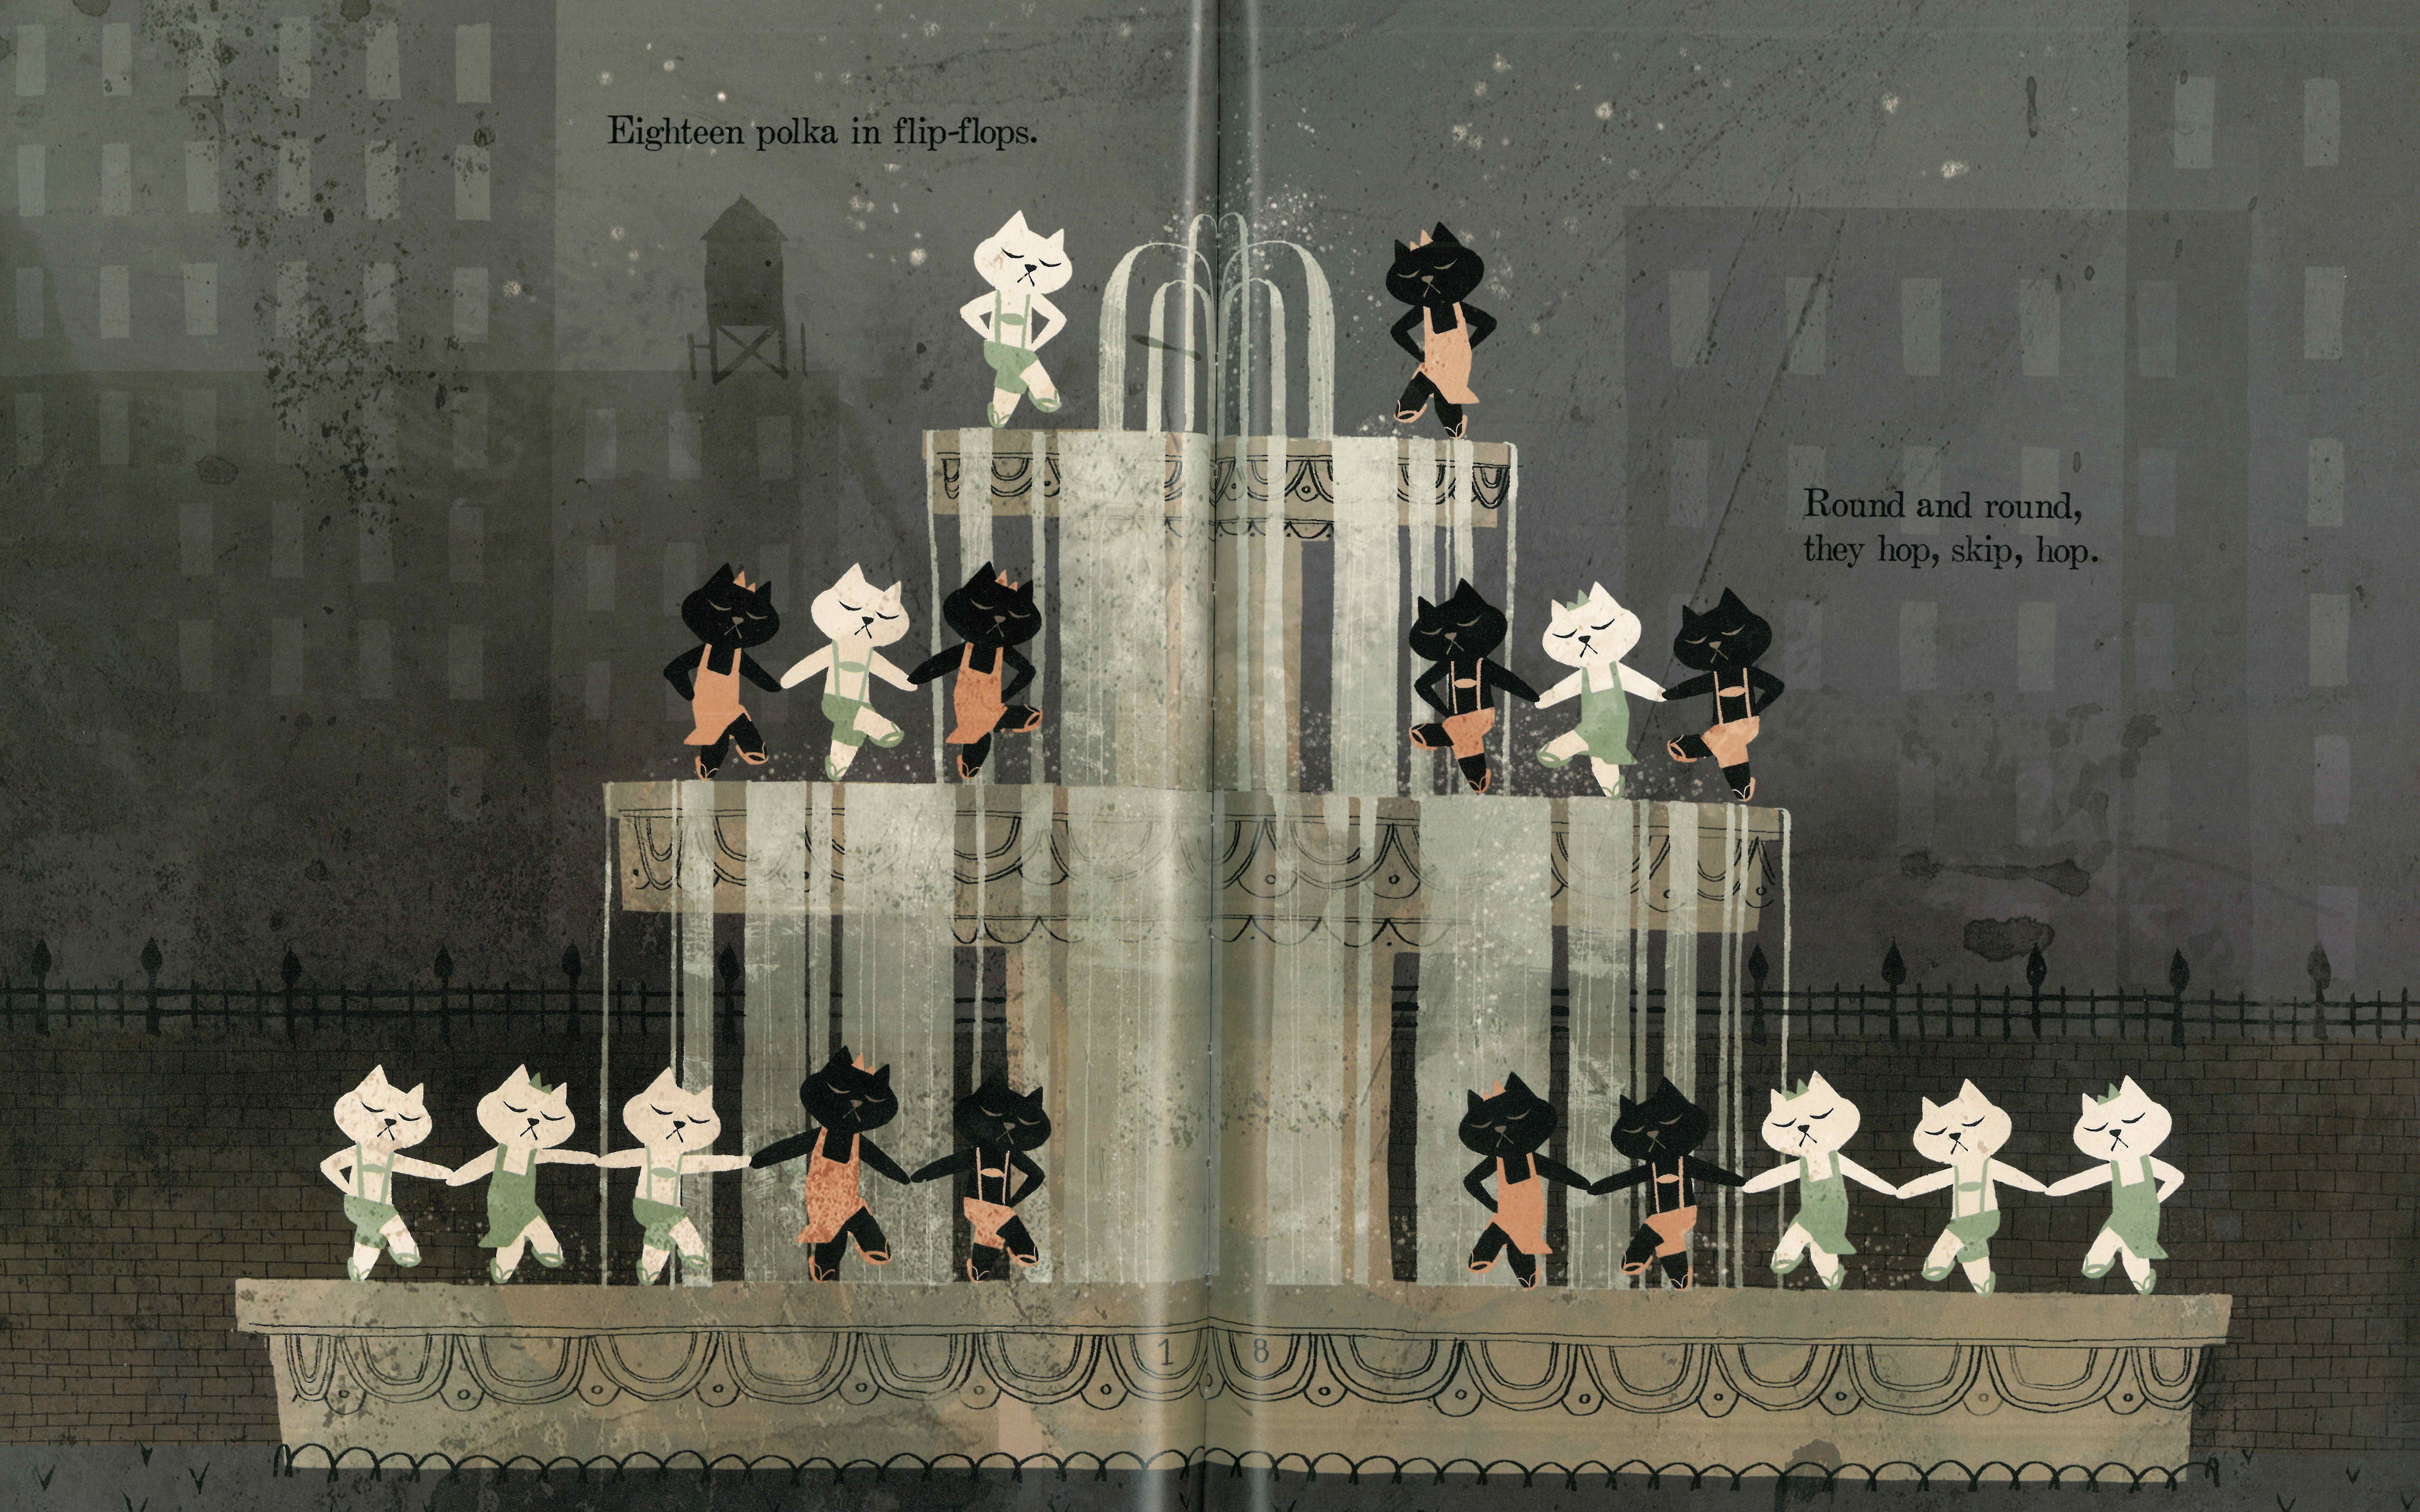
This week’s math picture book is Cats’ Night Out by Caroline Stutson. I’d place it in the second category. It’s a counting book and that might stretch your idea of ‘storyline’. (That’s fine.) Counting by twos from two to twenty, each page is illustrated with cats dancing in the city. Here are the pages for eighteen:

How did you see 18? I first saw 9 on each page (5 and 3 and 1). Students could draw their own pictures of doubles on folded paper. Also, on the two pages there are 9 white cats and 9 black cats. Kids will find two 9s in other places. There are 9 cats with bows and 9 cats without. Doubles can also be seen in rows across the pages. For example, double 5 can be seen across the bottom row. The use of doubles is a strategy for mastering addition (and multiplication) facts.

These 10 cats can be seen in another way. There are 6 white cats and 4 black cats across the bottom row. Students could be asked to find ways of making a different number of cats or different pages could be copied and students could look for different part-part-whole relationships. This, too, helps students master addition facts. For example, 9 + 3 can be thought of as 9 and 1 makes 10 and 2 more is 12; 6 + 7 can be thought of as double 6 makes 12 and 1 more is 13.

My love of card stock and the laminator has been well-documented. For teachers wanting to use pictures of these cats, here you go: Cats’ Night Out Cats (Large) & Cats’ Night Out Cats (Medium)

Counting Nonsense

I’m a sucker for counting without counting– from subitizing in kindergarten to combinatorics in grade 12.

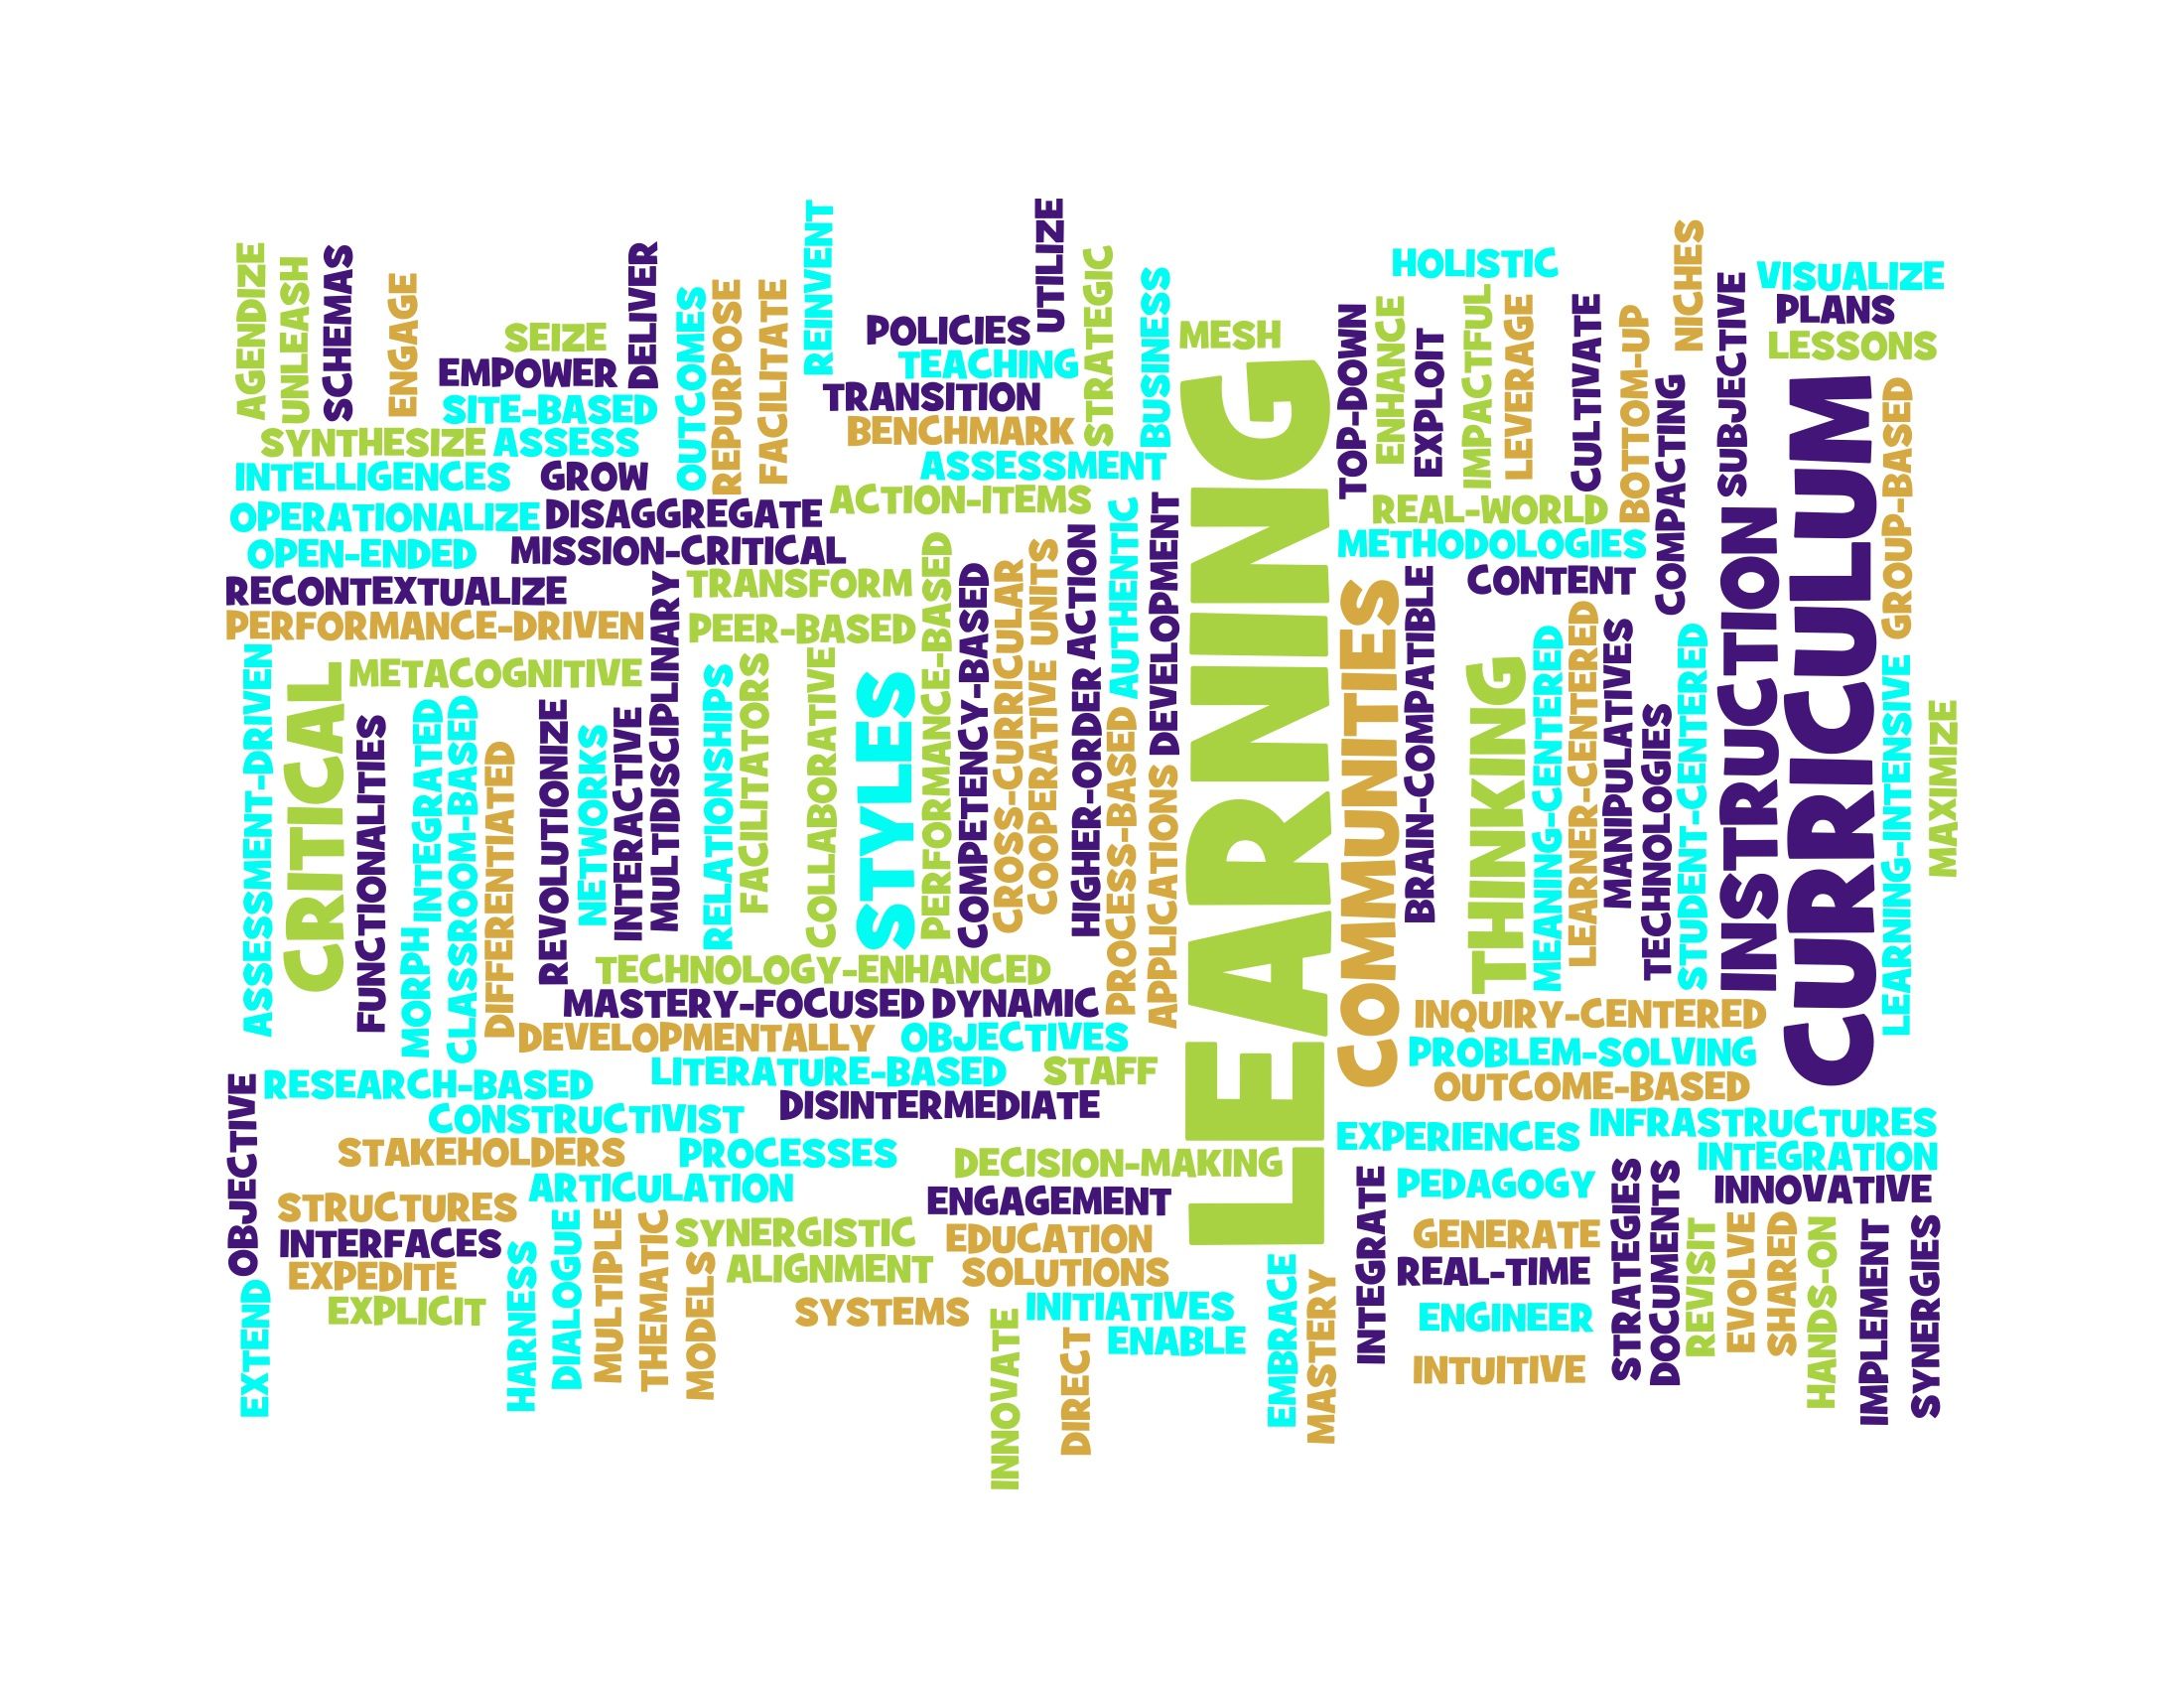
I was recently sent the link to an education jargon generator.

The first question that came to my mind was “How many different phrases are there?” To determine the number of possibilities for a task, we multiply the number of choices for each stage of the task. Phrases are generated by stringing together a verb, adjective, and noun. There are 53 choices of verbs, 65 choices of adjectives, and 66 choices of nouns. So, there are 53 × 65 × 66 = 227 330 “finely crafted phrases of educational nonsense.”

The teacher who posted the education jargon generator writes “I would be remiss if I did not thank my district’s professional development staff for introducing me to many of these gems.” Hah!

Wait! I resemble this remark. I’ve been prepping three all-day workshops that my team and I are facilitating giving this week. While I do use many of these words individually, I hope that I get called on it if I ever string three of them together, be it in person or on this blog.

Teaching “Believees”

From Louis C.K.’s Live at the Beacon Theater (expletives, and humour, deleted):

I have a lot of beliefs and I live by none of them. That’s just the way I am. They’re just my beliefs, I just like believing them. I like that part. They’re my little “believees,” they make me feel good about who I am, but if they get in the way of a thing I want, I do that.

beaconI’ve been thinking about teaching believees.

“Mistakes are opportunities to learn.”

“Students need to be comfortable taking intellectual risks.”

Warm fuzzies. Cheezy posters.

- Chris Hunter
CHRIS HUNTER

And then…

“Fifteen percent of your grade will be based on homework.”

Doesn’t exactly encourage students to make and correct errors or take risks, does it?

“Struggle is a necessary part of learning.”

“Problem solving builds perseverance.”

More warm fuzzies. More cheezy posters.

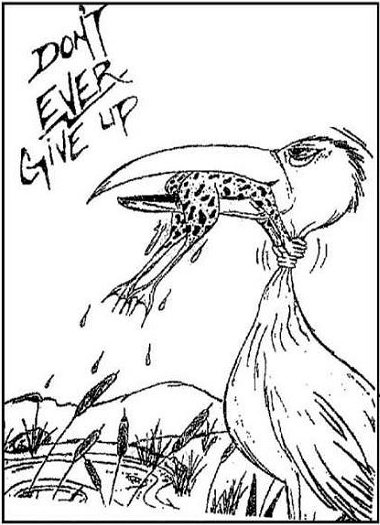
Don'tEverGiveUpAnd then…

Simplified, spoon-fed, step-by-step directions. Practice pretending to be problem-solving.

Why the vast disconnect? Do we really just like the believing part? It can’t be about things we want. Who wants to mark homework? Who wants to teach follow-the-recipe mathematics?

March 5, 2013: I wrote this post about six months ago but didn’t publish it; it seemed a tad negative. But it is a reminder to teach by my beliefs. So I guess there’s that.

Like Bono, I’m singing “We’re one, but we’re not the same”

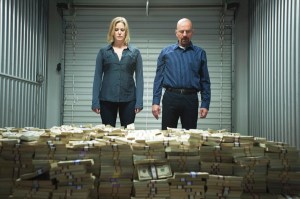
Today, the threat of an NHL lockout draws nearer. The league and its players have a pile of money and little regard for their customers. Kinda like these two:

Lockout or not, it is that time of year. Some hockey talk:

Well it’s too late tonight
To drag the past out into the light

In 2003, the Vancouver Canucks faced the Dallas Stars in the first round of the Stanley Cup playoffs. Canucks fans may remember the opening game of this series as the one in which Henrik Sedin scored the game-winning goal late in the fourth overtime period. They may also remember it as the most boring playoff series ever. Considering the series went 7 games and 3 games went to overtime, this was no easy feat. In the middle of the series, the final scores were 0-2, 2-1, 2-1, and 1-0. During this stretch, the colour commentator said something like “Turco has a save percentage of 0.960, but he’s gotta be frustrated because the guy at the other end [Luongo] is playing twice as good”. Luongo’s save percentage was 0.980¹.

This floored me. How can that be? We’re talking about a difference of only 2 percentage points. He must have made a mistake. Twice as good?

The answer lies in part-part-whole relationships. What if we focussed on the other part in this part-part-whole relationship, the goals against?

What if, rather than save percentages, goalies’ goals against percentages were discussed? Let’s abbreviate this as a goalie’s GAP. Heh. Seems fitting:

Turco’s GAP would be 0.040; Luongo’s 0.020. Yep. Harry Neale was right. A GAP of 0.020 is twice as good as a GAP of 0.040 since 0.020 × 2 = 0.040. Still, we’re talking about a difference of only 2 percentage points.

Is it getting better?
Or do you feel the same?

But wait. GAP is a unit rate. We’ve been talking about unit rates on this blog. Luongo’s GAP of 0.020 means 0.020 goals per one shot against (or 20 goals per 1000 shots against). This can also be expressed as one goal per 50 shots against (1/0.020 = 50). Turco’s GAP of 0.040, on the other hand (the left one), means 0.040 goals per one shot against. This can be expressed as one goal per 25 shots against. Let’s call this a goalie’s Shots Against per Goal, or SAG. Fifty versus 25 seems like a much bigger difference than 98 versus 96. Just visualize the bar graphs.

Did I disappoint you?
Or leave a bad taste in your mouth?

In Vancouver, the goalie controversy is proceeding to its logical conclusion.

For your consideration:

Roberto Luongo
Save Percentage (Sv%) = 0.919
Shots Against per Goal (SAG) = 1/(1 − 0.919) = 12.35

Cory Schneider
Save Percentage (Sv%) = 0.937
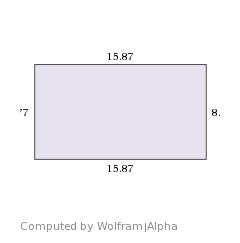
Shots Against per Goal (SAG) = 1/(1 − 0.937) = 15.87

Just for fun, here’s one more:

Dwayne Roloson
Save Percentage (Sv%) = 0.886
Shots Against per Goal (SAG) = 1/(1 − 0.937) = 8.77

Will it make it easier on you now?
You got someone to blame

Remember this guy? Let’s not go there.

¹Made up numbers. By me.

Hey, I just met you and I wanna rock your gypsy soul

Carly Rae Jepsen’s “Call Me Maybe” passed Van Morrison’s “Into the Mystic”.

I’m referring to my iTunes library, of course.

It wasn’t me. Meet the culprits:

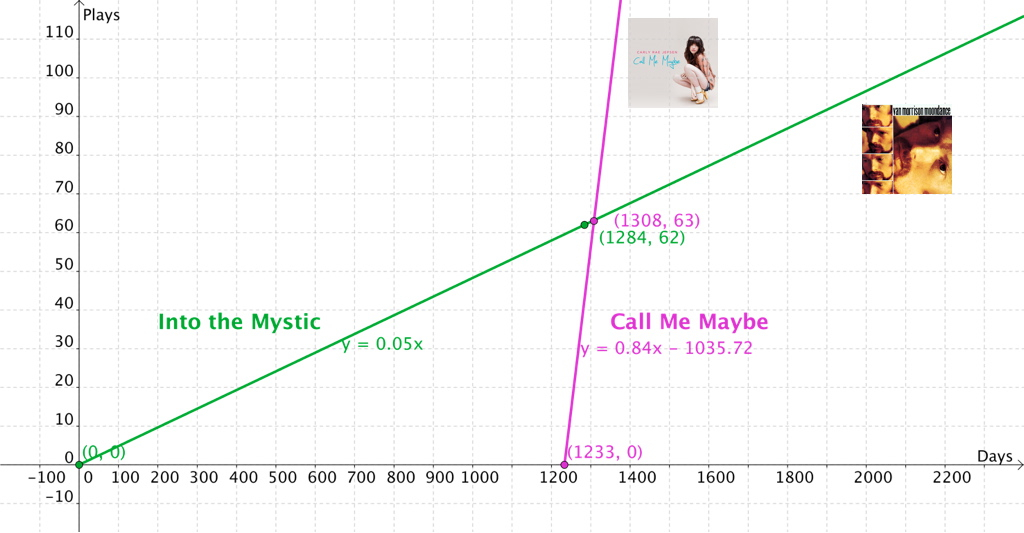
First, “Van the Man”. On October 13, 2008, I added “Into the Mystic” to my library (‘Date Modified’ in iTunes). I’m calling this t = 0. I’ve played it 62 times. I last played this “song of such elemental beauty and grace” 1284 days later on April 19, 2012.

Jepsen’s up next. “Call Me Maybe” was added (not by me) on February 28, 2012. This is 1233 days after I added “Into the Mystic”. Seventy-five days later, on May 13, 2012, I listened to this sugary pop tune for the 63rd time. This is 1308 days after adding “Into the Mystic”.

NB: Screenshots of the iTunes Summaries for both songs would make a better first act. Here’s the summary for “Call Me Maybe”:

My initial questions were:

  • When did this happen?
  • Could I have predicted this?
  • How will the number of plays compare in the future?

I modelled this situation using a system of linear equations. For the Irish singer-songwriter, we get p = 0.05d, where p is the number of plays and d is the number of days. For the Canadian Idol, we get p = 0.84d − 1035.72.

Comparing slopes is an obvious discussion topic. The line for “Call Me Maybe” is much steeper than the line for “Into the Mystic”; the rate of change is 0.84 plays/day versus 0.05 plays/day.

This problem can also be used to explore unit rates. Unit rates can be expressed in more than one way. It’s about what one is one.

I wanted to express the equation p = 0.84d − 1035.72 in the form − 63 = 0.84(d − 1233). Slope-point form tells a better story than slope-intercept form in this situation but my GeoGebra skills are rusty.

Having students look at their own iTunes libraries might make a better investigation than practicing solving catch-up problems like this:

I assumed that this situation could be modelled using linear relations. For “Into the Mystic”, fair enough. I think this reasonably approximates the real data. Outside of perhaps when I was commenting on Michael Pershan’s blog, I didn’t go through a Van Morrison phase. Van Morrison is in my wheelhouse and “Into the Mystic” is just in the rotation. The number of plays per day is (almost) constant.

For “Call Me Maybe”, this assumption is likely incorrect. The song’s got legs but the instantaneous rate of change has to be decreasing, right? For my mental health, I hope it is. That many plays would surely take its toll.

And what if Carly has competition?

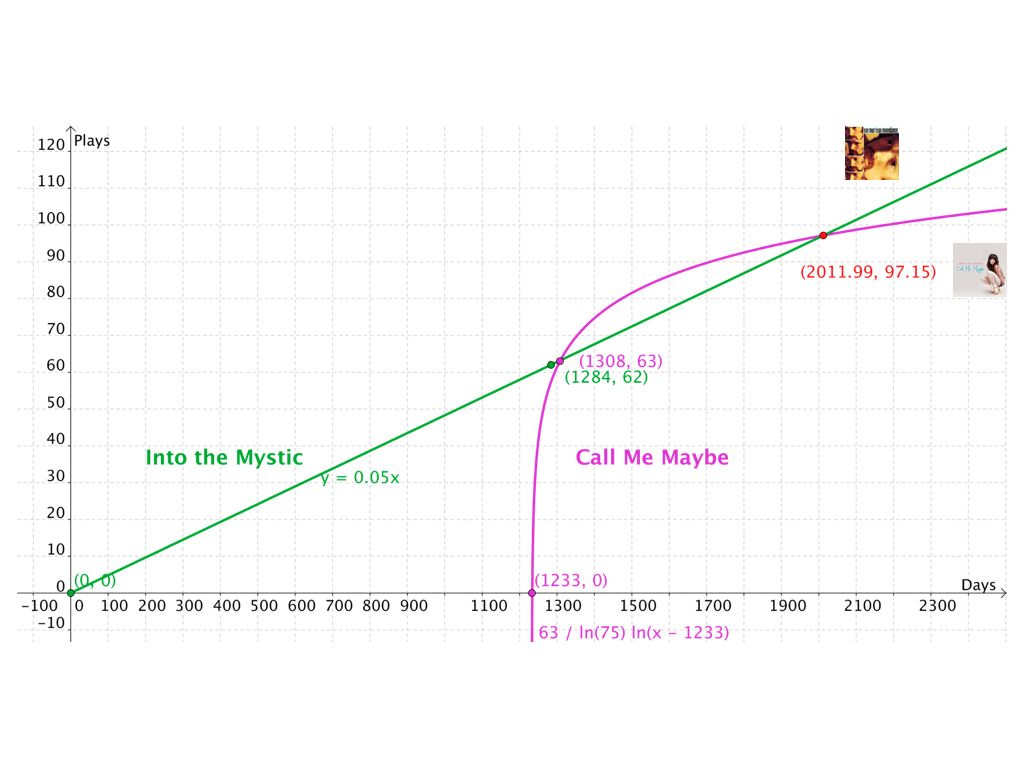
What if I modelled this using a logarithmic function? Check this out:

Note that ≈ 5½ years after first being added to my library, “Into the Mystic” can be expected to pass “Call Me Maybe”. The natural state of the universe is restored.

Update: I learned how to animate my GeoGebra construction. Also, I corrected a math mistake. (What was my misconception?)

Furry Logic

This is my favourite photo. It’s of my youngest daughter, Keira, and my dog, Skye, while on a walk this past spring. I said “Say cheese” and they did. Both of them. Unknown to me at the time, it would be the last picture I would take of Skye. In the next two weeks, Skye’s health rapidly deteriorated to the point where my wife and I had to make the difficult decision. It has been tough on all of us. I still catch myself holding the gate open for her behind me as I go between the front and back yard.

This has been particularly hard for my 7-year-old daughter, Gwyneth. She understands why we are not getting another dog. But that hasn’t stopped her from researching dog breeds on the internet. Non-stop. If you ever meet my daughter, she’ll ask you questions like “D’you know that Labrador retrievers have webbed feet for swimming?”, “D’you know that pugs have a hard time breathing because of their flat faces?” and “D’you know that poodles are hypoallergenic?” Think Jonathan Lipnicki in Jerry Maguire. She’s that kid. And I love her for it.

But this is my math blog…

The other day Gwyneth came to me to tell me she wasn’t happy about what she had read on JustDogBreeds.com. Here it is:

Did you catch what was troubling my daughter? Here’s two more:

Here’s our conversation, as I remember it¹:

Gwyneth: They say Golden Retrievers are the smartest. And they say Papillons are the smartest. But they also say Poodles are the smartest. Shelties too!

Me: So, what’s the problem?

Gwyneth: They can’t all be the smartest.

Me: So, what should it say?

Gwyneth: One of the smartest. Not the smartest.

The smartest means:

Golden Retrievers > Papillons
Papillons > Golden Retrievers

Not okay with Gwyneth.

One of the smartest means:

Golden Retrievers ≥ Papillons
Papillons ≥ Golden Retrievers

She’s cool with that.

At the same time as this conversation, Dr. Keith Devlin was writing about the use of language in the case against Lance Armstrong:

Though the layperson typically thinks of mathematicians as being focused on numbers, that is actually not the case. That false view is a consequence of the mathematics taught in high school. Only at university are you likely to encounter the mathematics done by the professionals. High among our real areas of expertise are logical reasoning, rigorous proof, and the precise use of language.

Maybe it’s because her dad is bothered by things like “increased student scores by 50%” when they mean “increased the number of students passing by 50%” that my daughter is concerned about the precise use of language. And I love her for it.

¹The Department of Giving Credit Where Credit is Due asks you to check out Christopher Danielson’s talking math with your kids posts.

Math in the Shark Tank

A recent “Shark Tank” episode featured two entrepeneurs pitching MiX Bikini, the world’s first interchangeable swimsuit. Here’s a sneak peek:

Two things piqued my interest.

Thing One: The Product

“It’s no secret women love to stand out, but there is nothing worse for [a] woman than being at the beach and seeing another girl in the same bikini,” one partner says.

Nothing? Really?

Here’s how it works:

First, assuming [a] woman is not offended by the claim above, she selects a style of bikini top (halter or triangle). Next, she chooses one of 40 colours/patterns for the bikini top. She does this twice (right and left). She then selects a style of bikini bottom (classic or ‘scrunchie’) and picks out one of 33 colours/patterns. (In the “Shark Tank” video, the second model switches out the back bottom. On the Mix Bikini website, the front & back of the bikini bottoms always match.) The bikini tops must be connected. Customers must choose between rings or strings. Rings are available in 10 colours, strings in 9. Of course, bikini tops also need neck strings (right and left). Double neck strings come in 9 colours, rings & strings in 10.

This begs the question… How many Frankenkinis (sp?) are possible?

The website advertises it is possible to create thousands of bikinis.

Thousands? Try millions.

What number do you get? What assumptions do you make? Is fuschia & leopard print different than leopard print & fuschia? I maintain it is. It is best that I not elaborate.

Thing Two: The Pitch

“We are seeking fifty thousand dollars in exchange for five percent of our business,” says the first partner.

“That means that you’re saying the company is valued at one million dollars,” says Daymond, one of the Sharks.

“It was ten percent we were asking,” interrupts the second partner.

“So half a million dollars,” Daymond clarifies.

Uh-oh. The budding businessmen are confused. Mathematically disoriented. The Sharks smell blood. SPOILER ALERT– all does not end well. How did this happen? What went wrong?

My guess? The Sharks have number sense. They have mental math strategies. Daymond understands 5% is equal to 1/20. Therefore, if 1/20th of the business is valued at $50 000, then the total value of the company can be calculated by multiplying by 20 (or, more likely, by doubling and multiplying by 10). If $50 000 is 10%, or 1/10th, of the company, then the Sharks can multiply $50 000 by 10 (or, more likely, halve $1 000 000, the original evaluation).

In the “Shark Tank”, the Sharks often counter with benchmark percentages– 5%, 10%, 25%, 50%, 75%. I suspect the Sharks have strategies for other popular percentages (eg, for 40% they may halve, halve, and multiply by 10).

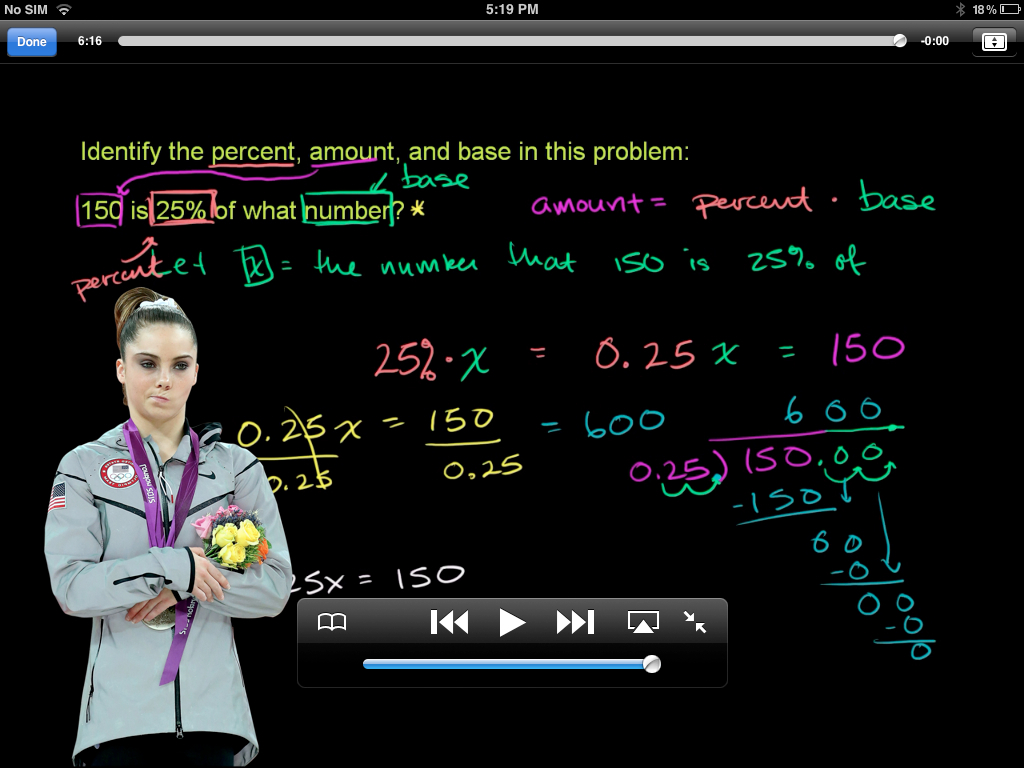
Our pitchmen, on the other hand, do not have number sense. They do not have mental math strategies. The bikini guys have procedures. The bikini guys have this:

BTW, if you’re looking for a lesson on combinations, check out Pair-alysis from Mathalicious.

A Deconstructed Learning Outcome: Sum of Its Parts

Maybe I’ve seen one too many deconstructed Caesar salad or peanut butter and jam sandwich on TV. Or maybe I’ve heard “This workbook covers the curriculum” one too many times¹.
 
Whatever my reason, I wanted to take a closer look at a learning outcome from the WNCP Math 8 curriculum document:
 
It is expected that students will demonstrate an understanding of multiplying and dividing positive fractions and mixed numbers, concretely, pictorially, and symbolically [C, CN, ME, PS]
 
“It is expected that students will”
It’s about students’ learning. Worked examples on the whiteboard or in a textbook may be evidence of the teacher’s or publisher’s learning.
 
“demonstrate an understanding of”
Not will be able to. Students need to make sense of mathematics. Justifications and explanations are required for answers and methods.
 
“multiplying and dividing positive fractions and mixed numbers”
This is a topic. Curriculum is more than a collection of these.
 
“concretely, pictorially, and symbolically”
No longer just suggested, the use of concrete materials (i.e., manipulatives) is prescribed² as is having students draw to represent their thinking (diagrams not decorations).
  
[C, CN, ME, PS]
From K to 12, seven processes are to be integrated within the learning of mathematics. The ‘C’, for example, means that students should be provided with opportunities to communicate their learning– to write about and discuss mathematical ideas.
 
¹ To my US reader(s)– in my province, curriculum is different than recommended learning resource (i.e., the textbook). In theory, the textbook is not the course. In practice…
 
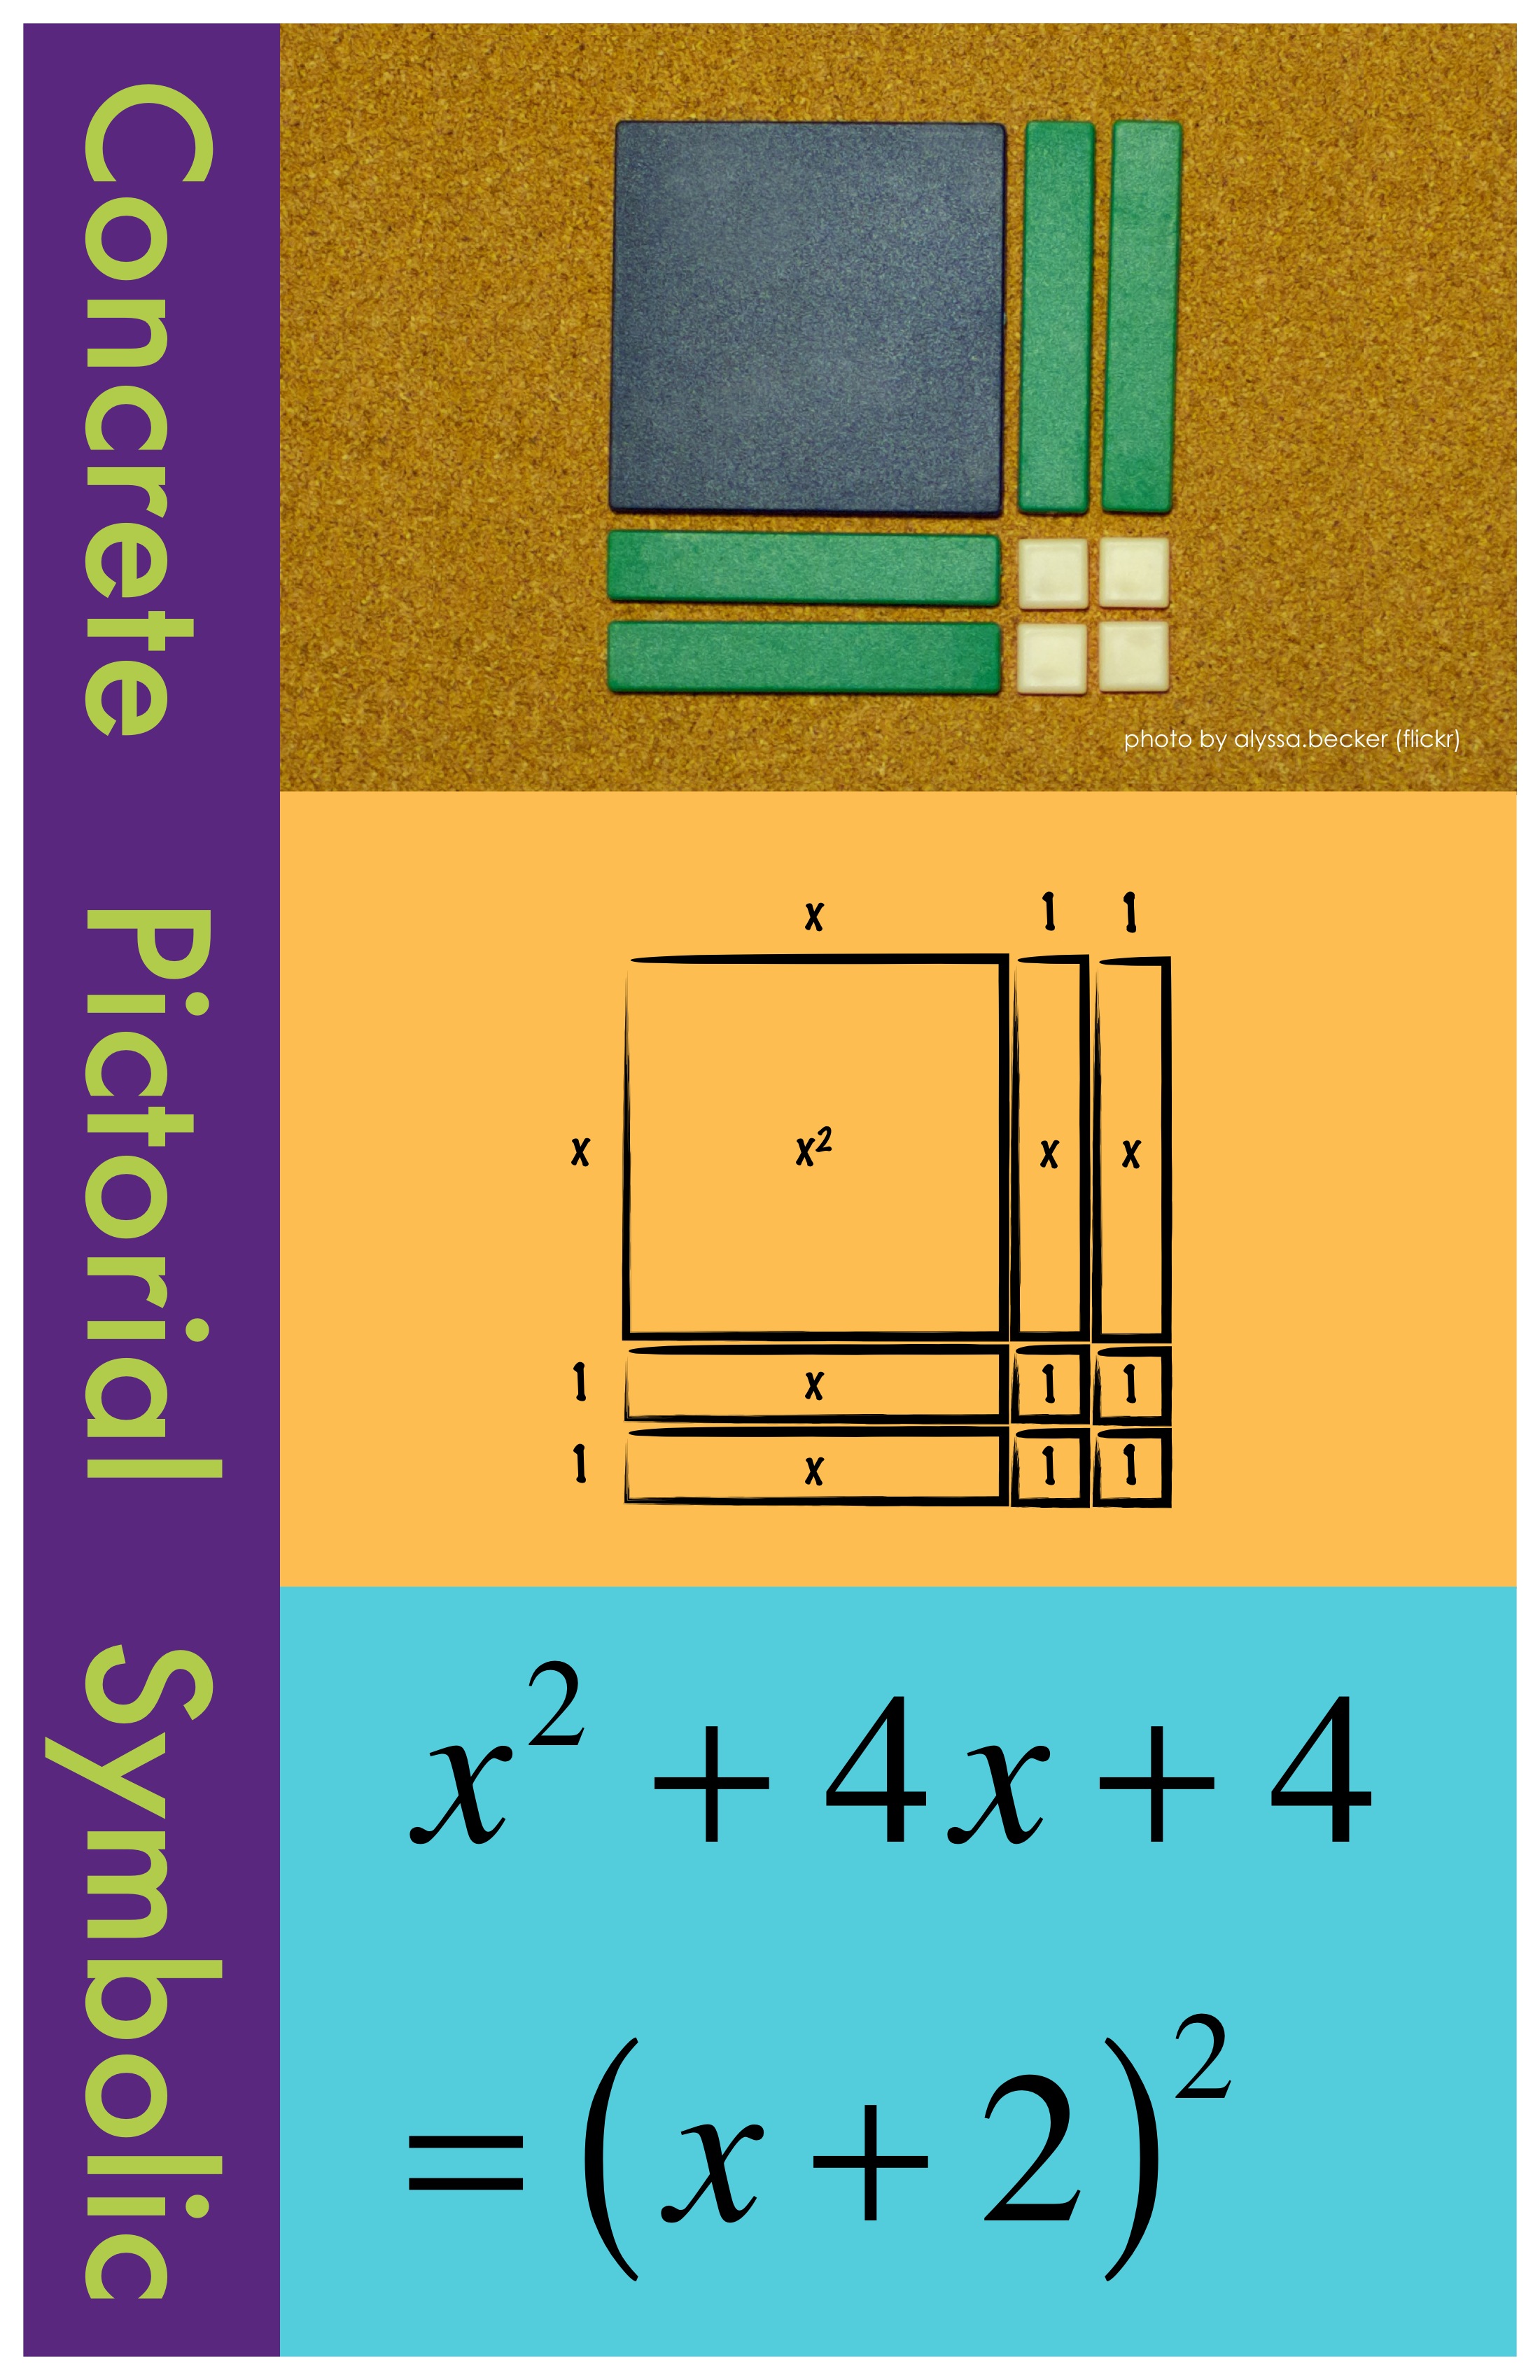
² For many teachers, this is probably the biggest change to the curriculum. Earlier this year, I created the posters below. My intent was to generate conversations among teachers, not to teach the concept. Plus, I got to be artsy-fartsy. Enjoy.
 

CPS Poster Algebra Tiles
CPS Poster Counters
CPS Poster Pattern Blocks
CPS Poster Toothpicks