Math Picture Book Post #5: 100 Snowmen

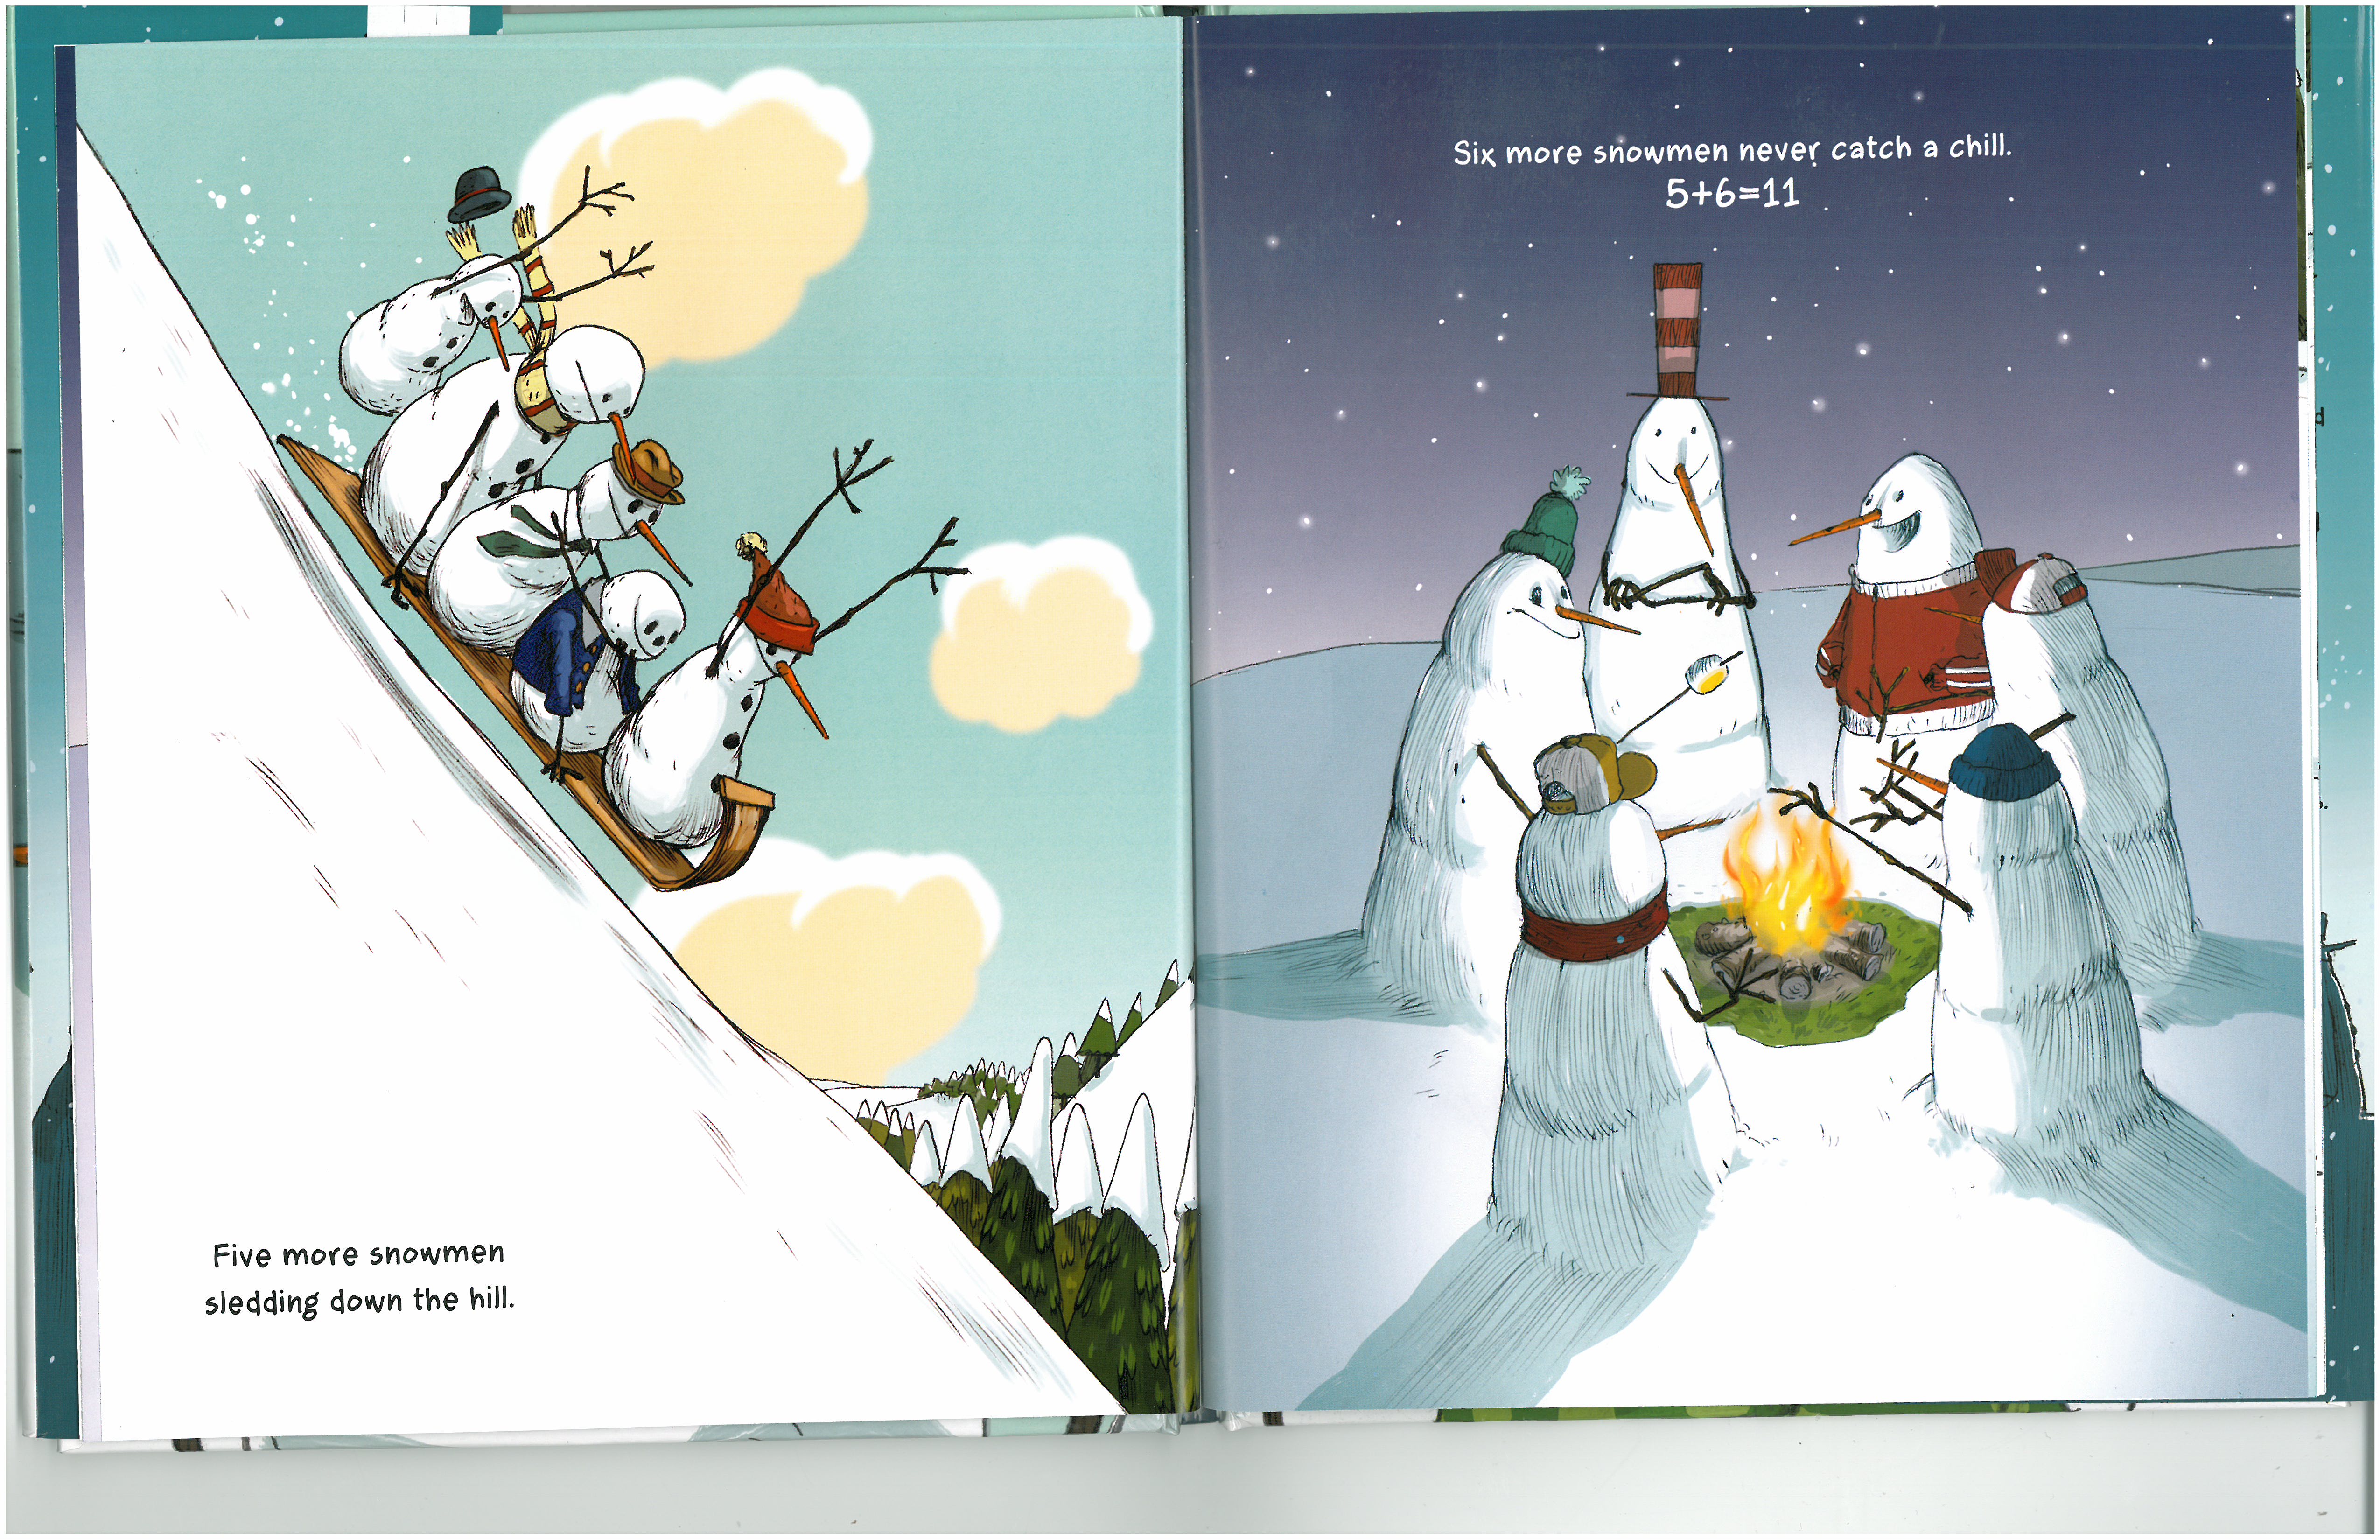
I’m not usually a fan of equations in math picture books. But I like 100 Snowmen by Jennifer Arena and Stephen Gilpin. On each page, students can use the mental math strategy of adding one to a double to determine basic addition facts to 19. Each number is represented as both a number to be doubled and one more than a number to be doubled. Take five. Here, students can double five and add one more to determine five plus six.

SDEC1-4124-13111414440
5 + 6 = (5 + 5) + 1 = 11

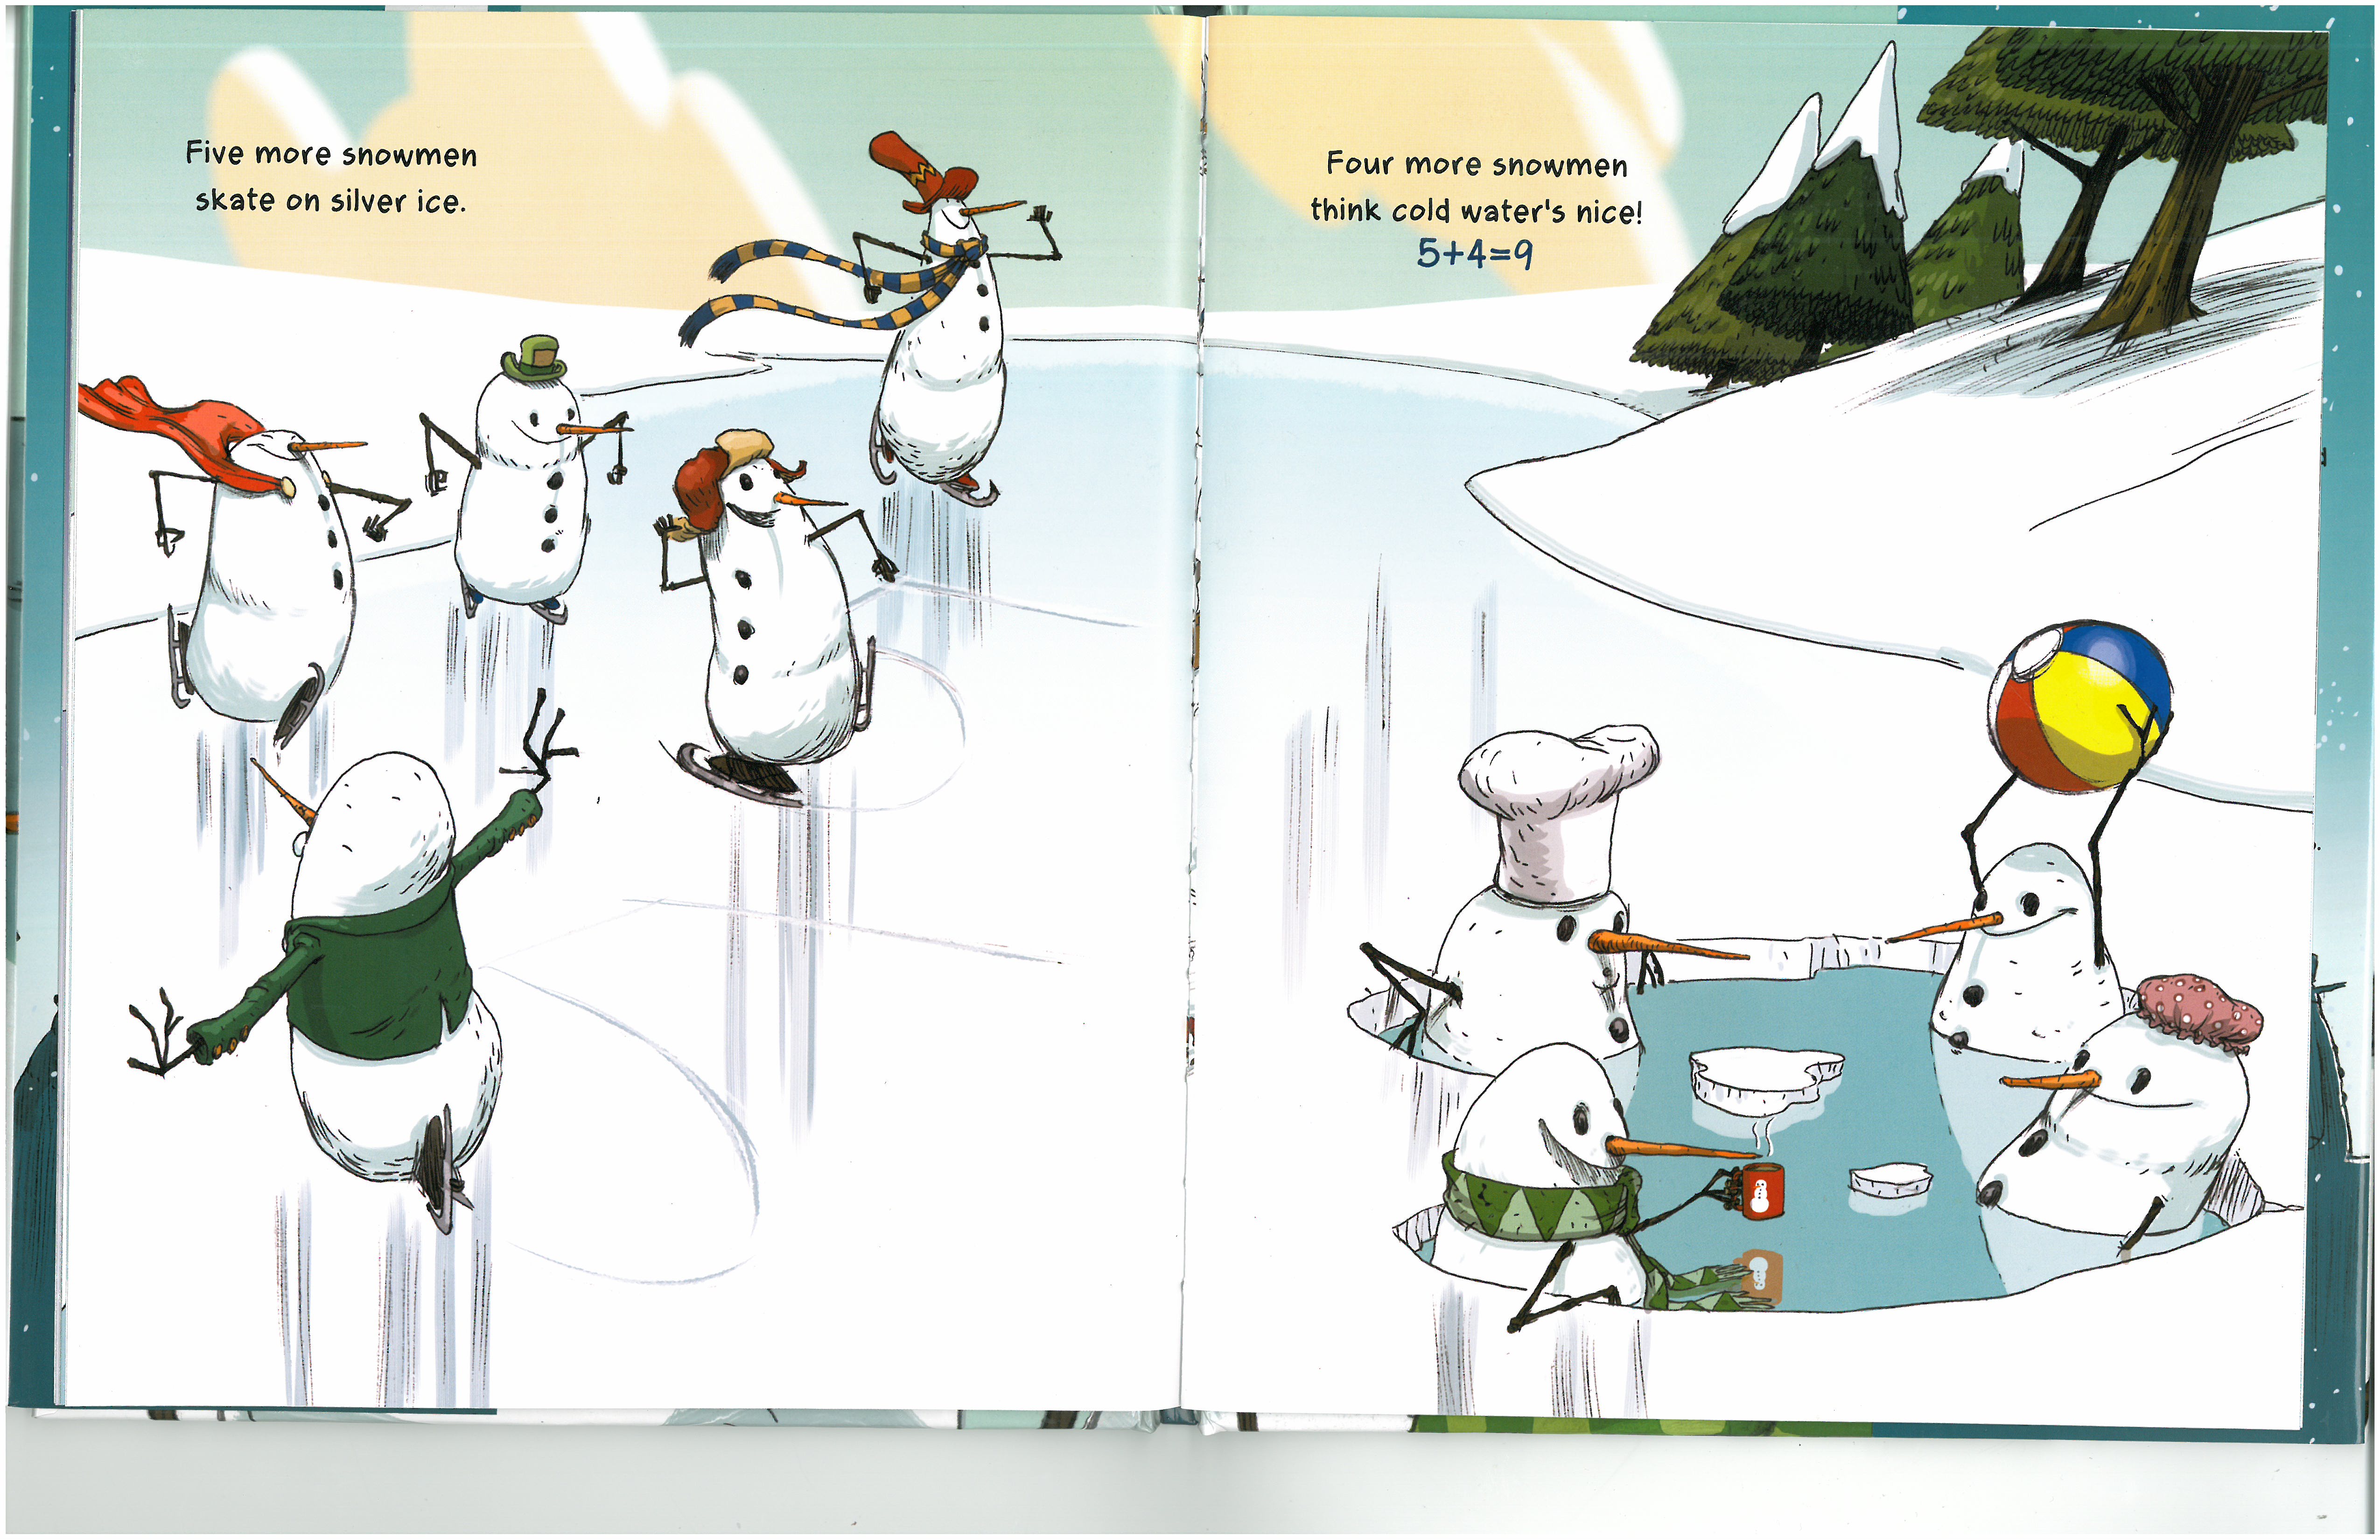
Here, five is not doubled, but one more than four, which is doubled.

SDEC1-4124-13111414450
5 + 4 = (4 + 4) + 1 = 9

Dot cards can be used to draw attention to the doubles plus one strategy. Ask “How many do you see? How do you see them?”

Doubles Plus One Cards

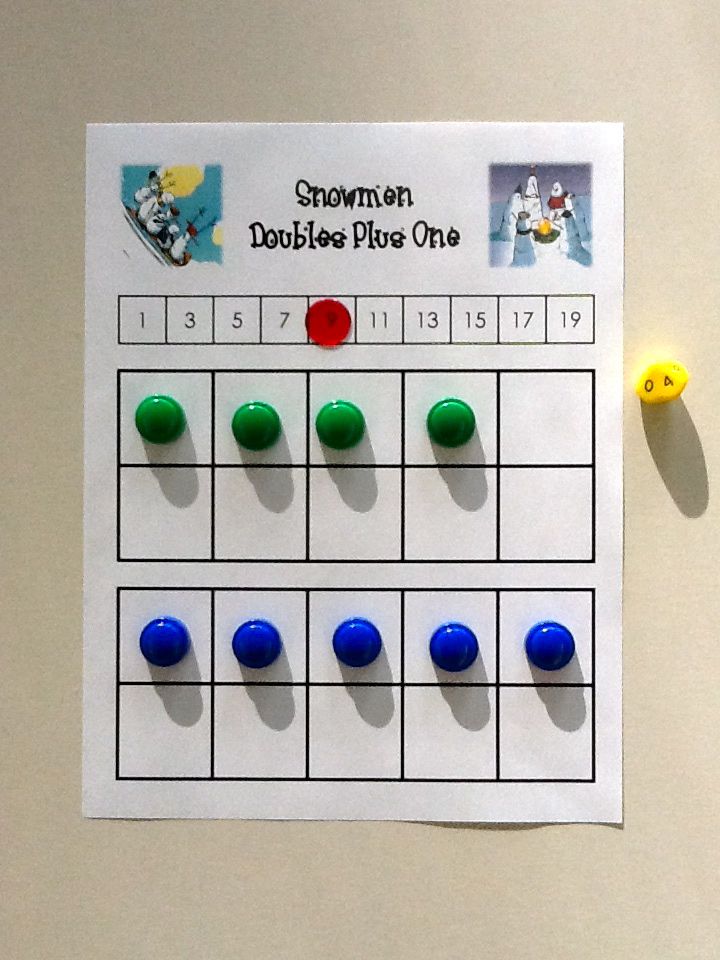
To practice this strategy, students can play a game.

Taking turns:

  • Roll a ten-sided die
  • Build the number
  • Build one more than the number
  • Cover the sum with a transparent counter

The first player to cover all of the sums wins.

Doubles Plus One Game

Snowmen Doubles Plus One

On the last page, every single snowmen is added.

SDEC1-4124-13111414480

This suggests a different mental math strategy: making tens.

doubles plus one
(1 + 2) + (3 + 4) + (5 + 6) + (7 + 8) + (9 + 10) + (9 + 8) + (7 + 6) + (5 + 4) + (3 + 2) + 1
make tens
(1 + 9) + (2 + 8) + (3 + 7) + (4 + 6) + (5 + 5) + (6 + 4) + (7 + 3) + (8 + 2) + (9 + 1) + 10

Previous Math Picture Book Posts: 1 2 3 4

Math Scavenger Hunt

Yesterday’s post reminded me of an activity we created for a recent department head meeting/pro-d workshop.

In pairs, DHs were asked to take a photo (with an iPad — sorry, Timon) of each of the following:

  • a perfect square
  • the use of a referent to determine the linear measure of an object
  • a positive & negative slope
  • a non-linear relation
  • an irrational number
  • similar 2-D shapes or 3-D objects
  • angles formed by parallel lines and a transversal
  • a contextual problem that involves the sine law or cosine law
  • a z-score of ±2
  • elements in the complement, the intersect, or the union of two sets
  • a stranger engaged in math

Math Scavenger Hunt (Secondary)

A fun break from a wrapping our heads around a transformed competency-based curriculum.

In my classroom, I’d probably prefer a more narrow focus — a specific concept over a general math activity. For homework, have students take a photo of parallel lines and a transversal. In class, ask What do you notice? Christopher Danielson’s students — future elementary teachers — were asked to photograph a composed unit, which led to a lovely classroom discussion. Dan Meyer kicks the find a positive & negative slope challenge up a notch by holding a steepest stairs competition.

Any other ideas for challenges/activities?

DEC Stairs
Another DEC photo

Sort of Another Sort

The week before I was asking students in Pre-Calculus 12 to sort trig functions, I was asking students in Grade 6 to sort triangles.

I adapted a textbook task. One of these days, I’m going to finish my post “In Defence of Textbooks. Kinda.”

To get ready, I gave each pair of students a handful of SET cards to sort. Students shared their sorting rules. “There are many ways to sort” was the message. Did this in Pre-Calculus 12, too, by the way.

Next, I gave each pair of students this blackline master:

I asked students to sort the eight triangles into groups. That’s it. About two minutes later some asked, “Can we have rulers?” I gave some rulers.

I called on students to share their sorting rules. (The textbook just tells students to sort the triangles by the number of equal sides.) Order matters. The first pair of students classifed the triangles as small, medium, or large. This closely matched the groups made by the second pair who measured the perimeter of each triangle: something like, “shorter than x centimetres, between x and y centimetres, and longer than y centimetres.” The third pair sorted the triangles based on the length of the longest side. This set up the fourth pair who noticed that, for some triangles, the lengths of two or three sides were equal.

Then, and only then, I defined the terms scalene, isosceles, and equilateral.

In this post, Patrick Vennebush has his sons define arithmetic progression by giving them examples and non-examples.

Compare either approach with this. (Read the comments: Bowman nails it.)

After, students were sent to the hallways, library, gym, and playground with their iPads to take/make a photo of a each type of triangle. Students returned to share their favourite scalene, isosceles, and equilateral triangles through the Apple TV. This led to some fun conversations.

I didn’t collect students’ photos. My photos at DEC reception instead:

Sinusoidal Sort

On Monday, I was invited to Sandra Crawford’s Pre-Calculus 12 classes to try out an activity we created together. Thanks, Sandra!

Sandra’s students were familiar with how transformations of functions affect graphs and their related equations. They’ve stretched & shrunk (vertically & horizontally), flipped (in the x-axis & in the y-axis), & slid (up, down, left, & right) linear (& piecewise linear), quadratic, absolute value, reciprocal, & radical functions. These were topics in prior units. In this unit, students were previously introduced to radian measure, the unit circle, the six trig ratios, & the functions y = sin x, y = cos x, & y = tan x. Next up: determining how varying the values of a, b, c, & d affect the graphs of y = a sin b(x – c) + d & y = a cos b(x – c) + d.

Such was the case when I last taught trig functions (in Principles of Math 12). Back then, my approach was to provide clear and concise explanations, connecting these transformations to those transformations (or, better, transformations of these to transformations of those). But was this necessary? Shouldn’t students be able to make this connection? On. Their. Own.

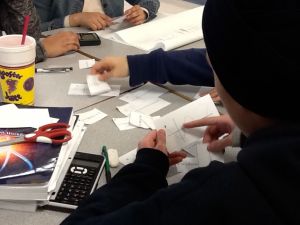
In small groups, students were handed a set of equation cards to sort and were asked to explain their sorting rule. We designed the equations so that there were plenty of similarities and differences in terms of whether or not there were leading coefficients, coefficients of x, brackets, etc., as well as in terms of the values of a, b, c, & d themselves. After all that, most groups just sorted the equations into sine and cosine functions — to be expected, I guess, given the focus of the prior lesson.
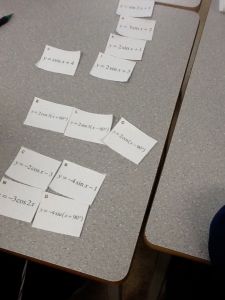
sort1

Next, students were handed graph cards and were asked to match each to the corresponding equation card. We encouraged students to make predictions, then test these predictions using technology. Interestingly, few reached for their graphing calculators or phones. We asked students if, having seen the equations and their graphs together, they wanted to re-sort.
sort2

This process was repeated with characteristic cards. Note: The terms amplitude and period were introduced the lesson before; phase shift and vertical displacement were not. Hence, horizontal translational and vertical translation at this stage of the lesson.

For the most part, students were communicating and reasoning mathematically, making connections, and problem solving. They were engaged with mathematics. A minority probably would have preferred to be engaged with taking notes.

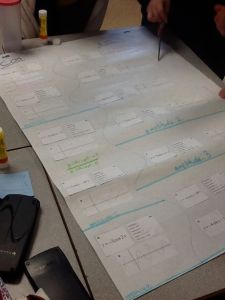
Groups shared their sorts the following day. In the end, the functions were sorted in a variety of ways, which allowed Sandra to highlight each transformation.
sort3

A few groups struggled with matching all of the cards. Therefore, I reduced the number of functions. If finished, some students could be given two additional functions. Each of these is actually a phase shift of one of the initial eight (e.g., y = cos x + 2 ↔ y = sin (x + 90°) + 2). I wonder what they’d do with that.

Sinusoidal Sort (doc)
Sinusoidal Sort (pdf)

(Note: I’ve triple-checked these. Still, no guarantees.)

Survivor: 100 Chart Challenge

I don’t watch Survivor. Stopped watching after Richard Hatch, often competing naked, won the first season.

Channel surfing last week, this grabbed my attention:

Host Jeff Probst:

“Alright, let’s get to today’s duel. For today’s duel you’re gonna race across a balance beam, collecting bags of numbered tiles. You must then place the tiles in order, one to one hundred.”

(Aside: If there are three opponents, is it still called a duel?)

The reaction online was swift and harsh:

“It is seriously the most idiot-proof puzzle in the history of puzzles. You basically have to know how to count and that’s pretty much it.” (source)

But that’s not pretty much it. I mean, it is counting from one to one hundred (and that is how the contestants solved the “puzzle”), but it could be more than that. A better strategy involves comparing numbers, understanding place value, and identifying patterns found in tables.

At 1:49 and 2:02, we see two contestants, Laura and Brad, respectively, place 25 from the second bag (11 to 30).

26

A literal translation of “You gotta put ’em in order”? Each competitor places 25 only after placing 24. Then, he/she tries to find 26 in his/her pile o’ tiles. Some tiles are facing down. Suppose a player turns over a tile and finds 28 rather than 26. He or she should take advantage of another pattern and place it under 18.

At 3:11, it’s down to Brad and John for the last spot. At 3:18, Brad places 87 after 86.

87

He could have caught John if he had an understanding of place value. Suppose Brad turns over 94 before finding 87. Should he drop 94 and continue looking for 87 or just place 94 in the 9th row (9 tens) and 4th column (4 ones)?

This challenge reminds me of an activity I’ve used in Grade 3 classrooms. Take some 100 charts. Cut each chart into “puzzle” pieces. Place in a Ziploc bag. In pairs, have students reassemble. Ask students to describe how they solved their puzzle. This activity is much more engaging (and puzzling) than it has a right to be.

100 Chart Puzzle

Don’t be surprised if you see some completed 100 charts that look like this:

100 Chart Puzzle 2

Long Overdue: A Task for Calculus?

This week, the Vancouver Public Library is offering amnesty on long overdue fines. Readers with overdue fines stay away from libraries. The VPL wants them — patrons and their books — back.

Last year, someone dropped off a vinyl record at the VPL that was due in 1952. I wonder, “How much would have been accumulated in fines?”

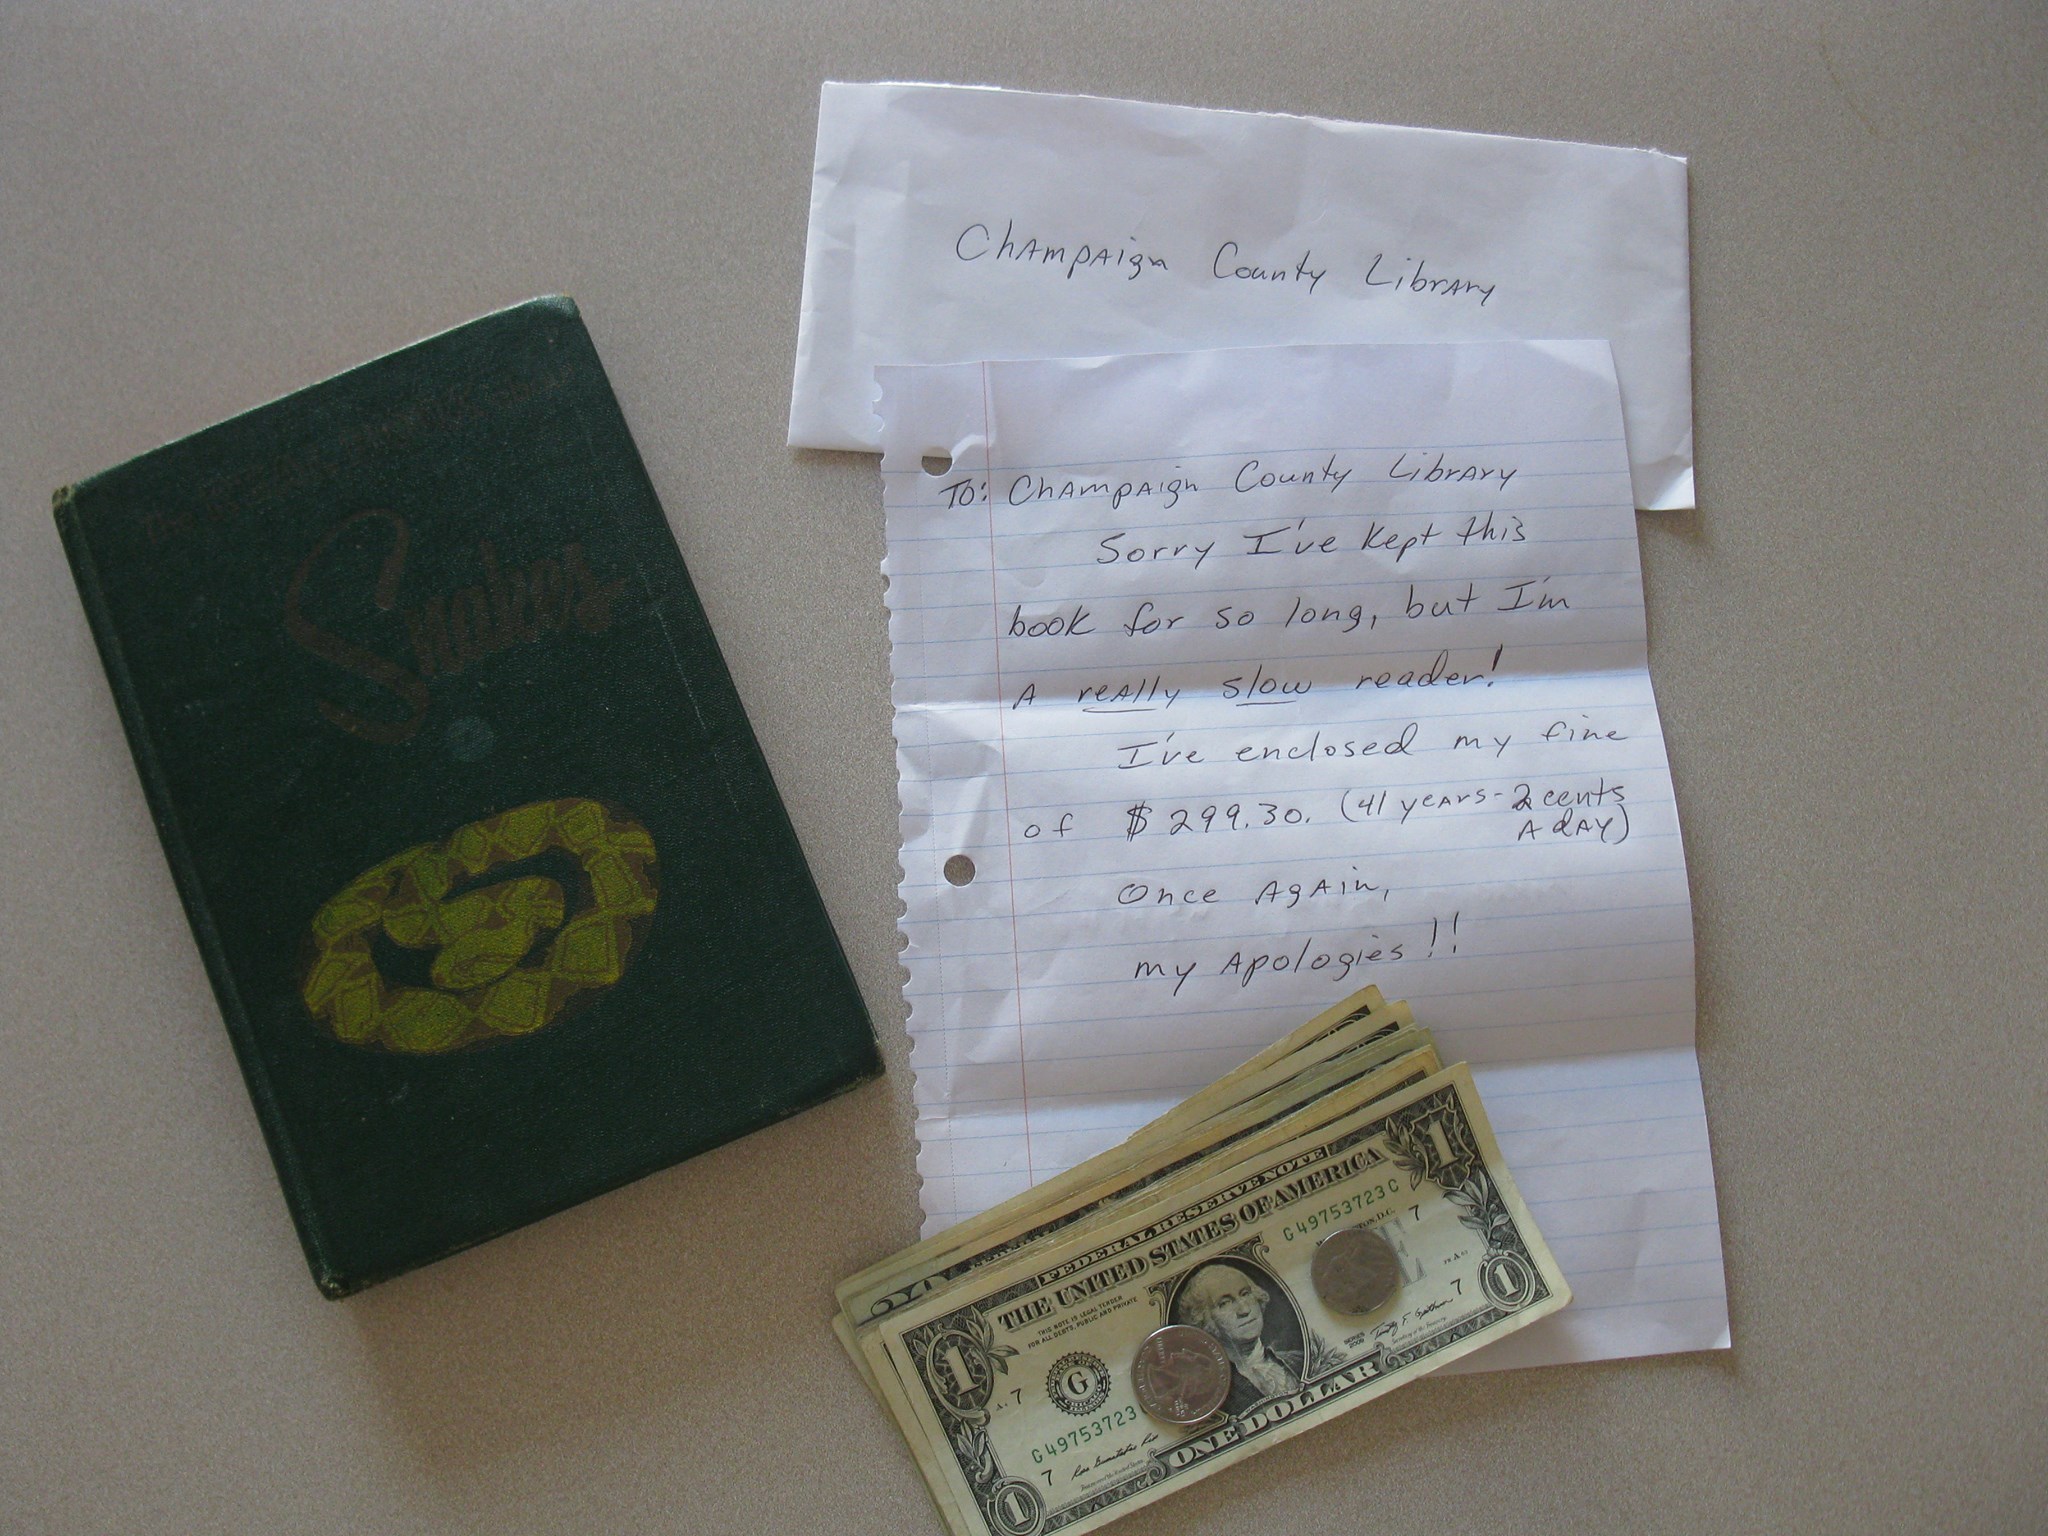
Earlier this year, a man returned “The Real Book of Snakes” 41 years late to a library in Ohio. He enclosed $299.30 — 2¢ a day for 41 years. Seems a tad light. Safe to say, the Champaign County Library does not charge two pennies a day in 2013. The Vancouver Public Library charges 25¢ a day. Let’s go with that. Two bits a day for 41 years works out to $3741.25. Seems a tad excessive.

overdue

So, what’s “fair”? Averaging doesn’t work. That assumes the amount of the daily overdue fine as a function of time is a linear relation, with a constant rate of change of about 0.5¢/year. An increase of one penny from 2¢ to 3¢ in the early seventies is a 50% increase whereas an increase of one penny today is a 4% increase.

Instead, assuming the percentage increase is constant, an exponential function can be used (to approximate a step function). Solving 0.25 = 0.02*e^(r*41) for r gives r = 0.0616. Integrals, like overdue fines, have to do with change and the accumulation of change.

Does the following calculation give the total amount accumulated in fines? My calculus is rusty.

Screen shot 2013-10-29 at 9.03.40 AM

Also this year, “Fire of Francis Xavier” — along with a cheque for $100 — was returned 55 years late to the New York Public Library. How much should he have enclosed?

Remember this?

The start of a three-act task for Calculus, maybe? (Note: Click the links above to watch the news stories from Vancouver and New York.)

In the “real world,” overdue fines at the VPL max out after 42 days, or $10.50, at which time the book is regarded as lost and replacement fees and handling fees kick in. Once again, the “real world” is less interesting than asking “What if?”

Less Play-by-Play, More Colour Commentary

To many, Explain your thinking = Tell me your steps.

Which got me thinking about hockey.

In sports broadcasting, the play-by-play announcer gives a detailed account of the action. The colour commentator provides expert analysis and insight. The sideline reporter does this.

Listen for the difference (play-by-play vs. colour commentary) here:

From ‘Doc’ Emrick, play-by-play announcer, we learn:

  • Sidney Crosby tries to split the defence
  • Ryan Miller steers the puck into the corner
  • Crosby “crunches” the puck along to Jarome Iginla
  • Crosby scores
  • the game is over
  • Canada wins the gold medal

Emrick’s enthusiastic call certainly added to my enjoyment of the broadcast, but it did little to add to my understanding of the events. It’s the stuff of who, what, where, & when. I didn’t really need ‘Doc’ for this; I saw it for myself.

From colour commentator Ed Olczyk, who comes in at 0:50, we learn:

  • a two-on-two turns into a one-on-nothing
  • Sidney Crosby beats Ryan Miller under the pads
  • Jarome Iginla, as he’s falling down, makes a beautiful pass to Sidney Crosby
  • it’s man-on-man coverage in overtime
  • Crosby gets offensive position on Brian Rafalski

Olczyk answers how & why Crosby scores.

Back to the math classroom…

Explain your thinking.

Two fictional responses at two extremes:

Doc: First, I minused 5 from both sides. Then, I divided by 2 and got x equals 3.

Ed: We modelled open & closed using red & yellow counters. We looked for a pattern and noticed that the first three open lockers–1, 4, & 9–are perfect squares. We tested 24 & 25. Switching has to do with factors. Only the perfect squares have an odd number of factors: you only count the 5 for 25 once.

In many math classrooms (mine included), student explanations can sound more like the former than the latter; more detailed account of the calculations on the page than insight into mathematical thinking.

Math teachers can work backwards and determine that Doc completed a practice exercise; he solved 2x + 5 = 11 for x. They’ll also recognize that Ed solved a problem–the well-known locker problem. Students are more likely to explain their thinking if they are being asked to think.

But practice or problem, creating a culture of why–consistently asking “Why?”/”How do you know?”–can also insert colour.

At first, I thought this analogy might be helpful to students–a small part of conversations that also involve post-game analysis of shared student responses (formative feedback, exemplars, etc.).

Whiteboard apps, such as Explain Everything or Show Me, can be used to capture and share student thinking. Student-created videos shared with me (so far) are more play-by-play than colour commentary. There is a place for a description of events as they happen. In fact, I just used a step-by-step video tutorial to help me repair my dishwasher. But we’re talking about mathematics, not home appliance repair. Behind the bench of each student-created tutorial that gets a “meh” from me, there’s a teacher passionate about mathematics and/or technology. I think we have different gameplans. Maybe the sports broadcaster analogy would be helpful to teachers, too?

Got a student-created video that’s more colour commentary than play-by-play? See you in the comments.

And just for fun, the finer points of hockey:

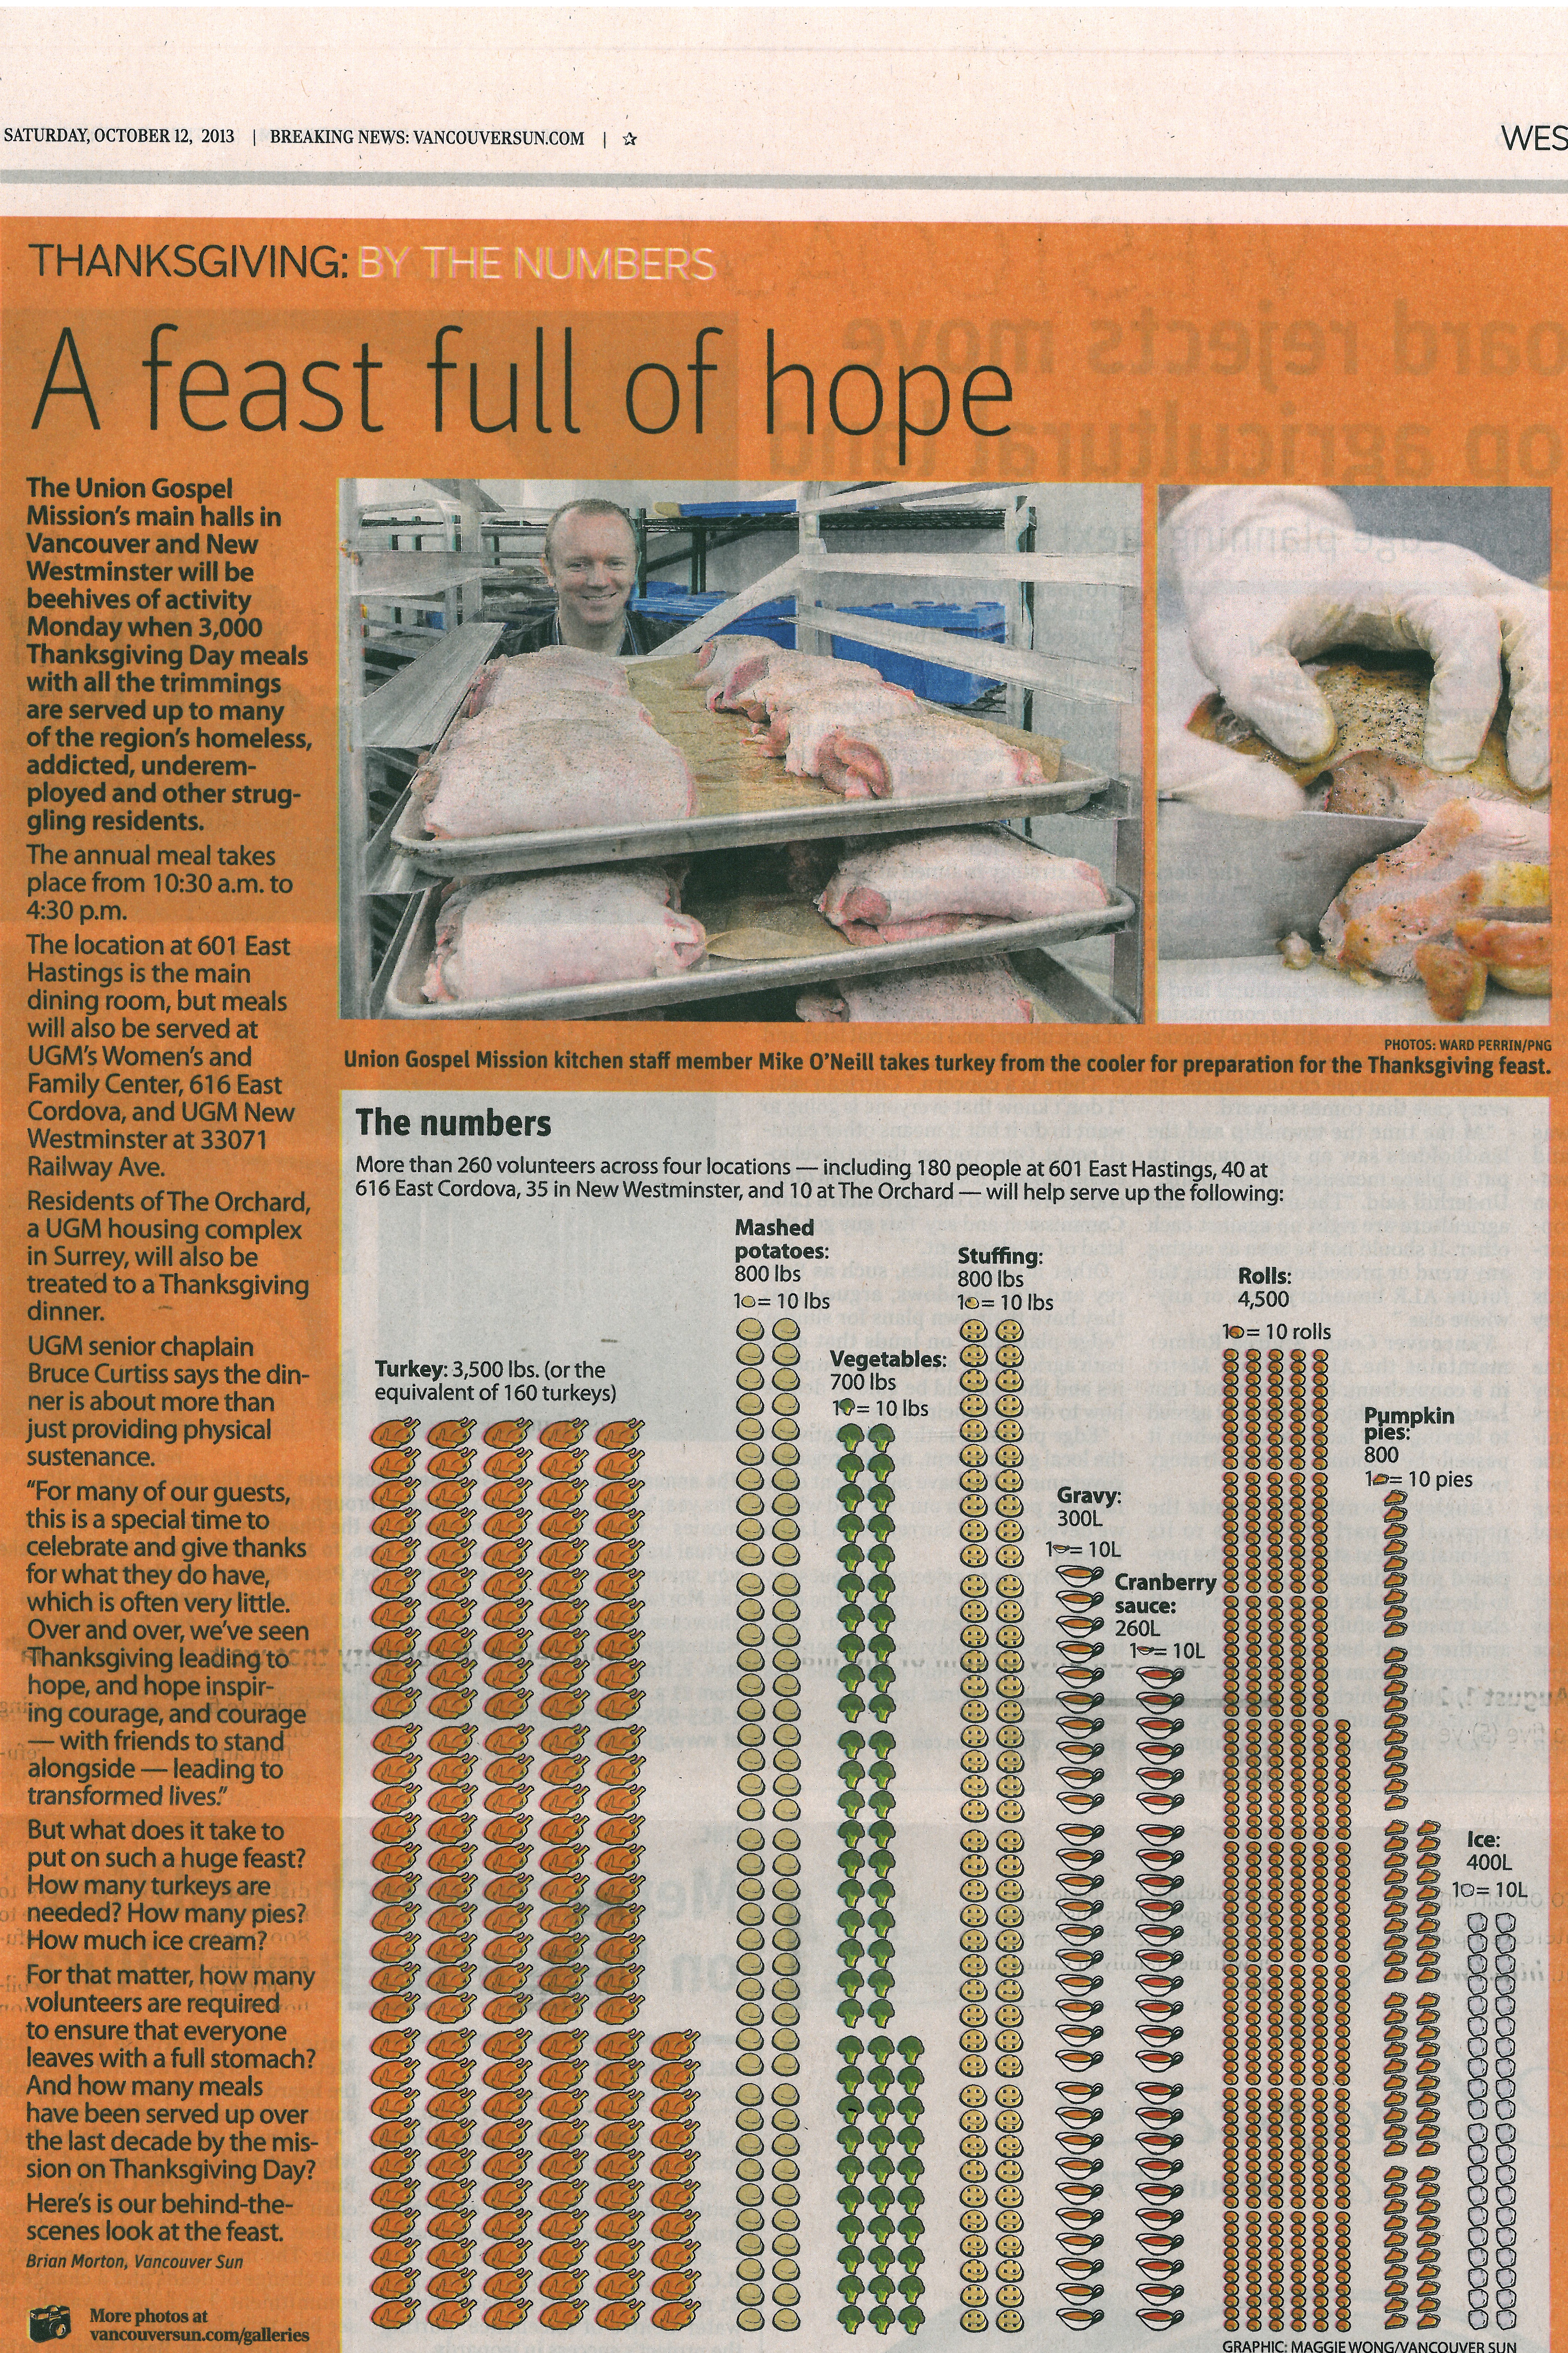
A Turkey of a Graph

This news story could make for an engaging math task. The reporter even lists some questions students may have.

Thanksgiving

But what I really want to know is …

what is this?

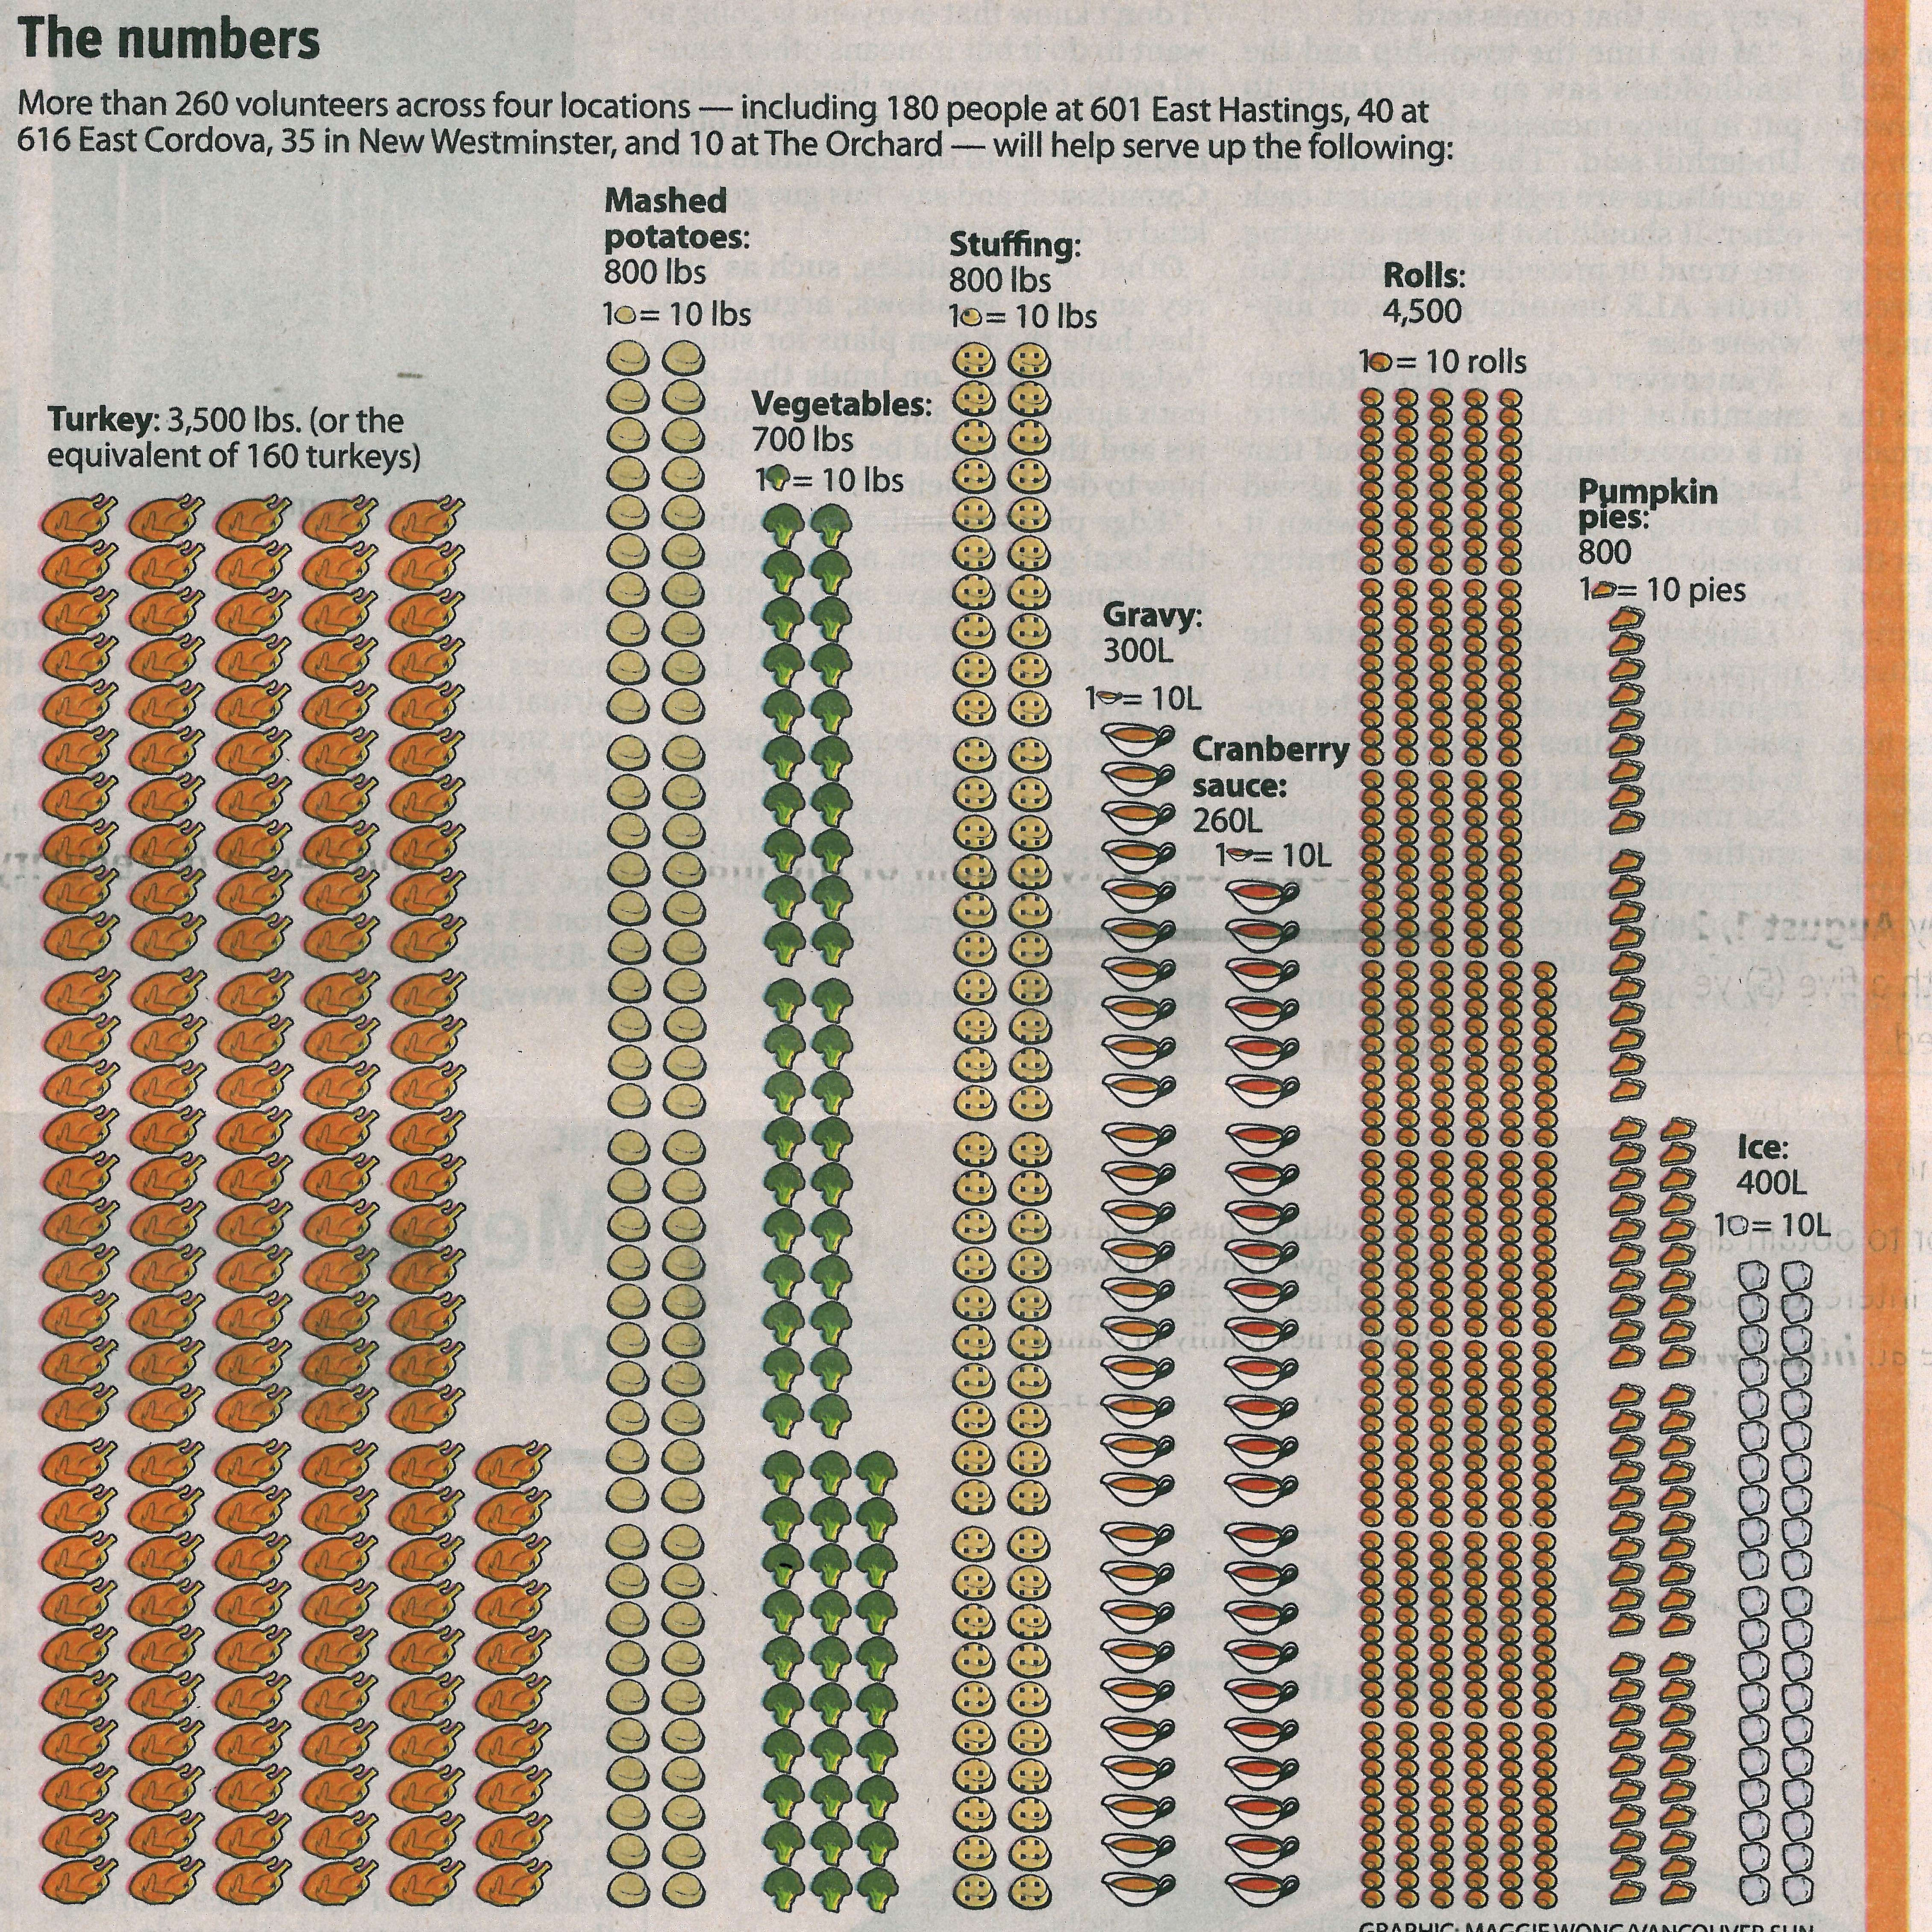
Thanksgiving Graph

Graphs should reveal information about a situation (e.g., relationships, trends). Does this graph do that? The pictograph is cute, but does it suit the data? Choice of format aside, what’s with the different symbols/scales between categories? The reader can compare pounds of mashed potatoes to pounds of vegetables (kind of) and litres of gravy to litres of cranberry sauce, but what conclusion can he or she draw from comparing the mashed potato category to the gravy category (or to turkeys, rolls, or pies, for that matter)? And the spacing? At first glance, it looks like there are 80, not 100, pounds more mashed potatoes than vegetables. But wait–there’s an extra partial column of broccoli. At least it wasn’t Brussels sprouts.

Happy Thanksgiving.

Related:

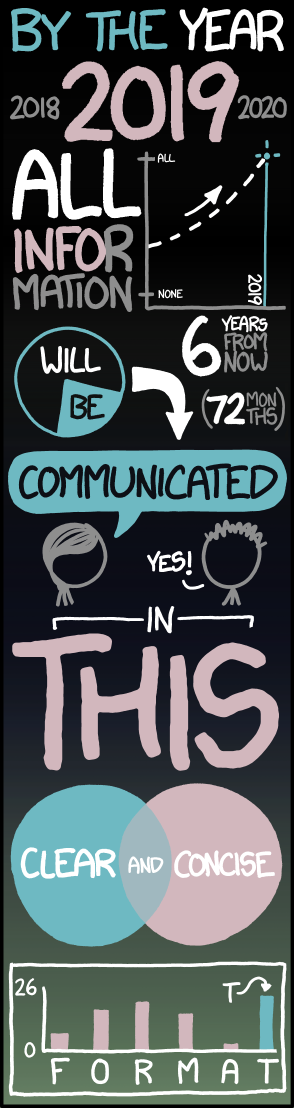
xkcd: Tall Infographics

Ann, Brad, Carol, …

One of my favourite open questions we present to teachers:

Extend the pattern Ann, Brad, Carol, … , in as many ways as you can.

That’s it. Simple, but brings out some big ideas.

So what’s next? Daniel gets a lot of early votes: starts with D, male, six letters. At some point, the increasing pattern–start at three letters and add one each time–becomes challenging. Take Elizabeth. Starts with E? Check. Female? Check. Seven letters? Crap. Extending the pattern in this way eventually means hyphenated names.

Ted
Wait; was it any of those names with a “Lynn” after it?

After exhausting Ann, Brad, Carol, … as an increasing pattern–Eleanor!–teachers get creative with repeating patterns.

For example, looking at one attribute:

  • Aaron, Blake, Caleb (ABC)
  • Olivia, Jackson, Isabella (female-male-female)
  • Max, Liam, Jacob (3-4-5)

Looking at two or more attributes:

  • Andrew, Brooklyn, Christopher (ABC & female-male)
  • Ava, Bono, Chloe (ABC & female-male-female & 3-4-5)

What if Ann-Brad-Carol wasn’t the core of the pattern?

  • Ann, Brad, Carol, Connor, Amy, Bryn, Caden, Carter (ABCC & 3-4-5-6)

A different attribute:

  • Ann, Brad, Carol, Elijah, Genevieve (1-1-2-3-5 vowels)

Not mathy enough for you? Remember, not all teachers will have a positive attitude towards mathematics. This is a safe icebreaker. You can always follow it up with the mathier “Extend the pattern 5, 10, 15, … in as many ways as you can.”

The big idea? Patterns involve something that repeats. Sometimes items repeat, sometimes its the rule that repeats.

Ann, Brad, Carol, … can focus teachers/students on another big idea: the way you show information can make patterns easier to see. Moving from names to SET, spot the pattern in the photos below:

SET1

SET2

When I last posed the Ann, Brad, Carol, … problem, I encouraged teachers to rearrange the names to highlight patterns. One teacher connected this to 100 charts–an aha moment for her.

Big ideas above paraphrased from Marian Small’s Big Ideas.

This is part of this.

[TMWYK] Aero Bubble Bar

Recently, Nestlé launched the new AERO bubble bar throughout Canada and the UK.

For the benefit of the American readership:

cta_aero_bubblebar
Ten-frame!

From the press release:

As well as offering a unique bar design, guaranteed to stand out from the crowd, AERO’s innovation isn’t just for show. The new design sees the bar divided into ten easily snappable ‘bubbles’, making it less messy to eat and more portionable. What’s more, each of the ten ‘bubbles’ are designed to melt more easily in the mouth, maximising the taste of AERO’s signature bubbly chocolate.

I brought one home a couple weeks ago. I put the bar’s portionability to the test.

ow2ad

I snapped off two bubbles each for Keira (5), Gwyneth (8), and Marnie (N/A). Plus, two for me. (Missed math teacher opportunity, I know.) Two pieces were left over. “How much more should we each get?” I asked.

“Half,” Keira answered. She told me to make two cuts: two becomes four, or n(Keira’s family). For shits and giggles, we played with different cuts. What I learned from Keira:

the halves and the halve nots

“Or two-quarters,” Gwyneth piped up.

“Huh?” I returned, caught off-guard. “Tell me more,” I recovered. Gwyneth told me to cut each of the two bubbles into four quarters, giving us eight quarters. Eight pieces can be shared equally between four people. Each of us should get two pieces, or two-quarters.

Gwyneth’s strategy–divide each piece into fourths rather than make four pieces in all like her sister–surprised me. It’s a strategy that makes sense to her: dividing each piece into fourths means she’ll be able to form four equal groups. It’s a strategy that’s flexible: I don’t think she’ll be fazed by a curveball, like an additional bubble or family member.

Symbolically, we have:

0002W4

The result is trivial; her thinking is not.

For more math talk with kids, please follow Christopher Danielson’s new blog.