[SBA] Constructing Proficiency Scales

In this series:

  1. Writing Learning Standards
  2. Constructing Proficiency Scales
  3. Designing Assessment Items
  4. Determining Grades

Constructing Proficiency Scales

BC’s reporting order requires teachers of Grades K-9 to use proficiency scales with four levels: Emerging, Developing, Proficient, and Extending. Teachers of Grades 10-12 may use proficiency scales but must provide letter grades and percentages. Proficiency scales help communicate to students where they are and where they are going in their learning. But many don’t. When constructing these instruments, I keep three qualities in mind…

Descriptive, Positive, Progressive and Additive

Descriptive

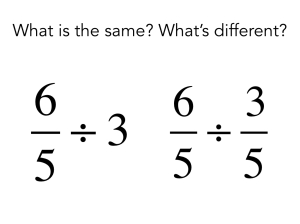
BC’s Ministry of Education defines Emerging, Developing, Proficient, and Extending as demonstrating initial, partial, complete, and sophisticated knowledge, respectively. Great. A set of synonyms. It is proficiency scales that describe these depths with respect to specific learning standards; they answer “No, really, what does Emerging, or initial, knowledge of operations with fractions look like?” Populating each category with examples of questions can help students–and teachers–make sense of the descriptors.

Positive

Most scales or rubrics are single-point posing as four. Their authors describe Proficient, that’s it. The text for Proficient is copied and pasted to the Emerging and Developing (or Novice and Apprentice) columns. Then, words such as support, some, and seldom are added. Errors, minor (Developing) and major (Emerging), too. These phrases convey to students how they come up short of Proficient; they do not tell students what they know and can do at the Emerging and Developing levels.

Progressive and Additive

BC’s Ministry of Education uses this phrase to describe profiles of core competencies: “[Profiles] are progressive and additive, and they emphasize the concept of expanding and growing. As students move through the profiles, they maintain and enhance competencies from previous profiles while developing new skills.”

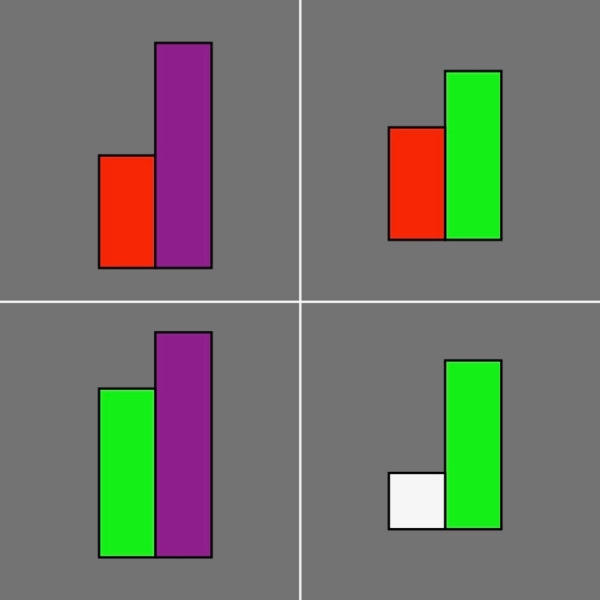
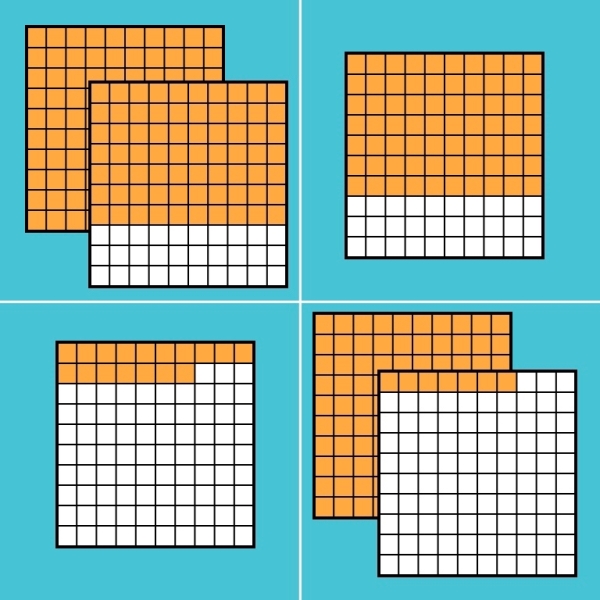
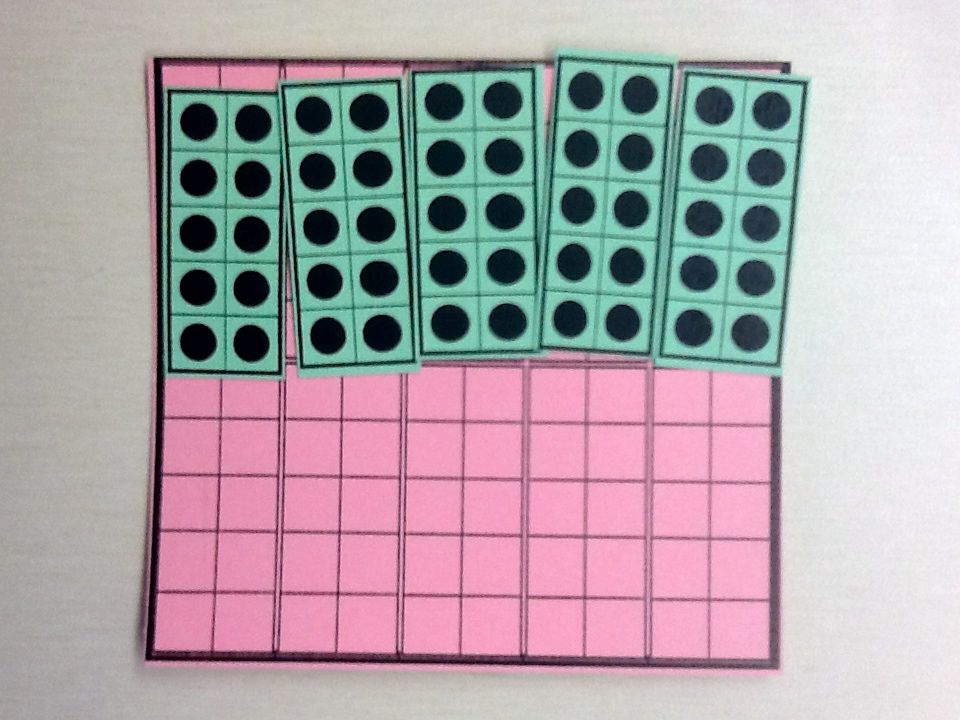
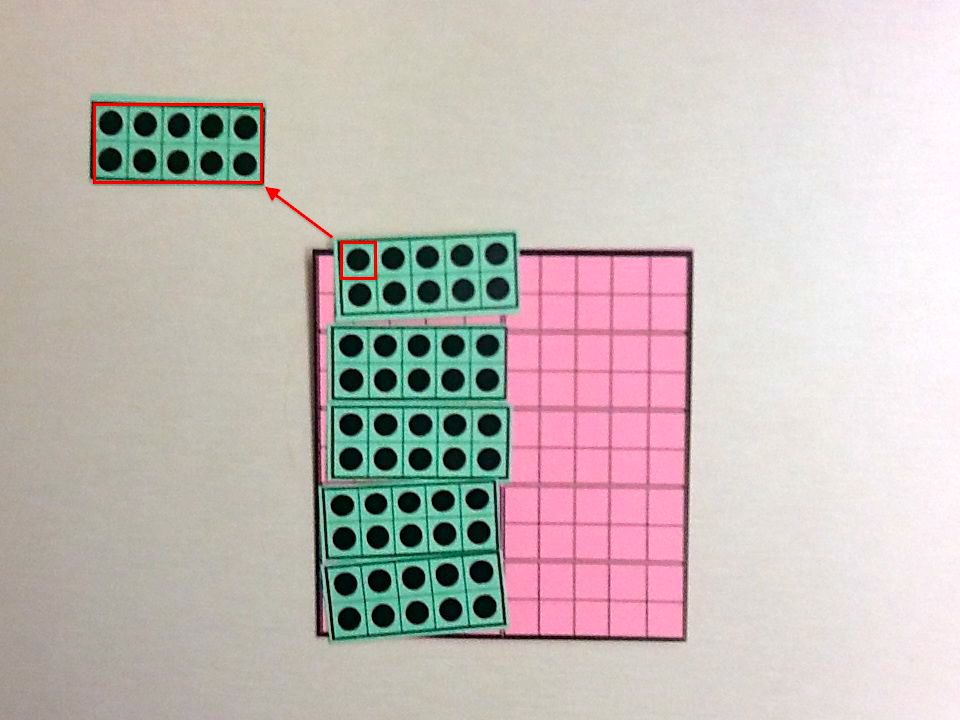
I have borrowed this idea and applied it to content learning standards. It was foreshadowed by the graphic organizer at the end of my previous post: Extending contains Proficient, Proficient contains Developing, and Developing contains Emerging. (Peter Liljedahl calls this backward compatible.) For example, if a student can determine whole number percents of a number (Proficient), then it is assumed that they can also determine benchmark percents (i.e., 50%, 10%) of a number (Emerging). A move from Emerging to Proficient reflects new, more complex, knowledge, not greater independence or fewer mistakes. Students level up against a learning standard.

Emerging and Extending

The meanings of two levels–Emerging to the left and Extending to the right–are open to debate. Emerging is ambiguous, Extending less so. Some interpretations of Extending require rethinking.

Emerging

“Is Emerging a pass?” Some see Emerging as a minimal pass; others interpret “initial understanding” as not yet passing. The MoE equivocates: “Every student needs to find a place on the scale. As such, the Emerging indicator includes both students at the lower end of grade level expectations, as well as those before grade level expectations. […] Students who are not yet passing a given course or learning area can be placed in the Emerging category.” Before teachers can construct proficiency scales that describe Emerging performance, they must land on a meaning of Emerging for themselves. This decision impacts, in turn, the third practice of a standards-based approach, designing assessment items.

Extending

A flawed framing of Extending persists: above and beyond. Above and beyond can refer to a teacher’s expectations. The result: I-know-it-when-I-see-it rubrics. “Wow me!” isn’t descriptive.

Above and beyond can also refer to a student’s grade level. Take a closer look at the MoE’s definition of Extending: “The student demonstrates a sophisticated understanding of the concepts and competencies relevant to the expected learning [emphasis added].” It is Math 6 standards, not Math 8 standards, that set forth the expected learning in Math 6. When reaching a decision about proficiency in relation to a Math 6 outcome, it is unreasonable–and nonsensical–to expect knowledge of Math 8 content.

Characterizing Extending as I can teach others is also problematic. Explaining does not ensure depth; it doesn’t raise a complete understanding of a concept to a sophisticated understanding. Further, I can teach others is not limited to one level. A student may teach others at a basic complexity level. For example, a student demonstrates an initial understanding of add and subtract fractions when they explain how to add proper fractions with the same denominator.

Example: Systems of Linear Equations

In my previous post, I delineated systems of linear equations as solve graphically, solve algebraically, and model and solve contextual problems. Below, I will construct a proficiency scale for each subtopic.

Note that I’ve attached specific questions to my descriptors. My text makes sense to me; it needs to make sense to students. Linear, systems, model, slope-intercept form, general form, substitution, elimination–all of these terms are clear to teachers but may be hazy to the intended audience. (Both logarithmic and sinusoidal appear alongside panendermic and ambifacient in the description of the turbo-encabulator. Substitute nofer trunnions for trigonometric identities in your Math 12 course outline and see if a student calls you on it on Day 1.) The sample questions help students understand the proficiency scales: “Oh yeah, I got this!”

Some of these terms may not make sense to my colleagues. Combination, parts-whole, catch-up, and mixture are my made-up categories of applications of systems. Tees and hoodies are representative of hamburgers and hot dogs or number of wafers and layers of stuf. Adult and child tickets can be swapped out for dimes and quarters or movie sales and rentals. The total cost of a gas vehicle surpassing that of an electric vehicle is similar to the total cost of one gym membership or (dated) cell phone plan overtaking another. Of course, runner, racing car and candle problems fall into the catch-up category, too. Textbooks are chock full o’ mixed nut, alloy, and investment problems. I can’t list every context that students might come across; I can ask “What does this remind you of?”

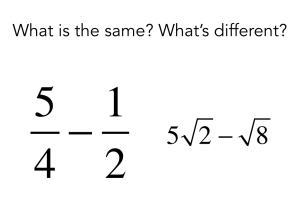
My descriptors are positive; they describe what students know, not what they don’t know, at each level. They are progressive and additive. Take a moment to look at my solve-by-elimination questions. They are akin to adding and subtracting quarters and quarters, then halves and quarters, then quarters and thirds (or fifths and eighths) in Math 8. Knowing \frac{8}{3} - \frac{5}{4} implies knowing \frac{7}{4} - \frac{3}{4}.

Emerging is always the most difficult category for me to describe. My Emerging, like the Ministry’s, includes not yet passing. I would welcome your feedback!

Describing the Extending category can be challenging, too. I’m happy with my solve graphically description and questions. I often lean on create–or create alongside constraints–for this level. I’m leery of verb taxonomies; these pyramids and wheels can oversimplify complexity levels. Go backwards might be better. Open Middle problems populate my Extending columns across all grades and topics.

My solve algebraically… am I assessing content (i.e., systems of linear equations) or competency (i.e., “Explain and justify mathematical ideas and decisions”)? By the way, selecting and defending an approach is behind my choice to not split (👋, Marc!) substitution and elimination. I want to emphasize similarities among methods that derive equivalent systems versus differences between step-by-step procedures. I want to bring in procedural fluency:

Procedural fluency is the ability to apply procedures accurately, efficiently, and flexibly; to transfer procedures to different problems and contexts; to build or modify procedures from other procedures; and to recognize when one strategy or procedure is more appropriate to apply than another

NCTM

But have I narrowed procedural fluency to one level?

And what about something like:

\frac{x}{3} + \frac{y}{2} = 3
\frac{x+3}{2} + \frac{y+1}{5} = 4?

More complicated? Yep. More complex? Probably not.

Note that my model and solve contextual problems is described at all levels. Apply does not guarantee depth of knowledge. Separating problem solving–and listing it last–might suggest that problem solving follows building substitution and elimination methods. It doesn’t. They are interweaved. To see my problem-based approach, watch my Systems of Linear Equations videos from Surrey School’s video series for parents.

Next up, designing assessment items… and constructing proficiency scales has done a lot of the heavy lifting!

[SBA] Writing Learning Standards

For several years, standards-based assessment (SBA) has been the focus of much of my work with Surrey teachers. Simply put, SBA connects evidence of student learning with learning standards (e.g., “use ratios and rates to make comparisons between quantities”) rather than events (“Quiz 2.3”). The change from gathering points to gathering data represents a paradigm shift.

In this traditional system, experience has trained students to play the game of school. Schools dangle the carrot (the academic grade) in front of their faces and encourage students to chase it. With these practices, schools have created a culture of compliance. Becoming standards based is about changing to a culture of learning. “Complete this assignment to get these points” changes to “Complete this assignment to improve your learning.” […] Educators have trained learners to focus on the academic grade; they can coach them out of this assumption.

Schimmer et al., 2018, p. 12

In this series, I’ll describe four practices of a standards-based approach:

  1. Writing Learning Standards
  2. Constructing Proficiency Scales
  3. Designing Assessment Items
  4. Determining Grades

Writing Learning Standards

In BC, content learning standards describe what students know and curricular competency learning standards describe what students can do. Describe is generous–more like list. In any mathematical experience a student might “bump into” both content and competency learning standards. Consider Nat Banting’s Quadratic Functions Menu Math task:

Think about the following ten “design specifications” of quadratic functions:

A.Two negative x-interceptsB.Vertex in quadrant II
C.Never enters quadrant IIID.Vertex on the y-axis
E.Positive y-interceptF.No x-intercepts
G.Never enters quadrant IH.Has a minimum value
I.Horizontally stretchedJ.Line of symmetry enters quadrant IV

You could build ten different quadratic functions to satisfy these ten different constraints.

Instead, build a set of as few quadratic functions as possible to satisfy each constraint at least once. Write your functions in the form y = a(x − p)2 + q.

Which constraints pair nicely? Which constraints cannot be paired?

Is it possible to satisfy all ten constraints using four, three, or two functions?

Describe how and why you built each function. Be sure to identify which functions satisfy which constraints.

Students activate their knowledge of quadratic functions. In addition, they engage in several curricular competencies: “analyze and apply mathematical ideas using reason” and “explain and justify mathematical ideas and decisions,” among others. Since the two are interwoven, combining competencies and content (i.e., “reason about characteristics of quadratic functions”) is natural when thinking about a task as a learning activity. However, from an assessment standpoint, it might be helpful to separate the two. In this series, I will focus on assessing content.

The content learning standard quadratic functions and equations is too broad to inform learning. Quadratic functions–nevermind functions and equations–is still too big. A student might demonstrate Extending knowledge of quadratic functions in the form y = a(x − p)2 + q but Emerging knowledge of completing the square, attain Proficient when graphing parabolas but Developing when writing equations.

Operations with fractions names an entire unit in Mathematics 8. Such standards need to be divided into subtopics, or outcomes. For example, operations with fractions might become:

  1. add and subtract fractions
  2. multiply and divide fractions
  3. evaluate expressions with two or more operations on fractions
  4. solve contextual problems involving fractions

Teachers can get carried away breaking down learning standards, differentiating proper from improper fractions, same from different denominators, and so on. These differences point to proficiency levels, not new outcomes. Having too many subtopics risks atomizing curriculum. Further, having as many standards as days in the course is incompatible with gathering data over time. I aim for two to four (content) outcomes per unit.

In Foundations of Mathematics and Pre-calculus 10, systems of linear equations can be delineated as:

  1. solve graphically
  2. solve algebraically
  3. model and solve contextual problems

My solve algebraically includes both substitution and elimination. Some of my colleagues object to this. No worries, separate them.

In my next post, I’ll describe constructing proficiency scales to differentiate complexity levels within these learning standards. Here’s a sneak peek:

What do you notice?

Alike & Different: Which One Doesn’t Belong? & More

I have no idea what I was going for here:

WODB? Cuisenaire Rods

At that time, I was creating Which One Doesn’t Belong? sets. Cuisenaire rods didn’t make the cut. Nor did hundreds/hundredths grids:

WODB? Hundreds Grids

I probably painted myself into a corner. Adding a fourth shape/graph/number/etc. to a set often knocks down the reason why one of the other three doesn’t belong. Not all two-by-two arrays make good WODB? sets (i.e., a mathematical property that sets each element apart).

Still, there are similarities and differences among the four numbers above that are worth talking about. For example, the top right and bottom right are close to 100 (or 1); the top left and bottom right are greater than 100 (or 1); top left and top right have seven parts, or rods, of tens (or tenths); all involve seven parts in some way. There is an assumed answer to the question, “Which one is 1?,” in these noticings — a flat is 100 if we’re talking whole numbers and 1 if we’re talking decimals. But what if 1 is a flat in the top left and a rod in the bottom left? Now both represent 1.7. (This flexibility was front and centre in my mind when I created this set. The ten-frame sets, too.)

Last spring, Marc and I offered a series of workshops on instructional routines. “Alike and Different: Which One Doesn’t Belong? and More” was one of them. WODB? was a big part of this but the bigger theme was same and different (and justifying, communicating, arguing, etc.).

So rather than scrap the hundreds/hundredths grids, I can simplify them:

Alike&Different.006

Another that elicits equivalent fractions and place value:

Alike&Different.007

For more, see Brian Bushart’s Same or Different?, another single-serving #MTBoS (“Math-Twitter-Blog-o-Sphere”) site.

Another question that I like — from Marian Small — is “Which two __________ are most alike?” I like it because the focus is on sameness and, like WODB?, students must make and defend a decision. Also, this “solves” my painted-into-a-corner problem; there are three, not six, relationships between elements to consider.

Alike&Different.009

The numbers in the left and right images are less than 100 (if a dot is 1); the numbers in the centre and right can be expressed with 3 in the tens place; the left and centre image can both represent 43, depending on how we define 1.

At the 2017 Northwest Mathematics Conference in Portland, my session was on operations across the grades. The big idea that ran through the workshop:

“The operations of addition, subtraction, multiplication, and division hold the same fundamental meanings no matter the domain in which they are applied.”
– Marian Small

That big idea underlies the following slide:

Alike&Different.013

At first glance, the second and third are most alike: because decimals. But the quotient in both the first and second is 20; in fact, if we multiply both 6 and 0.3 by 10 in the second, we get the first. The first and third involve a partitive (or sharing) interpretation of division: 3 groups, not groups of 3. (Likely. Context can determine meaning. My claim here is that for each of these two purposefully crafted combinations of naked numbers, division as sharing is the more intuitive meaning.)

Similar connections can be made here:

Alike&Different.015

This time, the first and second involve a quotative (or measurement) interpretation of division: groups of (−3) or 3x, not (−3) or 3x groups. (What’s the reason for the second and third? Maybe this isn’t a good “Which two are most alike?”?)

I created a few more of these in the style of Brian’s Same or Different?, including several variations on 5 − 2.

Alike&Different.017
Alike&Different.023

Note: this doesn’t work in classrooms where the focus is on “just invert and multiply” (or butterflies or “keep-change-change” or…).

And I still have no idea what I was going for with the Cuisenaire rods.

The slides:

Updates:

An edited version of this post appeared in Vector.

Dividing by Decimals & Fractions: Ham & Ribs

I bought a ham. It was touch-and-go there for awhile. As I was picking up and putting down hams of various sizes, I was calculating baking times. My essential question was, can I have this on the table by six? Simultaneously, I was trying to remember if this was partitive or quotative division.

In partitive division problems, a.k.a division as (fair) sharing, the number of groups is known. This type of problem asks how many are in each group. In quotative division problems, a.k.a. division as measurement, the number in each group is known. This type of problem asks how many groups. For example: 6 ÷ 3 = 2 (partitive) means ♦♦  ♦♦  ♦♦; 6 ÷ 3 = 2 (quotative) means ♦♦♦  ♦♦♦. This distinction isn’t limited to collections of objects. Consider 6 ÷ 3 as cutting a 6 m rope into 3 parts (sharing) vs. cutting lengths of 3 m (measurement). Nor are these meanings limited to whole numbers. Which brings me back to my ham…

The directions read “bake approximately 15 minutes per pound (0.454 kg) or until internal temperature reaches whatever.” But here’s the thing:

Ham

Kilograms, not pounds. I could have converted from kilograms to pounds by doubling then adding ten percent of that. Instead, I divided 1.214 by 0.454. I know, I know, this still gives me the weight of my ham in pounds. But at the time, I interpreted 2.67 as the number of repeated additions of 15 minutes in my baking time. Either way, I determined how many 0.454s there are in 1.214. Quotative division. By a decimal.

As a math task, this is clunky. The picture book How Much Does a Ladybug Weigh? by Alison Limentani is a more promising jumping off point for quotative division in the classroom. On each page, the weight of one animal is expressed in terms of a smaller animal.

How Much Does a Ladybug Weigh? Snails & Starling

Using the data at the back of the book, we have 3.2 ÷ 0.53 = 6. We could ask children to make other comparisons (e.g., how many grasshoppers weigh the same as one garden snail?).

How Much Does a Ladybug Weigh? Data

[Insert link to Marc‘s First Peoples beaded necklace task here]

In the past, I have struggled with partitive division by decimals (or fractions). But I found the following example at The Fair this summer:

RibRacks

It’s not intuitive–at least to me–to think of 1/3 in 12 ÷ 1/3 as the number of groups. Take a step back and think about 26 ÷ 1 = 26. The cost, $26, is shared between 1 rack of ribs; the quotient represents the unit price, $26/rack, if the unit is a rack. This result should be… underwhelming.

Before we think about dividing by a fraction here, let’s imagine dividing by a whole number (not equal to one). What if I paid $72 for 3 racks? (Don’t look for these numbers in the photo above–I’m making them up.) In 72 ÷ 3 = 24, the cost, $72, is shared between the number of racks, 3; again, the quotient represents the unit price, $24/rack. Partitive division.

So what about 12 ÷ 1/3? The cost is still distributed across the number of racks; once again, the quotient represents the unit price, $36/(full) rack. The underlying relationship between dividend, divisor, and quotient hasn’t changed because of a fraction; the fundamental meaning (partitive division) remains the same.

We could have solved this problem by asking a parallel question, how many 1/3s in 12? And this quotative interpretation makes sense with naked numbers. But it falls apart in this context–how many 1/3 racks in 12 dollars? Units, man! If dollars were racks, a quotative interpretation would make sense–how many 1/3 racks in 12 full racks?

As a math task, this, too, is clunky. My favourite math tasks for partitive division by fractions are still Andrew Stadel’s estimation jams.

(Looking for a quotative division problem that involves whole numbers? See Graham Fletcher’s Seesaw three-act math task. For partitive, there’s Bean Thirteen.)

Fair Share Pair

A couple weeks ago, I was discussing ratio tasks, including Sharing Costs: Travelling to School from MARS, with a colleague who reminded me of a numeracy task from Peter Liljedahl. Here’s my take on Peter’s Payless problem:

Three friends, Chris, Jeff, and Marc, go shopping for shoes. The store is having a buy two pairs, get one pair free sale.

 Chris opts for a pair of high tops for $75, Jeff picks out a pair of low tops for $60, and Marc settles on a pair of slip-ons for $45.

The cashier rings them up; the bill is $135.

How much should each friend pay? Try to find the fairest way possible. Justify your reasoning.

Sharing Pairs.pdf

I had a chance to test drive this task in a Math 9 class. I asked students to solve the problem in small groups and record their possible solutions on large whiteboards. Later, each student recorded his or her fairest share of them all on a piece of paper. If you’re more interested in sample student responses than my reflections, scroll down.

The most common initial approach was to divide the bill by three; each person pays $45. What’s more fair than same? I poked holes in their reasoning: “Is it fair for Marc to pay the same as Chris? Why? Why not?” Students notice that Chris is getting more shoe for his buck. Also, Marc is being cheated of any discount, as described by Student A. (This wasn’t a happy accident; it’s the reason why I chose the ratio 5:4:3.)

Next, most groups landed on $60-$45-$30. Some, like Student A, shifted from equal shares of the cost to equal shares of the discount; from ($180 − $45)/3 to $45/3. Others, like Students B, C, and D, arrived there via a common difference; in both $75, $60, $45 and $60, $45, $30, the amounts differ by $15. This approach surprised me. Additive, rather than multiplicative, thinking.

Student C noticed that this discount of $15 represented different fractions of the original prices; $15/$75 = 1/5, $15/$60 = 1/4, $15/$45 = 1/3. He applied a discount of 1/4 to all three because “it’s the middle fraction.” Likely, this is a misconception that didn’t get in the way of a reasonable solution.

Student D presented similar amounts. Note the interplay of additive and multiplicative thinking. She wants to keep a common difference, but changes it to $10 to better match the friends’ discounts as percents.

Student E applies each friend’s percent of the original price to the sale price. This approach came closest to my intended learning outcome: “Solve problems that involve rates, ratios and proportional reasoning.”

In spite of not reaching my learning goal, I think that this lesson was a success. The task was accessible yet challenging, allowed students to make and justify decisions, and promoted mathematical discourse.

Still, to increase the future likelihood that students solve this problem using ratios, I’m wondering about changes I could make. Multiples of 20 ($100-$80-$60) rather than 15 ($75-$60-$45)? Different ratios, like 4:3:2 or 5:3:2, might help; the doubles/halves could kickstart multiplicative thinking. (Also, 5:3:2 breaks that arithmetic sequence.)

Or, I could make changes to my questioning.

Sharing PairsWhen I asked “What do you notice?” students said:

  • the prices of the shoes are different
  • Chris’ shoes are the most expensive
  • Marc’s shoes are the cheapest
  • Chris’ shoes are $15 more than Jeff’s, which are $15 more than Marc’s
  • Jeff’s shoes are the fugliest

Maybe I could ask “What else could you say about the prices of Chris’ shoes compared to Marc’s?” etc. to prompt comparisons involving ratios. If that fails, I’m more comfortable connecting ratios to the approaches taken by students themselves than I am forcing it.

BTW, “buy one, get one 50% off” vs. “buy two, get one free” would make a decent “Would you rather?” math task.

h/t Cam Joyce, Carley Brockway

Sharing Pairs - Sample Student Response A
Sharing Pairs – Sample Student Response A

Sharing Pairs - Sample Student Response B
Sharing Pairs – Sample Student Response B

Sharing Pairs - Sample Student Response C
Sharing Pairs – Sample Student Response C

Sharing Pairs - Sample Student Response D
Sharing Pairs – Sample Student Response D

Sharing Pairs - Sample Student Response E
Sharing Pairs – Sample Student Response E

[TMWYK] Aero Bubble Bar

Recently, Nestlé launched the new AERO bubble bar throughout Canada and the UK.

For the benefit of the American readership:

cta_aero_bubblebar
Ten-frame!

From the press release:

As well as offering a unique bar design, guaranteed to stand out from the crowd, AERO’s innovation isn’t just for show. The new design sees the bar divided into ten easily snappable ‘bubbles’, making it less messy to eat and more portionable. What’s more, each of the ten ‘bubbles’ are designed to melt more easily in the mouth, maximising the taste of AERO’s signature bubbly chocolate.

I brought one home a couple weeks ago. I put the bar’s portionability to the test.

ow2ad

I snapped off two bubbles each for Keira (5), Gwyneth (8), and Marnie (N/A). Plus, two for me. (Missed math teacher opportunity, I know.) Two pieces were left over. “How much more should we each get?” I asked.

“Half,” Keira answered. She told me to make two cuts: two becomes four, or n(Keira’s family). For shits and giggles, we played with different cuts. What I learned from Keira:

the halves and the halve nots

“Or two-quarters,” Gwyneth piped up.

“Huh?” I returned, caught off-guard. “Tell me more,” I recovered. Gwyneth told me to cut each of the two bubbles into four quarters, giving us eight quarters. Eight pieces can be shared equally between four people. Each of us should get two pieces, or two-quarters.

Gwyneth’s strategy–divide each piece into fourths rather than make four pieces in all like her sister–surprised me. It’s a strategy that makes sense to her: dividing each piece into fourths means she’ll be able to form four equal groups. It’s a strategy that’s flexible: I don’t think she’ll be fazed by a curveball, like an additional bubble or family member.

Symbolically, we have:

0002W4

The result is trivial; her thinking is not.

For more math talk with kids, please follow Christopher Danielson’s new blog.

More Decimals and Ten-Frames

What number is this?

123

123? 12.3? 1.23? One has to ask oneself one question: Which one is one?

Earlier this year, I was invited into a classroom to introduce decimals. We had been representing and describing tenths concretely, pictorially, and symbolically. We finished five minutes short, so I gave the students a blank hundred-frame and asked them to show me one half and express this in as many ways as they could.

blank 100

5 tenths 50 hundredths

As expected, some expressed this as 5/10 and 0.5. They used five of the ten full ten-frames it takes to cover an entire hundred-frame. Others expressed this as 50/100 and 0.50. They covered the blank hundred-frame with fifty dots. I was listening for these answers.

One student expressed this as 2/4. I assumed he just multiplied both the numerator and denominator of 1/2 by 2. And then he showed me this:

two quarters

One student expressed this as 500/1000 and 0.500. I assumed he was just extending the pattern(s). “Yeahbut where do you see the 500 and 1000?” I asked challenged. “I imagine that inside every one of these *points to a dot* there is one of these *holds up a full ten-frame*,” he explained. As his teacher and I listened to his ideas, our jaws hit the floor.

annotated 500 thousandths

In my previous post, I discussed fractions, decimals, place value, and language. To come full circle, what if we took a closer look at 0.5, 0.50, and 0.500? These are equivalent decimals. That is, they represent equivalent fractions: “five tenths,” “fifty hundreds,” “five hundred thousandths,” respectively. From a place-value-on-the-left-of-the-decimal-point point of view, 0.5 is five tenths; 0.50 is five tenths and zero hundredths; 0.500 is five tenths, zero hundredths, zero thousandths. Equal, right?

Hat Tip: Max Ray‘s inductive proof of Why 2 > 4

Grade 3/4 Fraction Action

Recently, I was invited into three Grade 3/4 classrooms to introduce fractions.

Cuisenaire rods give children hands-on ways to explore the meaning of fractions. After students built their towers, flowers, and robots, I asked, “If the orange rod is the whole, which rod is one half?” Students explained their thinking: “two yellows make an orange.” I emphasized, or rather, students emphasized that the two parts must be equal.

yellow orange

I asked students to find as many pairs as they could that showed one half. I let ’em go and they built and recorded the following:

one half

Once more, with one third:

one third

As children shared their pairs, we discussed the big ideas:

  • the denominator tells how many equal parts make the whole (e.g., two purple rods make one brown rod, three light green rods make one blue rod)
  • the same fraction can describe different pairs of quantities (e.g., one half can be represented using five different pairs, one third can be represented using three different pairs)
  • the same quantity can be used to represent different fractions (e.g., white is one half of red and one third of light green, red is one half of purple and one third of dark green, etc.)

Something interesting and outside the lesson plan happened in each of these three classrooms.

Some students described each pair of rods using equivalent fractions (e.g., 1/2, 2/4, 4/8):

equivalent fractions

I asked the “we’re done” students to represent their own fractions using pairs of rods and determine each other’s mystery fraction. Many students chose fractions like 2/5 or 3/4, not simply unit fractions:

two fifths three quarters

After students shared the three pairs of rods for one third, I asked if anyone found any more. “I did,” said one student, unexpectedly. Check this out:

four twelfths

I asked her why she chose to combine an orange rod and a red rod to make the whole. She explained that twelve can be divided into three equal parts. Without prompting, the rest of the class starting building these:

five fifteenths six eighteenths

adapted from The Super Source

Marriage Problem

Last week, we wrapped up our winter sessions with over 50 elementary school math teams. Part of these sessions are devoted to having teachers work together to solve problems. Having teachers “do the math” helps brings meaning to important topics in mathematics education. We gave the following problem, from Van de Walle:

In a particular small town, 2/3 of the men are married to 3/5 of the women. What fraction of the entire population are married?

This is a challenging problem, but only because traditional algorithms get in the way of sense-making methods. The gut reaction is to do something with common denominators. Time after time, with each group, primary and intermediate. Through questioning, the mistake can be recognized.

“In this context, what does the 15 over here represent?” [points to 10/15]
“The total number of men.”
“And over here?” [points to 9/15]
“The total number of wom–OOOOOh…”

Sometimes, it takes longer to reach an ‘OOOOOh’:

“What does the 10 represent?”
“The number of married men.”
“And the 9?”
“The number of married wom–OOOOOh…”

Once teachers realize that having 10 men married to 9 women is somewhat problematic, most model the problem using colour tiles. Two out of three men being married becomes four out of six and six out of nine. Three out of five women being married is equivalent to six out of ten. Six pairs of husbands and wives can be formed. We have 12 out of 19 people being married.

marriage (concretely)Others think logically to solve the problem. The number of husbands must equal the number of wives. The number of husbands and wives are represented by the numerators.  Therefore, the numerators must be made equal. With all due respect to Dr. Math, it just makes sense.

marriage (pictorially)The use of manipulatives to construct meaning continues to be a focus of teachers involved in the numeracy project, both for themselves and for their students. Long before I became involved in this project, my fellow Numeracy Helping Teachers (Marc Garneau, Selina Millar, Sandra Ball, and Shelagh Lim) worked tirelessly to set a climate in which teachers and students felt comfortable using a variety of manipulatives.

At these sessions, we present teachers with problems, not practice. It’s a pleasure to work with such an amazing group of educators so willing to explore, take risks, and persevere. But as much fun as these sessions with teachers have been, I’m looking forward to the real fun: problem-solving with their students.

Update (2020/01/18)

A much more inclusive context!

The first step in adding fractions is to find a common numerator.

“Okay, listen up! Today’s lesson will be on adding fractions. Let’s start with an easy one like 1/3 + 1/6. The first step is to find a common numerator, which, in this example, we already have. This becomes the numerator of the sum so let’s write a 1 up there. The denominator is, of course, itself a fraction whose numerator is the product of the denominators and whose denominator is the sum of the denominators. This gives us 1/(18/9), or 1/2.

Let’s kick it up a notch and try 2/3 + 1/4. Remember, the first step is to find the lowest common numerator, or LCN. You guys look a little puzzled. You remember learning this in grade 7, right? Since the LCN is 2, we have 2/3 + 2/8. Write a 2 up top. To determine the denominator, simply multiply and add to get 24/11. We have 2/(24/11). This is a tricky one since 24/11 doesn’t reduce nicely. Multiplying the common numerator by the denominator of the denominator gives us 22/24. One more thing… if you don’t reduce to lowest terms, I’ll have to deduct half a mark. 22/24 should be written as 11/12. I’ve typed up some notes. Take one sheet and pass the rest back.”

Christopher Danielson over at OMT shared the method above with me earlier this year. Recently, I presented it to a group of secondary math teachers. Christopher’s algorithm brilliantly initiates conversation about what is important in teaching and learning mathematics. For example, one teacher said “It works. I can prove that it works. But, it doesn’t make sense.” Another asked “It’s quick and easy, but does that matter?”

I think Christopher (@Trianglemancsd) plays it straight when he shows his algorithm to pre-service teachers. I couldn’t pull this off – more of a tongue-in-cheek thing for me. This elicited some (nervous?) laughter as teachers put themselves in the role of their students learning about LCD’s.

This segued to activities that do build conceptual understanding of fraction operations. We looked at:

  • using an area model to represent multiplication,
  • using pattern blocks to explore quotative division, and
  • using a common denominator to divide fractions.

These last two are connected… more on this later.