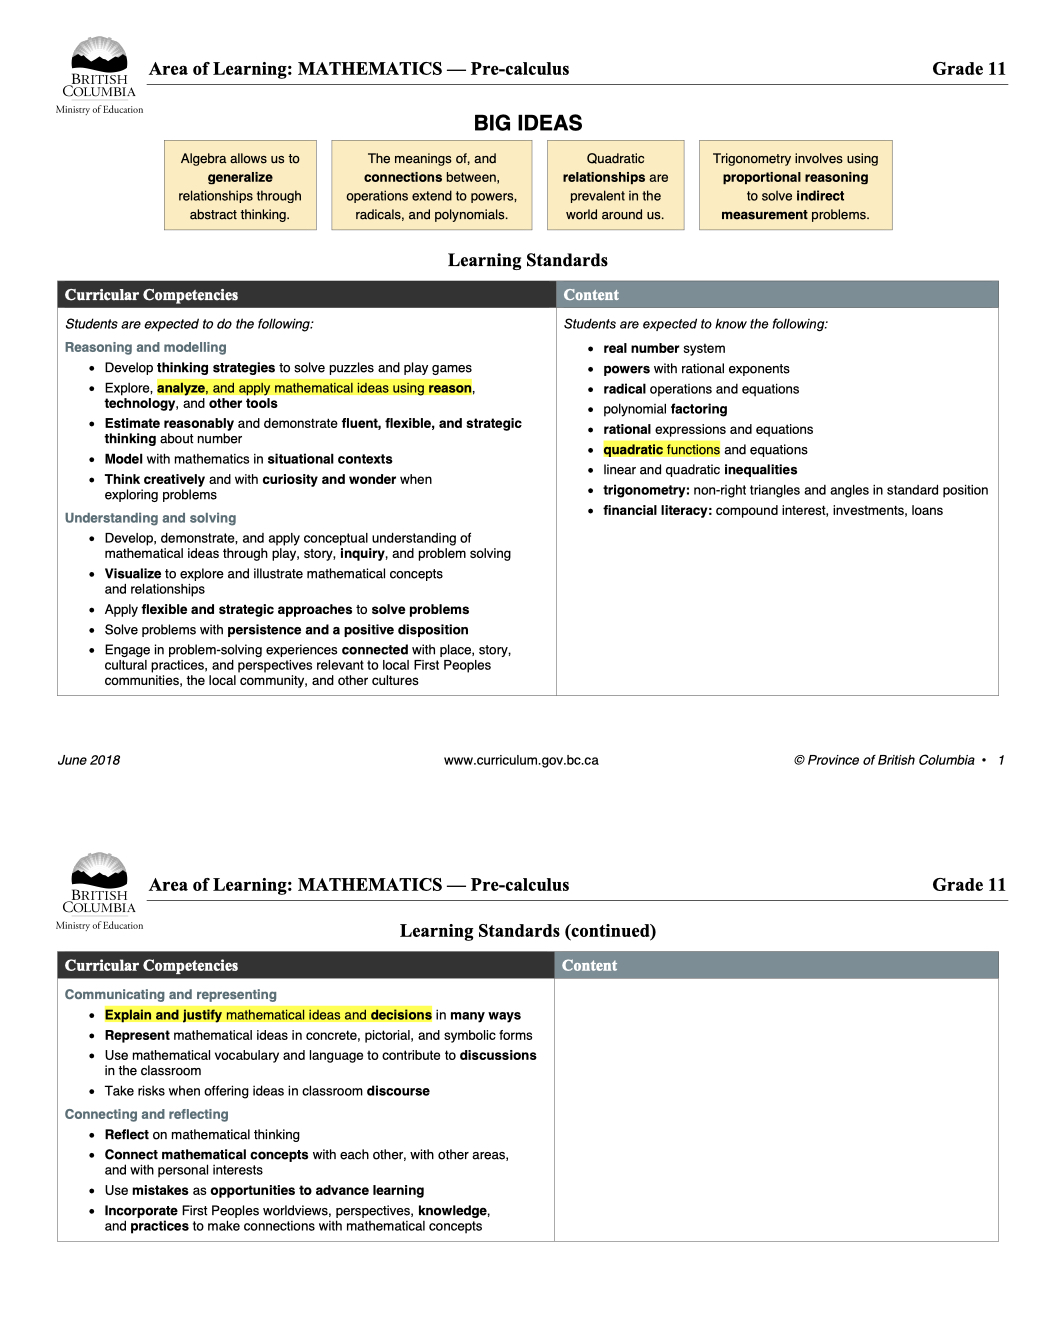
- Writing Learning Standards
- Constructing Proficiency Scales
- Designing Assessment Items
- Determining Grades
Determining Grades
It’s time to report out. How would you translate the following into a proficiency level, letter grade, or percentage? What would you assign to Aaron, Blake, and Denise?

If your reporting policy requires a proficiency level (e.g., Grades K-9 in BC), analyze the data and make a judgement. To me, Aaron has demonstrated Extending, Denise Developing. Blake has also demonstrated Developing. Or Partial. I’m waffling.
What if this was your gradebook for Math 10? In BC, you may use proficiency scales but must provide letter grades and percentages. In this post, I’ll propose a solution–admittedly flawed–to this problem. But first, a bit about why this is a problematic practice…
Percentage Problems
Think of a student who has achieved 80% in Math 10. Describe their level of performance.
Got it? Great! Now do 79% and 81%.
Don’t stop! Finish the Bs.

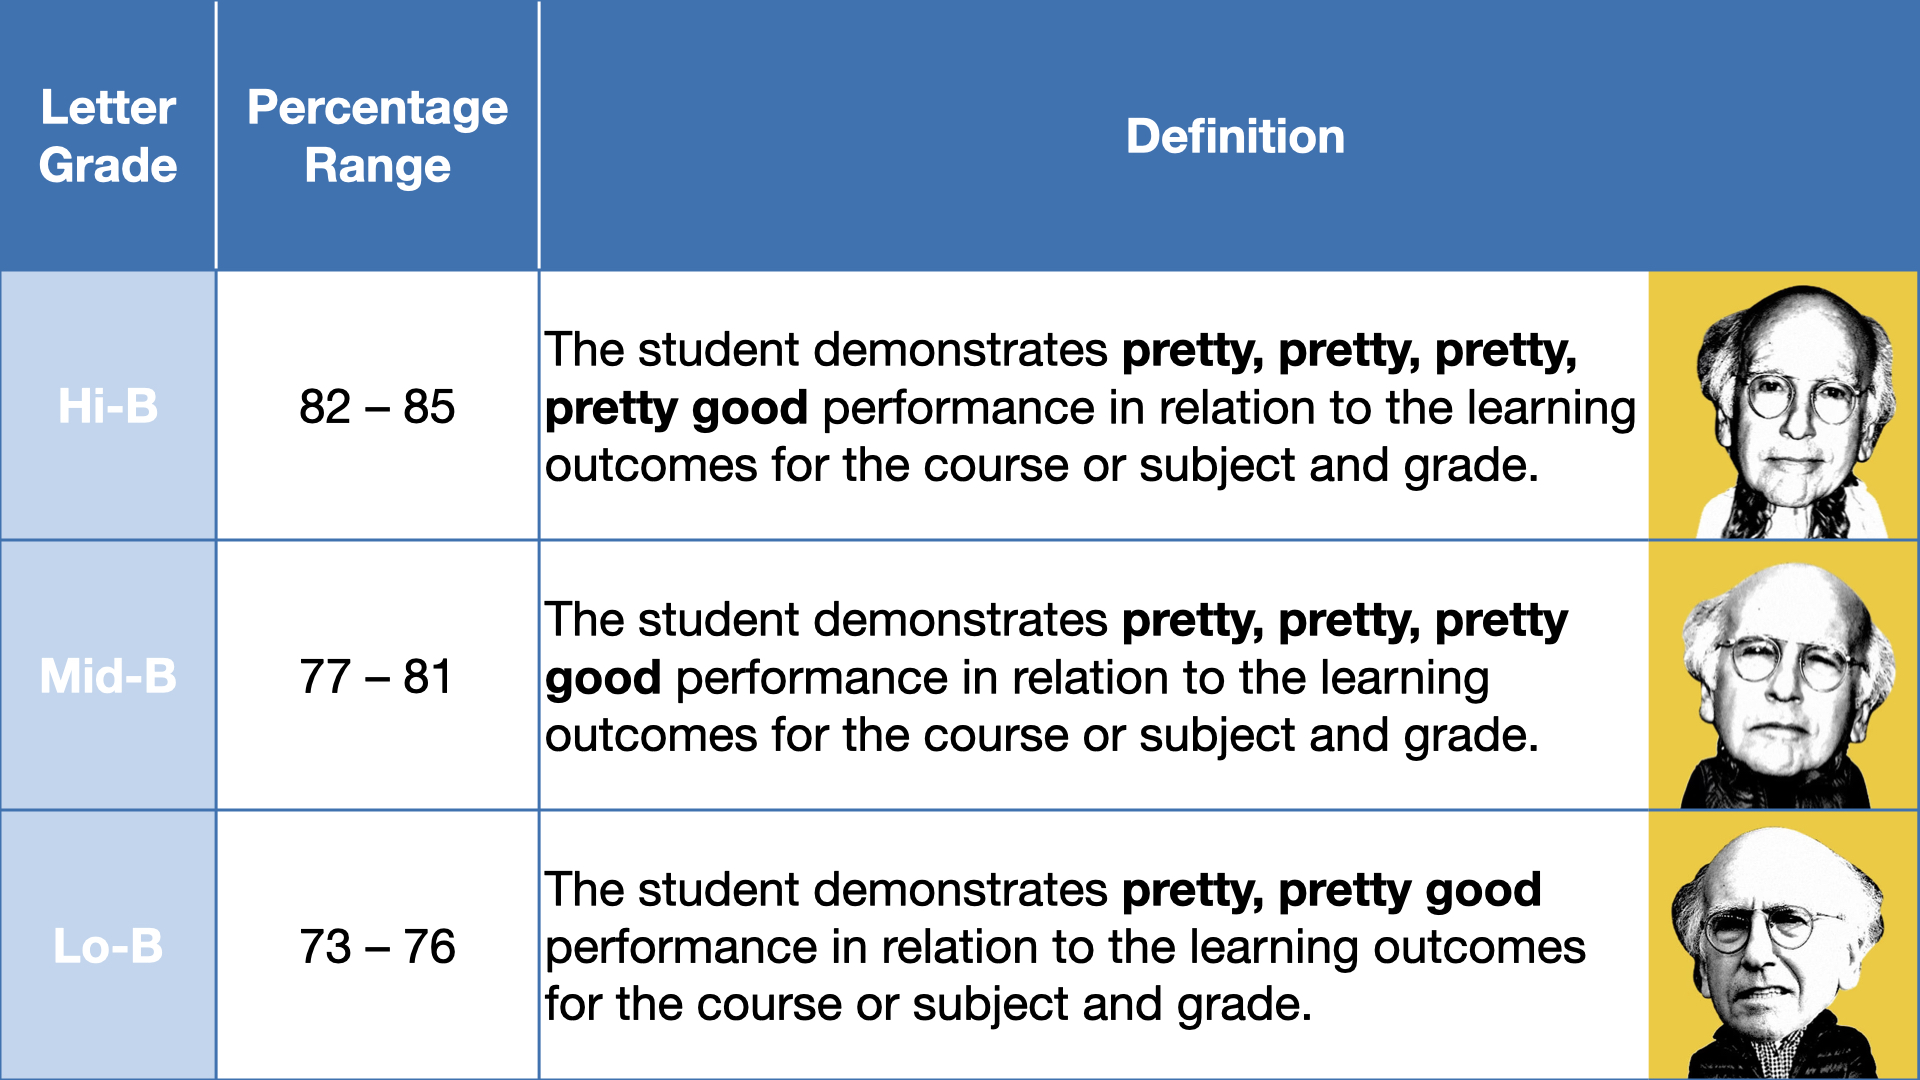
A letter grade and percentage mandate suggests a difference between 73% and 85%–both Bs in BC. Quantitatively? Sure. In the point-gathering paradigm, 73% leaves almost twice as many points on the table as 85% (i.e., the “Lo-B, Hi-B” refrain).

But qualitatively? Not really. See the Ministry of Education’s letter grade definitions:

Policy Development Background & Rationale Document (PDF)
There are not thirteen (85 − 73 + 1) variations on very good. Three is a stretch:
Extend the table. Write distinctly different descriptors of all levels, from 86% up to 100%, 72% down to 0%.
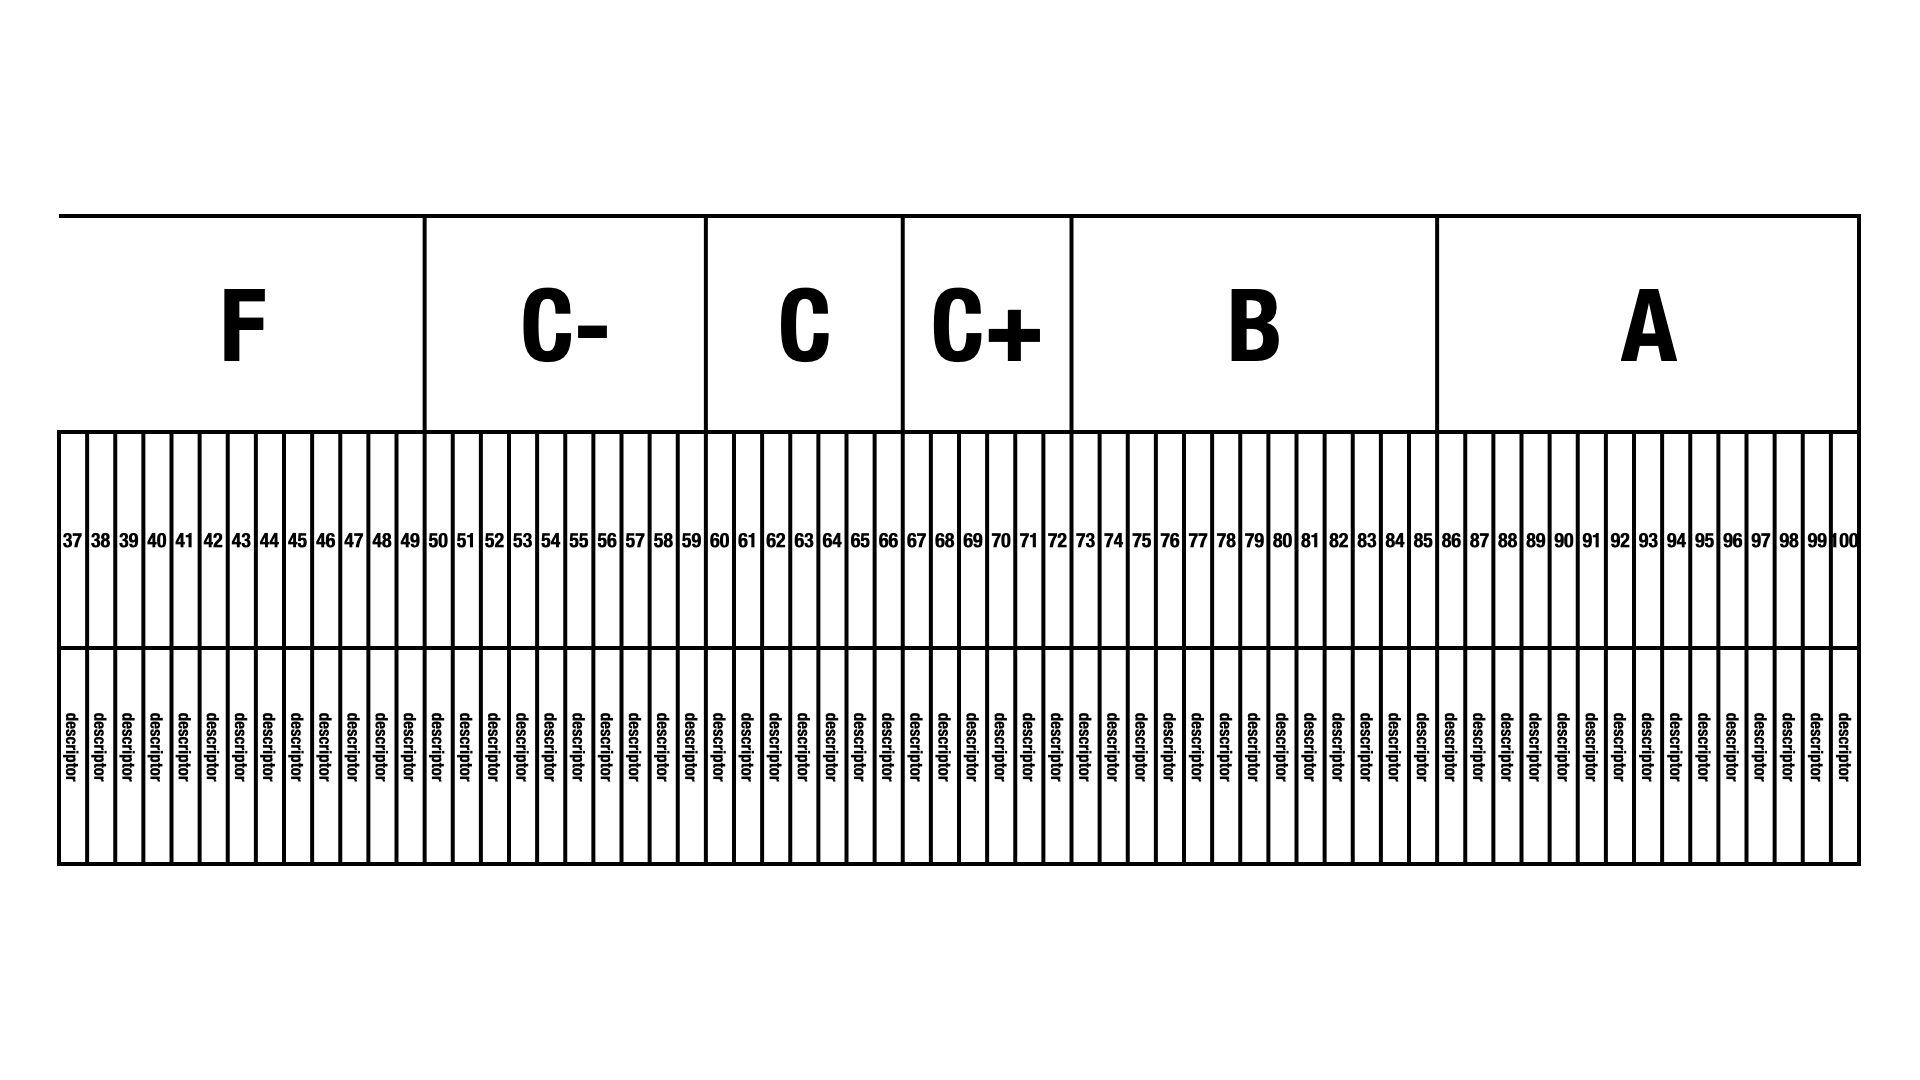
You can’t. Whereas letter grades differentiate six levels of performance, percentages differentiate one hundred one. No teacher can be that precise (or accurate). Like objectivity and consistency, precision is a myth.
Standards-based assessment is not designed to produce percentages. Proficiency scales are not numbers! Still, teachers–of Grades 10-12 only–are required to report out a number. So, holding my nose…
Imperfect Solutions
🔴 1-2-3-4
To turn the data into a number, values need to be assigned to proficiency levels (e.g., Emerging = 1, Developing = 2, Proficient = 3, Extending = 4). Students receive a value on each outcome. The numerator takes together these values from all of the outcomes; the denominator is the greatest sum that is possible. Aaron, Blake, and Denise receive 83% (B), 63% (C), and 48% (F), respectively.

This feels… off. Denise demonstrated partial (Developing) or complete (Proficient) understanding of seven of ten learning outcomes. Nevertheless, she is failing. This is because a 1-2-3-4 scale is harsh. One-out-of-four (i.e., 25%) for Emerging isn’t just a failing grade; it’s an unforgiving one. Also, two-out-of-four (i.e., 50%) for Developing leaves no wiggle room. Developing is more than a minimal pass.
🟡 2-3-4-5
A 2-3-4-5 scale feels more accurate. Aaron, Blake, and Denise now receive 86% (A), 70% (C+), and 58% (C-), respectively.
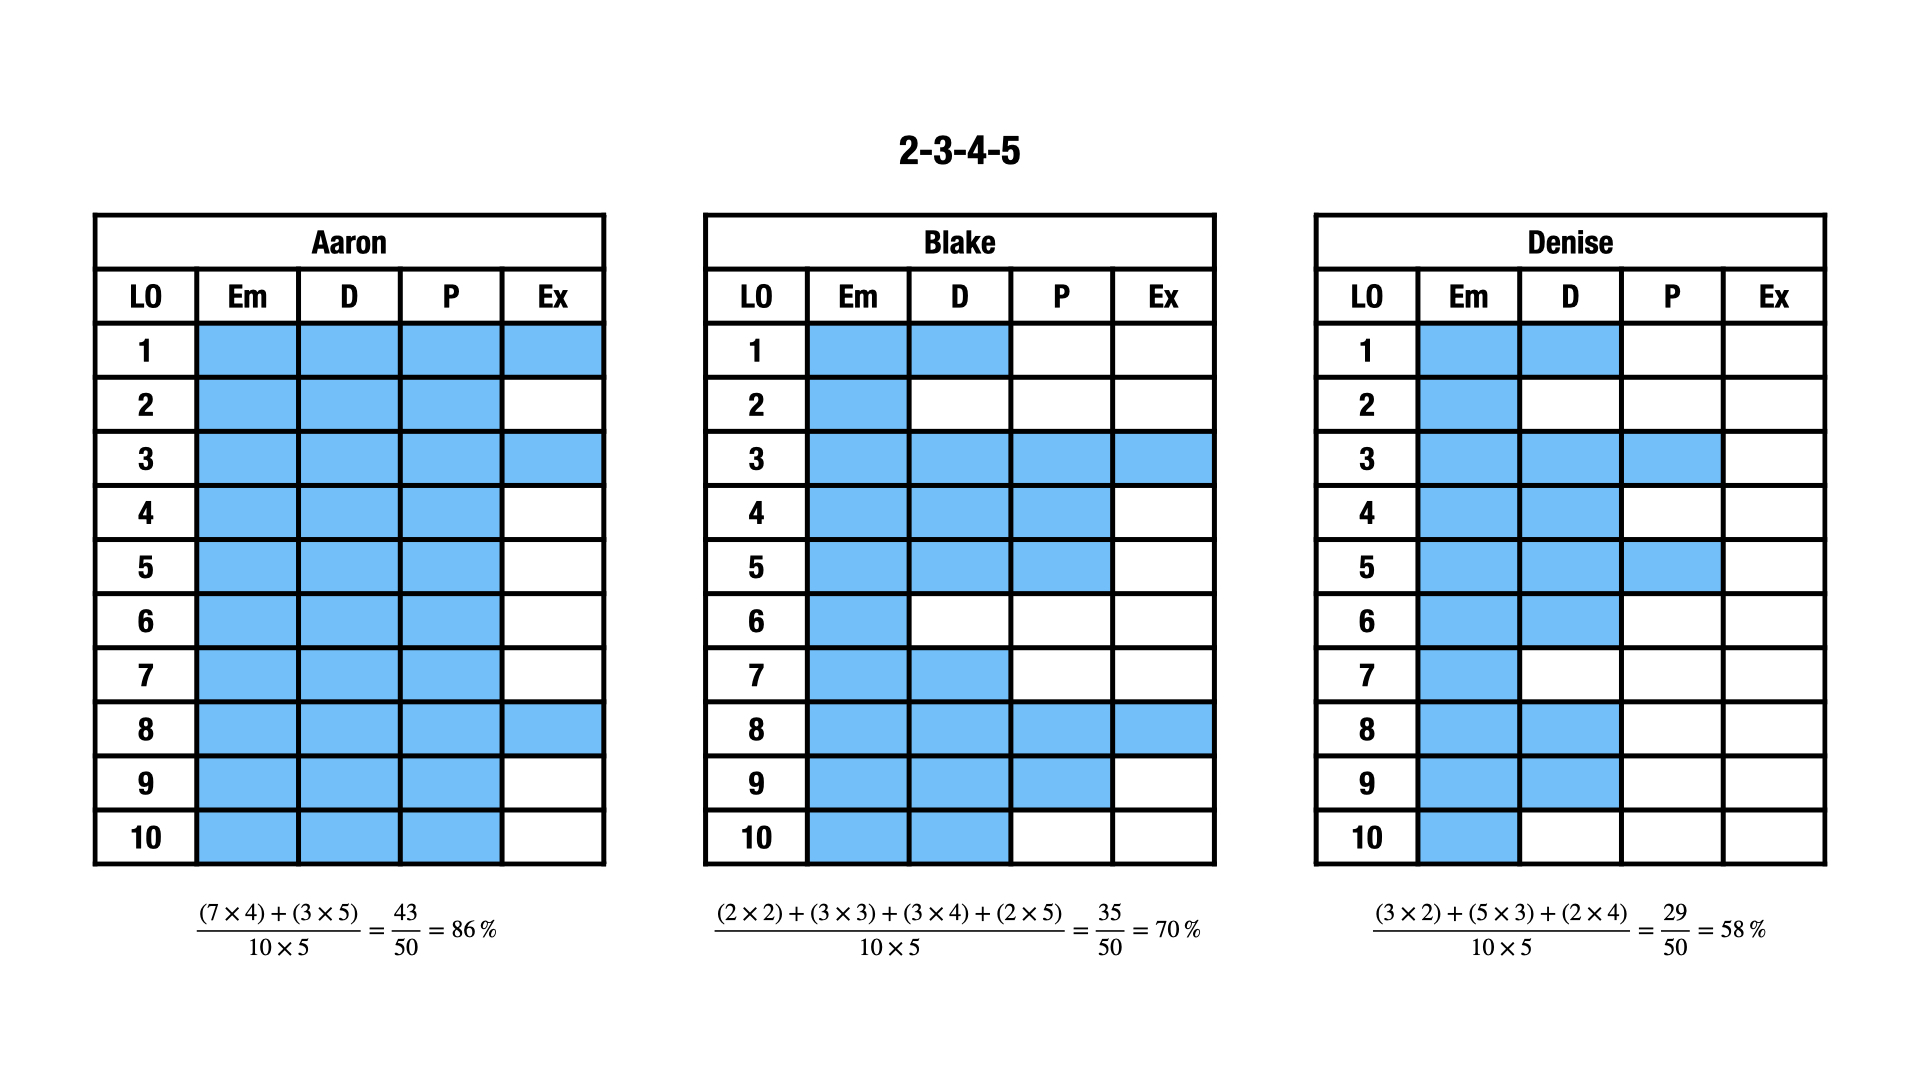
Note that Denise is now passing. I really like the example of Aaron since it illustrates that Extending is not “the new A.” To achieve an A, Aaron demonstrated Proficient in all, Extending in (just) a few. Further, Blake’s C+ feels fair. To “award” Blake a B, I’d want to see additional evidence of their proficiency (i.e., new data points at Developing in outcomes 2 or 6 or Proficient in outcomes 1, 7, or 10).
If 2-3-4-5 doesn’t work, play with 3-4-5-6. Or 46-64-85-100. And if you want to give some outcomes more weight than others, do so. For example, you can double values from solve systems algebraically.
Averaging
Conversations about averaging do not always offer nuance. The takeaway can be that averaging is just… wait for it… mean. Averaging across different outcomes–see above–is more than okay. It’s averaging within the same outcome that can be punitive. Let’s revisit the gradebook:
For the sake of simplicity, I skipped a crucial step. These letters are not single data points. For example, prior to “it’s time to report out,” Denise’s “P” on the third learning outcome might have been “Em, Em, D, P, P.” Averaging would drag Denise down to Developing; she’d be stuck to her initial struggles. In the end, Denise demonstrated–successively–a Proficient level of understanding in relation to this learning outcome. That’s what matters, that’s what counts.
The fact that she didn’t know how to do something in the beginning is expected–she is learning, not learned, and she shouldn’t be punished for her early-not-knowing.
Peter Liljedahl, 2020, p. 258
* * ** *** ***** ******** *************
Marc has extended my understanding of assessment and this blog series reflects our collective thinking. Check out his assessment video from BCAMT!