[SBA] Writing Learning Standards

For several years, standards-based assessment (SBA) has been the focus of much of my work with Surrey teachers. Simply put, SBA connects evidence of student learning with learning standards (e.g., “use ratios and rates to make comparisons between quantities”) rather than events (“Quiz 2.3”). The change from gathering points to gathering data represents a paradigm shift.

In this traditional system, experience has trained students to play the game of school. Schools dangle the carrot (the academic grade) in front of their faces and encourage students to chase it. With these practices, schools have created a culture of compliance. Becoming standards based is about changing to a culture of learning. “Complete this assignment to get these points” changes to “Complete this assignment to improve your learning.” […] Educators have trained learners to focus on the academic grade; they can coach them out of this assumption.

Schimmer et al., 2018, p. 12

In this series, I’ll describe four practices of a standards-based approach:

  1. Writing Learning Standards
  2. Constructing Proficiency Scales
  3. Designing Assessment Items
  4. Determining Grades

Writing Learning Standards

In BC, content learning standards describe what students know and curricular competency learning standards describe what students can do. Describe is generous–more like list. In any mathematical experience a student might “bump into” both content and competency learning standards. Consider Nat Banting’s Quadratic Functions Menu Math task:

Think about the following ten “design specifications” of quadratic functions:

A.Two negative x-interceptsB.Vertex in quadrant II
C.Never enters quadrant IIID.Vertex on the y-axis
E.Positive y-interceptF.No x-intercepts
G.Never enters quadrant IH.Has a minimum value
I.Horizontally stretchedJ.Line of symmetry enters quadrant IV

You could build ten different quadratic functions to satisfy these ten different constraints.

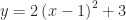
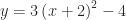
Instead, build a set of as few quadratic functions as possible to satisfy each constraint at least once. Write your functions in the form y = a(x − p)2 + q.

Which constraints pair nicely? Which constraints cannot be paired?

Is it possible to satisfy all ten constraints using four, three, or two functions?

Describe how and why you built each function. Be sure to identify which functions satisfy which constraints.

Students activate their knowledge of quadratic functions. In addition, they engage in several curricular competencies: “analyze and apply mathematical ideas using reason” and “explain and justify mathematical ideas and decisions,” among others. Since the two are interwoven, combining competencies and content (i.e., “reason about characteristics of quadratic functions”) is natural when thinking about a task as a learning activity. However, from an assessment standpoint, it might be helpful to separate the two. In this series, I will focus on assessing content.

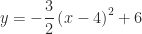
The content learning standard quadratic functions and equations is too broad to inform learning. Quadratic functions–nevermind functions and equations–is still too big. A student might demonstrate Extending knowledge of quadratic functions in the form y = a(x − p)2 + q but Emerging knowledge of completing the square, attain Proficient when graphing parabolas but Developing when writing equations.

Operations with fractions names an entire unit in Mathematics 8. Such standards need to be divided into subtopics, or outcomes. For example, operations with fractions might become:

  1. add and subtract fractions
  2. multiply and divide fractions
  3. evaluate expressions with two or more operations on fractions
  4. solve contextual problems involving fractions

Teachers can get carried away breaking down learning standards, differentiating proper from improper fractions, same from different denominators, and so on. These differences point to proficiency levels, not new outcomes. Having too many subtopics risks atomizing curriculum. Further, having as many standards as days in the course is incompatible with gathering data over time. I aim for two to four (content) outcomes per unit.

In Foundations of Mathematics and Pre-calculus 10, systems of linear equations can be delineated as:

  1. solve graphically
  2. solve algebraically
  3. model and solve contextual problems

My solve algebraically includes both substitution and elimination. Some of my colleagues object to this. No worries, separate them.

In my next post, I’ll describe constructing proficiency scales to differentiate complexity levels within these learning standards. Here’s a sneak peek:

What do you notice?

Wanted Parabola

As much as I love mathematical modelling, so much of Math 10 to 12 is contextless stuff like this:

Determine an equation of a quadratic function with vertex at (-5, 3), passing through the point (-7, 15).

Lately I’ve been looking for activities that address this sort of naked math yet engage learners in processes similar to those in a mathematical modelling cycle.

Consider the exercise above. What questions could you ask? If I were to ask a student about their equation, I’m likely to hear play-by-play, not colour commentary: “… and then I plugged -7 and 15 in y = a(x + 5)² + 3. Negative seven plus five is two…”

Instead, I could have students try to figure out a quadratic function that satisfies a set of criteria, gradually revealed to them as “clues.” Throughout, students would check their quadratic functions and make changes when necessary. This is the gist of Wanted Parabola, my adaptation of Cathy Marks Krpan’s Wanted Number:

I started with a very general clue: the direction of opening. I anticipated a variety of parabolas, which I got when I tried this activity out with math teachers in my district. When I tried this activity out in the MathTwitterBlogoSphere (#MTBoS), I got a bunch of y = x²s. The biggest difference was that my colleagues were invited to draw a parabola (on whiteboards) whereas my tweeps were asked to write an equation (in a Desmos activity). It’s interesting to think about this activity in terms of freedom and constraints. When I revealed the next clue, it pushed my colleagues’ thinking together. However, from my tweeps, it triggered new and diverse ideas, simulated here:

I like this as a blank-page (or whiteboard) activity but a Desmos activity (1, 2, 3) does provide the opportunity to talk about some interesting overlays. If using vertical non-permanent surfaces (#VNPS), I’d stop partway through to hold a “board meeting” where students would share possible parabolas.

In general, I progressed from providing more general to more specific clues. For example, “vertex in QII” divulges p < 0 before “axis of symmetry x = -5″ gives away p = -5. Most clues add new information and move students closer to the Wanted Parabola. Some confirm earlier decisions. For example, “vertex (-5, 3)” before “axis of symmetry x = -5″ and “minimum value of 3.” This last clue is anticlimactic. An earlier clue, “never enters QIII,” is much more interesting. It might feel like new information. But it must be true given preceding clues; a parabola that opens up and has no x-intercepts cannot contain points in QIII (or QIV).

You can play with the order of the clues. A second Wanted Parabola:

Here, the direction of opening clue is revealed midway through the set. It doesn’t add new information but is reasoned to through “two x-intercepts” and “vertex in QI.” I meant to delay students determining the direction of opening a bit, hoping to surprise them after a few clues. In a third Wanted Parabola, “passes through” is the first clue; I anticipate that some students will place the vertex at this point.

Instead of “How did you find a?” you could ask “Which clues were helpful? Which clues were necessary?” In my mind, helpful ≠ necessary. A clue might be helpful if it pushes students in the direction of the Wanted Parabola despite not providing the values of a, p, or q. Or a clue might be helpful if it tells students that they’re on the right track. In the way that the first Wanted Parabola plays out, three pieces of information are necessary (to determine three unknowns): “minimum value of 3,” “axis of symmetry x = -5,” and “passes through (-7, 15).” If some students don’t argue that only two clues are necessary — “vertex (-5, 3)” and “passes through (-7, 15)” — you could ask “What is the fewest number of clues you need?”

This activity helps students develop an understanding of the different attributes parabolas can have. It provides an opportunity for students to solve problems, reason, explain, justify, and connect mathematical ideas in ways that “Determine an equation…” does not.

Wanted Parabola (.pptx) (.pdf)

References

Marks Krpan, Cathy (2013). Math expressions: developing student thinking and problem solving through communication. Toronto, ON: Pearson Canada.

Update

Quadratic Patterns

Having students write an equation that describes a pattern involving toothpicks, pattern blocks, or colour tiles is nothing new. However, students (teachers?) often focus on patterns in the table of values rather than properties of the pattern itself. Visualizing the pattern can help students write the equation. For some, this approach may be new.

For example, consider the following pattern:

In each figure, students may see a rectangle with two squares attached, one above and one below. That rectangle has a width of n and a length of n + 2. The expression is n(n + 2) + 2.

Some students may see the pattern in a different way. But what about the students who don’t see anything? For them, some scaffolding is necessary. Note the scaffolding in the pattern below.

Students may see one red square, two green rectangles, and two blue tiles in each figure. That is, they see n^2 + 2n + 2. The use of colour is intended to be helpful. Of course, some students may ignore this hint. I’m cool with that. They may see a large square with one tile attached, or (n + 1)^2 + 1.

Again, look for the scaffolding in the pattern below.

Students may see a rectangle with a number of tiles being removed, as suggested by the dotted lines. That rectangle has a width of n + 1 and a length of n + 2. The number of tiles being removed is equal to the figure number. Alternatively, students may visualize  2(n + 1) + n^2.

Did you notice that each of the expressions above are equivalent? They must be. Each of the three patterns begin with 5, 10, and 17 tiles. Each pattern/expression tells the same story, but in a different way.

My goal was to design three parallel tasks. Have students choose one of the three representations… just don’t tell them they’re the same.

My three-part lesson plan:

Marc and I created two more sets of patterns. All three:

For more, please see Fawn Nguyen’s Pattern Posters.

One of these things is not like the others

When you read the title of this post, did you think Sesame Street? Foo Fighters? Or, like me, both?

Recently, Geoff shared seven (sneaky) activities to get students talking mathematically. One activity, ‘odd one out’, involves having students pick the one mathematical thing that doesn’t belong. This reminds me of one strategy used by Dr. Marian Small to create open questions – asking for similarities and differences.

Here’s my ‘odd one out’ question:

Which of the following quadratic functions doesn’t belong? (Dr. Small might ask “Which of these four functions are most alike?”)
y=2\left( x-1\right) ^{2}+3
y=\dfrac {1} {2}\left( x-3\right) ^{2}-5
y=3\left( x+2\right) ^{2}-4
y=-\dfrac {3} {2}\left( x-4\right) ^{2}+6

Students might say,
y=2\left( x-1\right) ^{2}+3 because it does not cross the x-axis
y=\dfrac {1} {2}\left( x-3\right) ^{2}-5 because it is a vertical compression of y = x²
y=3\left( x+2\right) ^{2}-4 because it is a horizontal translation to the left
y=-\dfrac {3} {2}\left( x-4\right) ^{2}+6 because it opens down

Do the graphs of these functions strengthen your choice or make you change your mind?

I carefully chose the values of ap, and q in y = a(x – p)² + q so that students could reasonably argue that any one of the functions could be picked as the odd one out. Because I am not looking for one particular answer, each student should be able to confidently answer the question and contribute to a mathematical discussion. Planning disagreement is key; it means students will have to justify their mathematical thinking.

Sneaky.

Revisiting Pictorial Representations of Functions

The K-7 word walls were developed by my Numeracy Helping Teacher colleagues to help students and teachers communicate mathematically. They were not meant to ‘teach’ concepts but to help make visual and conceptual connections. The cards have been very popular with Surrey teachers. The Math 8 cards have been created and we will be sharing them with Surrey secondary teachers starting in September.

See the sample cards to the right. In an earlier post, I mentioned how concrete and pictorial representations of linear functions can enhance understanding. For example, in the expression 2n + 1, the coefficient of 2 can be interpreted as adding 2 tiles as the pattern continues.

The coefficient can also be visualized in another way. It may be easier to describe by looking at the card for constant. In the first figure, we can see two groups of one (one white square above the red square and one white square to the right of the red square). In the second figure, we can see two groups of two (one group of two white squares above the red square and one group of two white squares to the right of the red square). Similarly, in the third figure, we can see two groups of three. Finally, in the nth figure, there will be n groups of 2, or 2n, white tiles.

This can also be an interesting investigation when teaching quadratic functions (or a challenging extension when teaching linear functions). In the pattern to the right, the red squares in the first figure make a 2-by-3 rectangle. The red squares in the second figure make a 3-by-4 rectangle. We can see a 4-by-5 rectangle in the third figure. In the nth figure, there will be a rectangle with width n and length n + 1 . In each figure, there are also two white squares. Therefore, the expression is n(n + 1) + 2.

This pattern, too, can be be visualized in another way. For example, in each figure, the red tiles can be seen as being made up of a square and a rectangle. In the first figure, we can see 2 squares on top of a 2-by-2 square. In the second figure, we can see 3 squares on top of a 3-by-3 square, and so on. In the nth figure, there will be n squares on top of an n-by-n square. Remembering the 2 white squares, the expression is n^2 + n + 2.

The two expressions are equivalent but reflect different ideas.

How do you know that a relationship is linear? quadratic?
How are the pictorial representations of linear and quadratic functions the same? different?

To see more on this approach, visit I Hope This Old Train Breaks Down.

One more thing… I purposely did not circle the groups and shapes discussed above… I didn’t want to take away the fun of visualizing them for yourself.