It’s time to report out. How would you translate the following into a proficiency level, letter grade, or percentage? What would you assign to Aaron, Blake, and Denise?
Gradebook at time of first Learning Update
If your reporting policy requires a proficiency level (e.g., Grades K-9 in BC), analyze the data and make a judgement. To me, Aaron has demonstrated Extending, Denise Developing. Blake has also demonstrated Developing. Or Partial. I’m waffling.
What if this was your gradebook for Math 10? In BC, you may use proficiency scales but must provide letter grades and percentages. In this post, I’ll propose a solution–admittedly flawed–to this problem. But first, a bit about why this is a problematic practice…
Percentage Problems
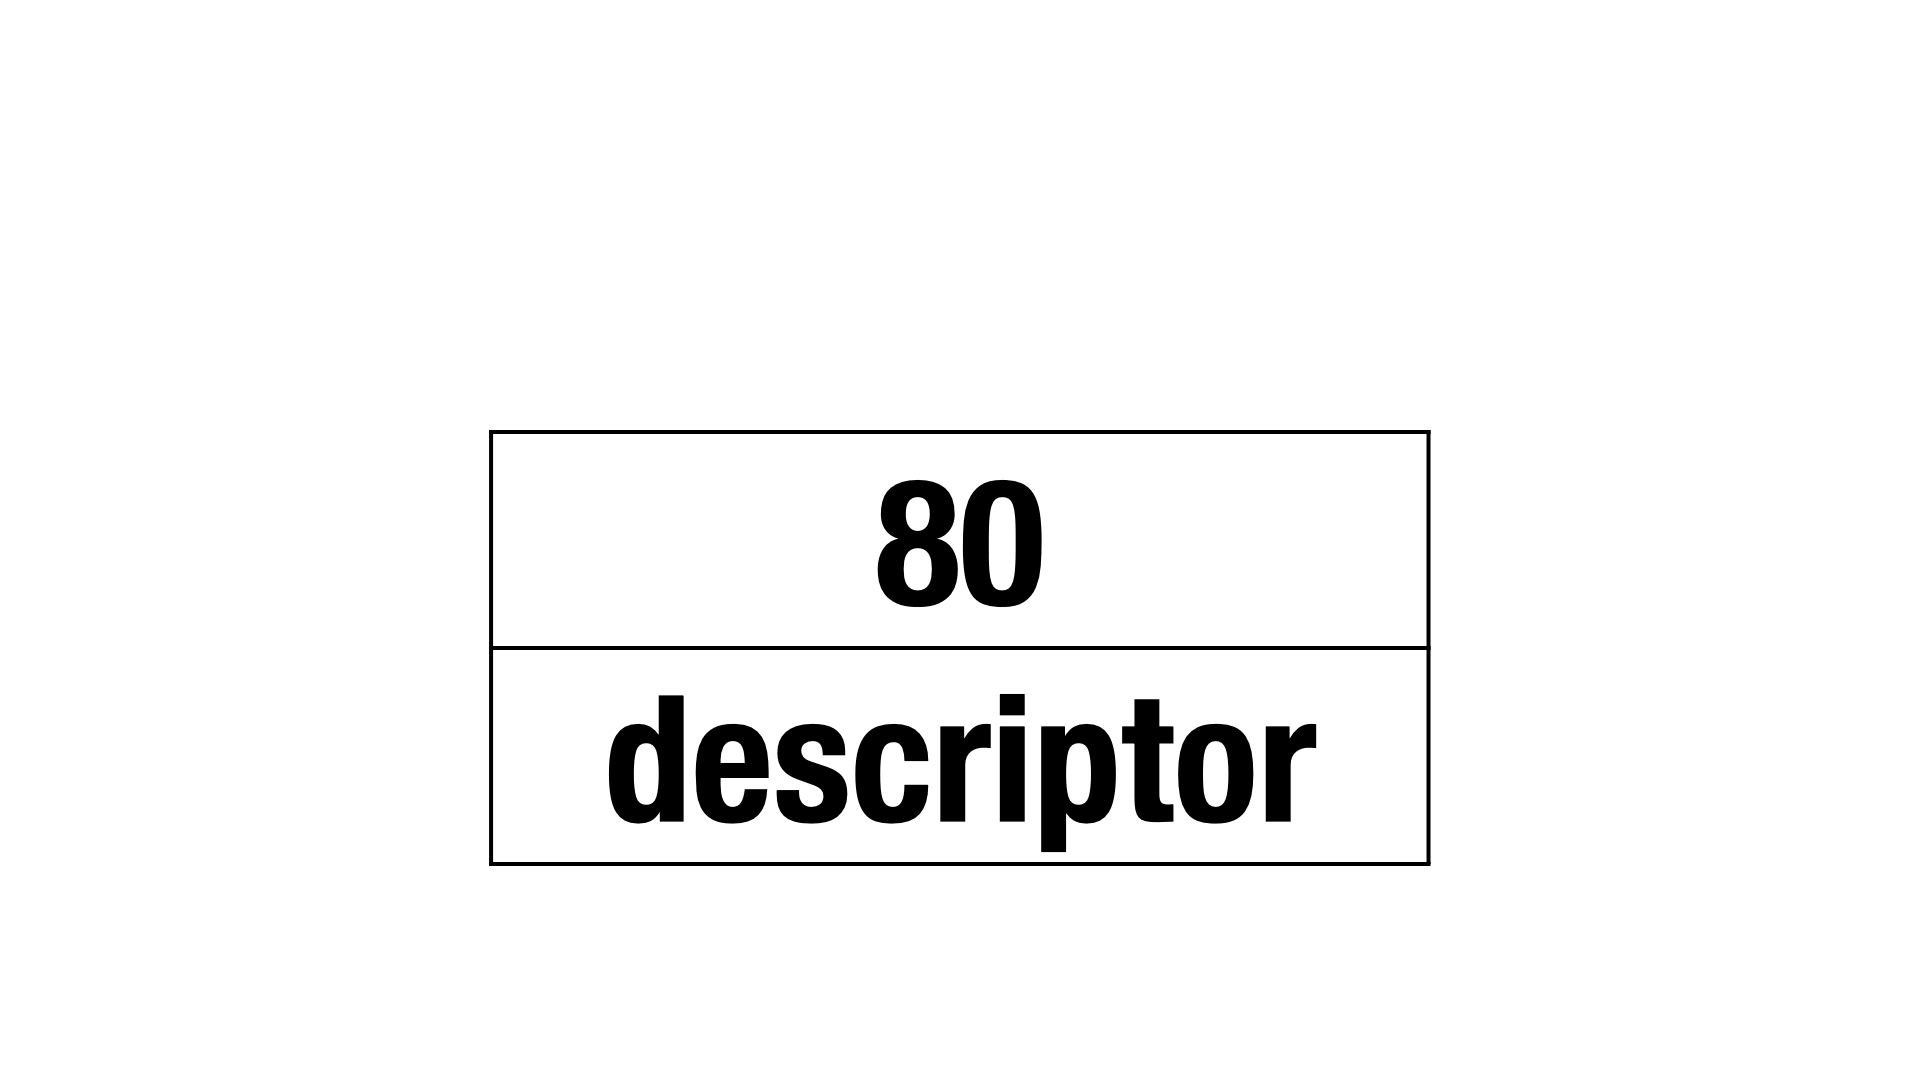
Think of a student who has achieved 80% in Math 10. Describe their level of performance.
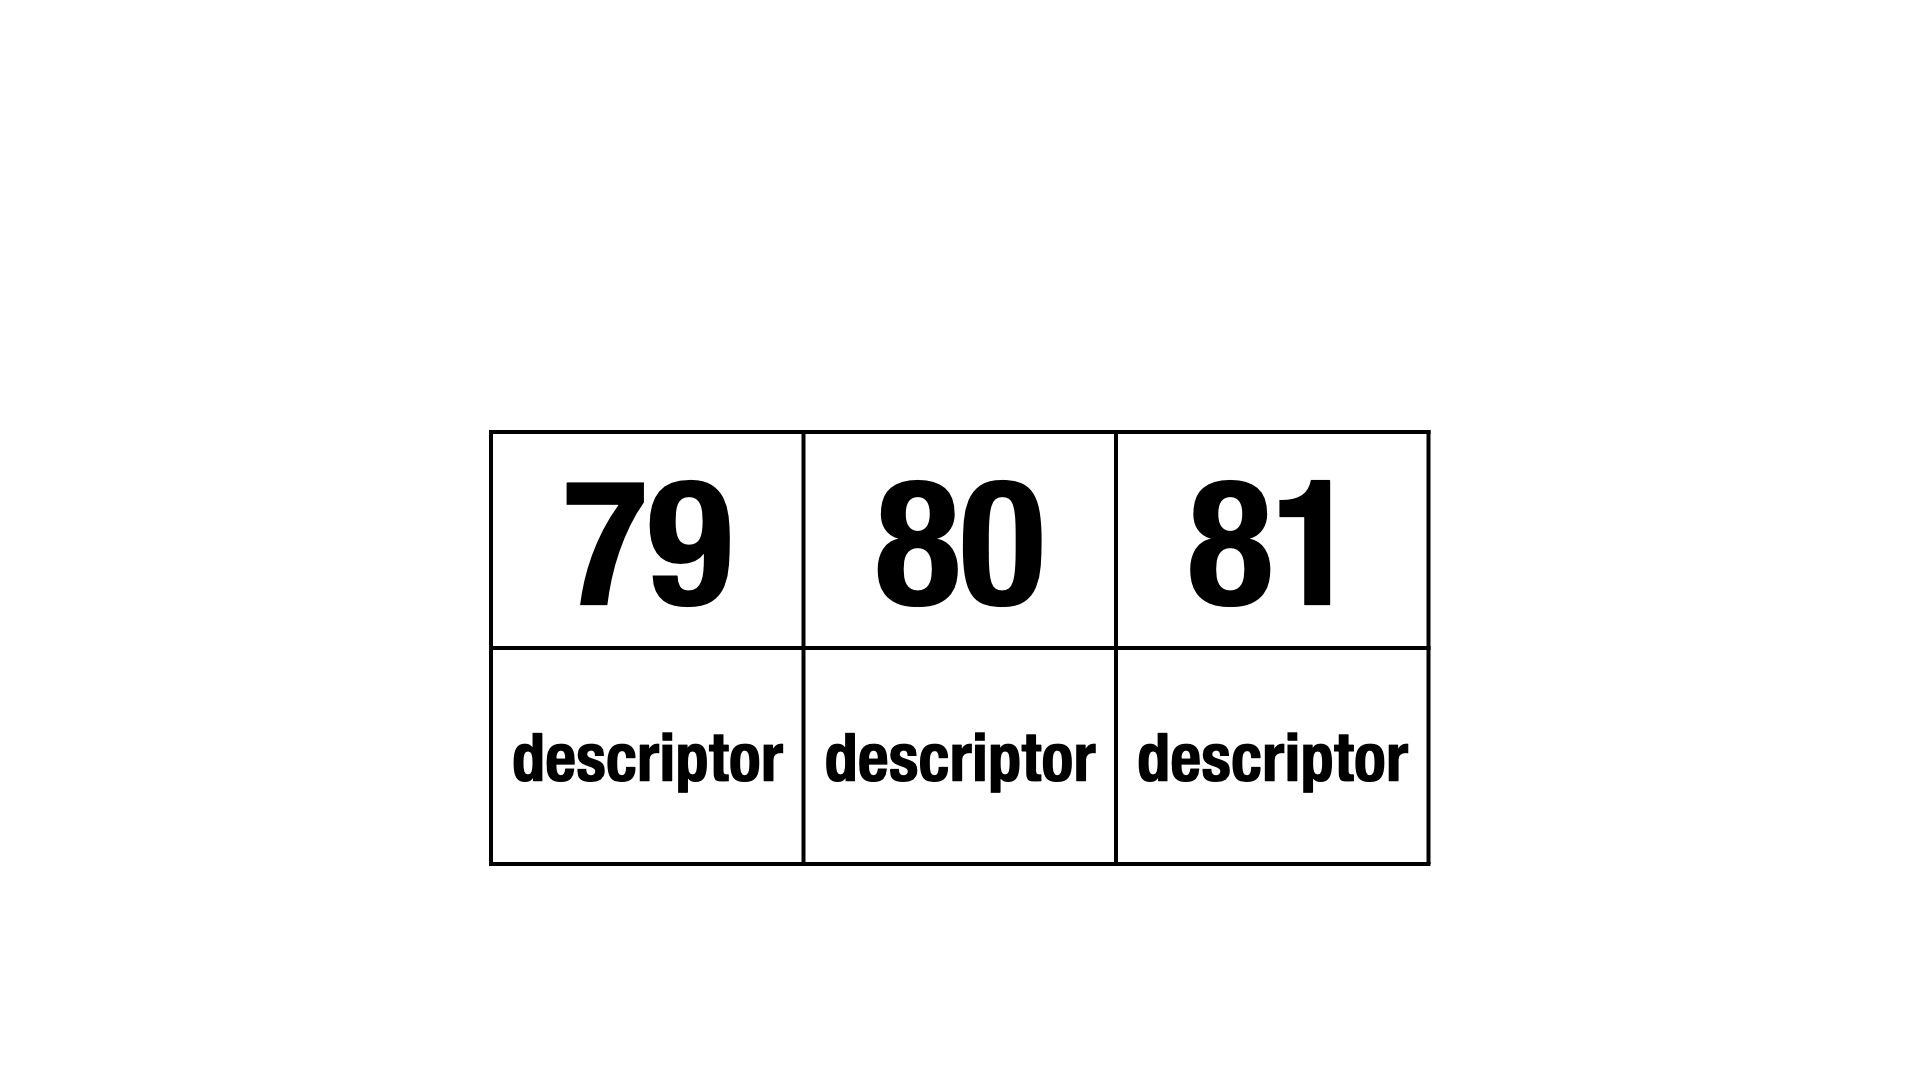
Got it? Great! Now do 79% and 81%.
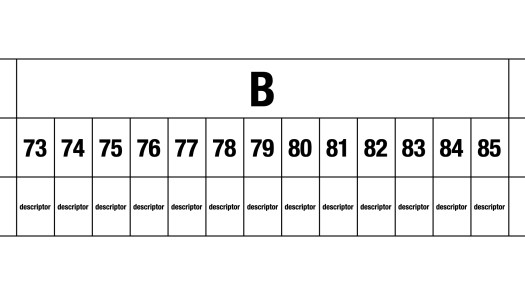
Don’t stop! Finish the Bs.
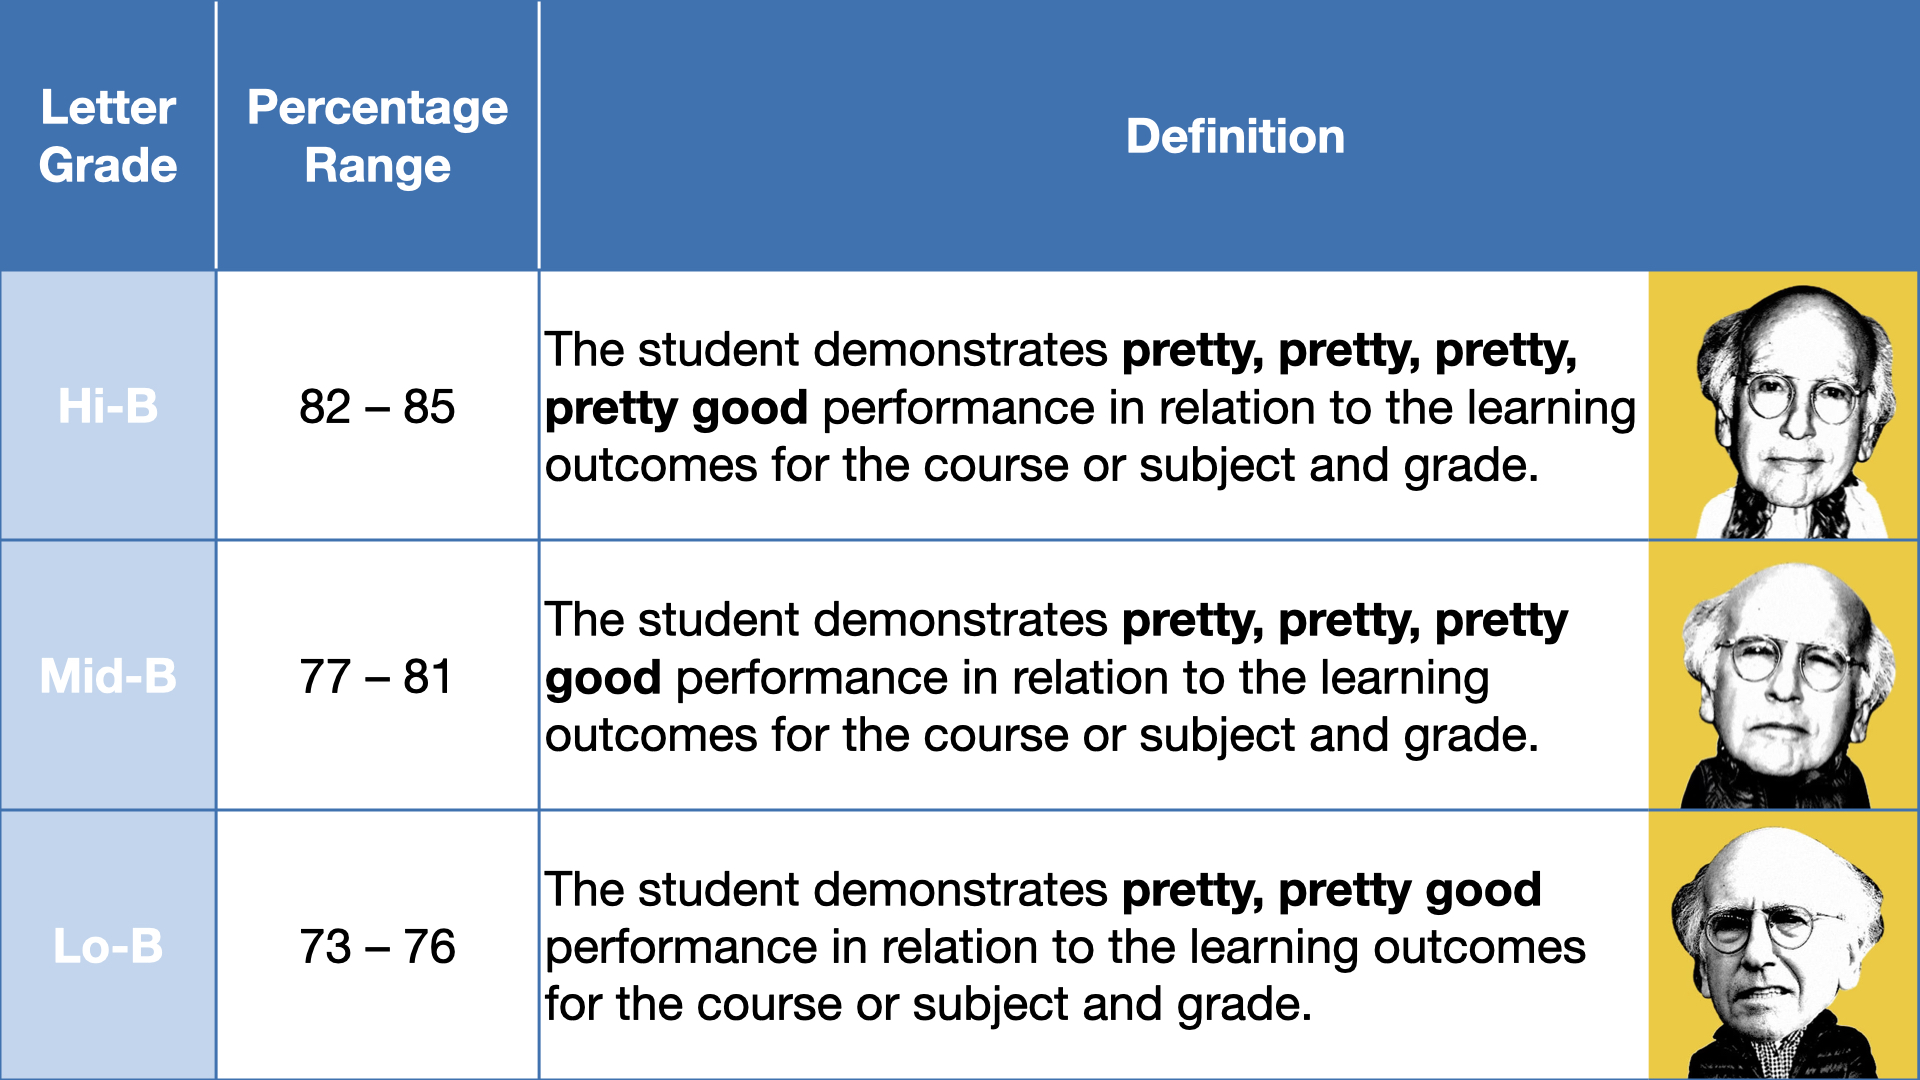
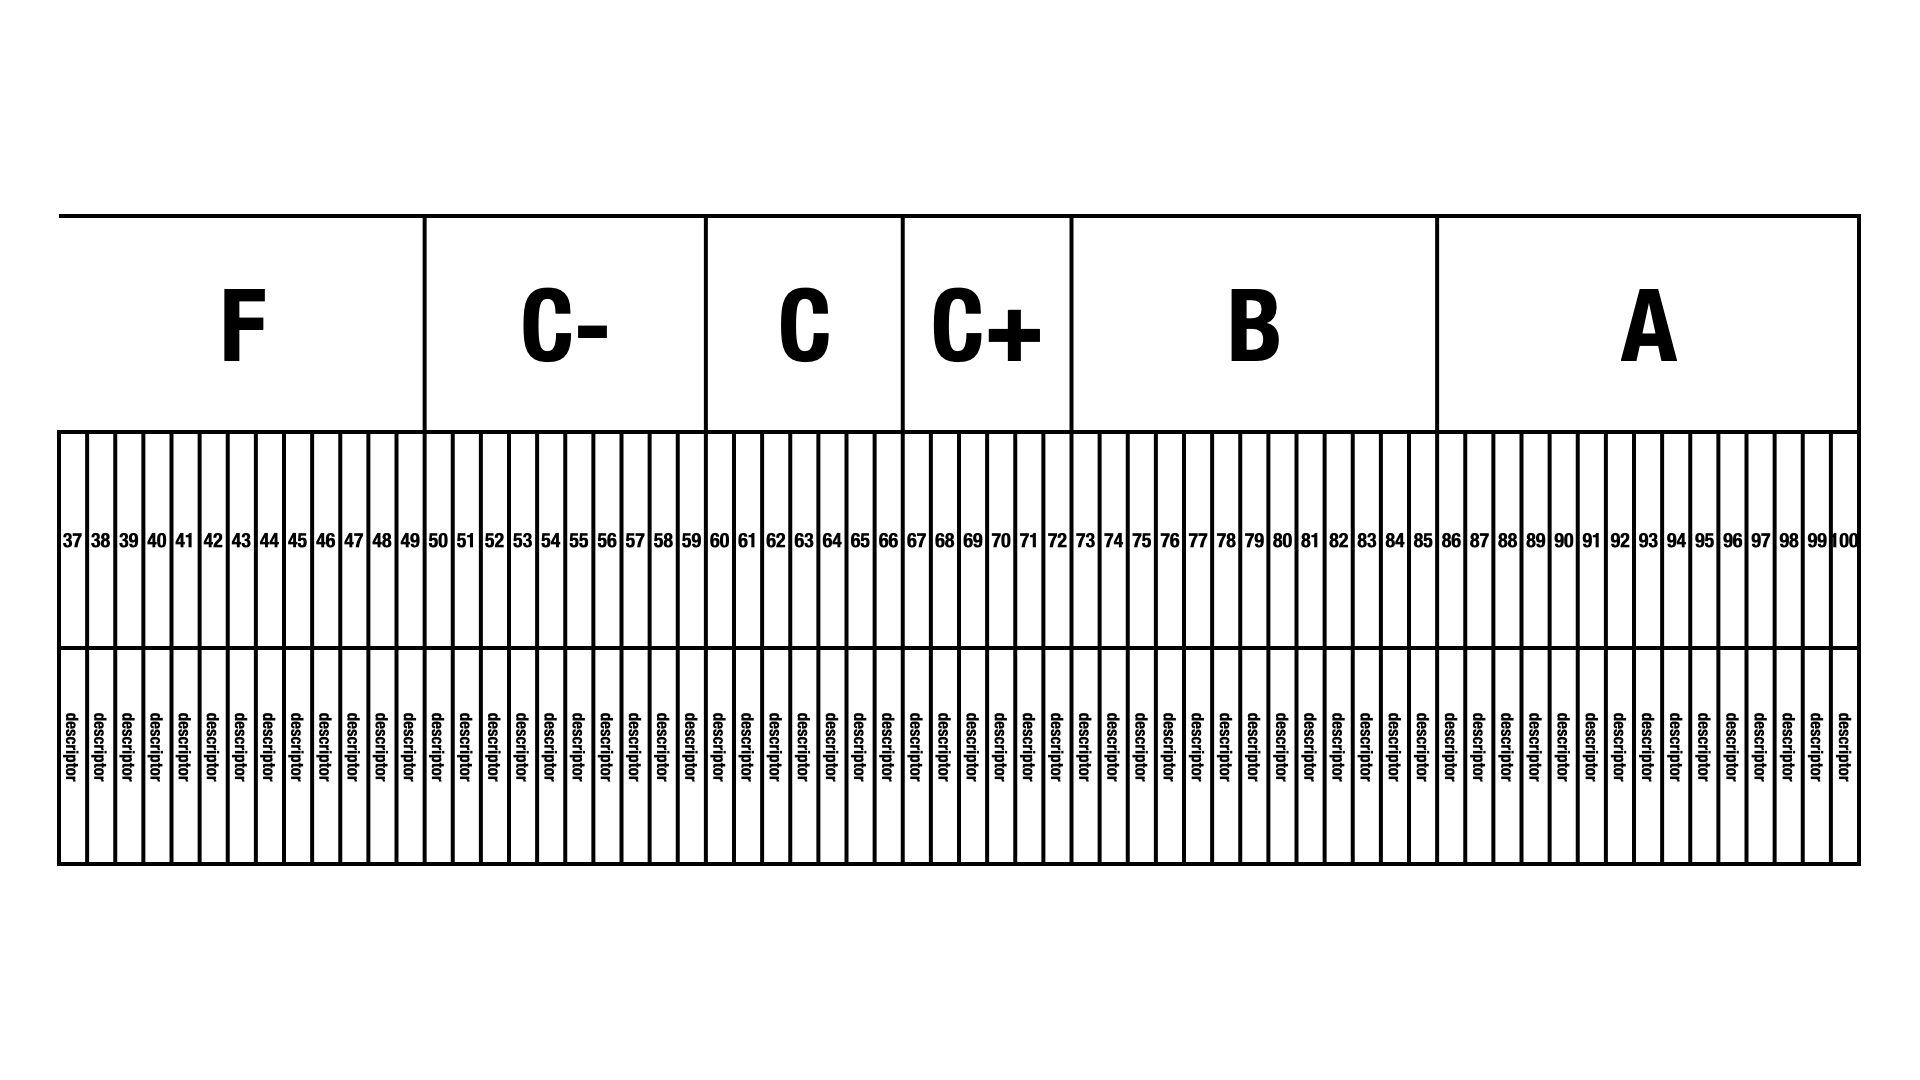
A letter grade and percentage mandate suggests a difference between 73% and 85%–both Bs in BC. Quantitatively? Sure. In the point-gathering paradigm, 73% leaves almost twice as many points on the table as 85% (i.e., the “Lo-B, Hi-B” refrain).
But qualitatively? Not really. See the Ministry of Education’s letter grade definitions:
F; 0 – 49; The student has not demonstrated, or is not demonstrating, minimally acceptable performance in relation to the learning outcomes for the course or subject and grade. Policy Development Background & Rationale Document (PDF)
There are not thirteen (85 − 73 + 1) variations on very good. Three is a stretch:
NB: pretty good < good
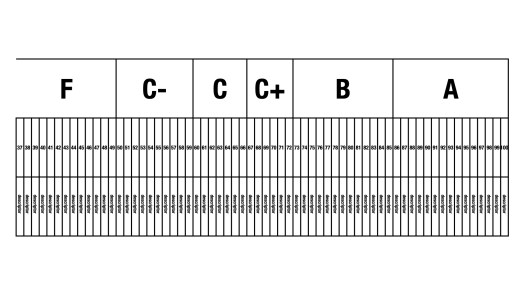
Extend the table. Write distinctly different descriptors of all levels, from 86% up to 100%, 72% down to 0%.
0-36 didn’t fit.
You can’t. Whereas letter grades differentiate six levels of performance, percentages differentiate one hundred one. No teacher can be that precise (or accurate). Like objectivity and consistency, precision is a myth.
Standards-based assessment is not designed to produce percentages. Proficiency scales are not numbers! Still, teachers–of Grades 10-12 only–are required to report out a number. So, holding my nose…
Imperfect Solutions
🔴 1-2-3-4
To turn the data into a number, values need to be assigned to proficiency levels (e.g., Emerging = 1, Developing = 2, Proficient = 3, Extending = 4). Students receive a value on each outcome. The numerator takes together these values from all of the outcomes; the denominator is the greatest sum that is possible. Aaron, Blake, and Denise receive 83% (B), 63% (C), and 48% (F), respectively.
Student Navigation Tool
This feels… off. Denise demonstrated partial (Developing) or complete (Proficient) understanding of seven of ten learning outcomes. Nevertheless, she is failing. This is because a 1-2-3-4 scale is harsh. One-out-of-four (i.e., 25%) for Emerging isn’t just a failing grade; it’s an unforgiving one. Also, two-out-of-four (i.e., 50%) for Developing leaves no wiggle room. Developing is more than a minimal pass.
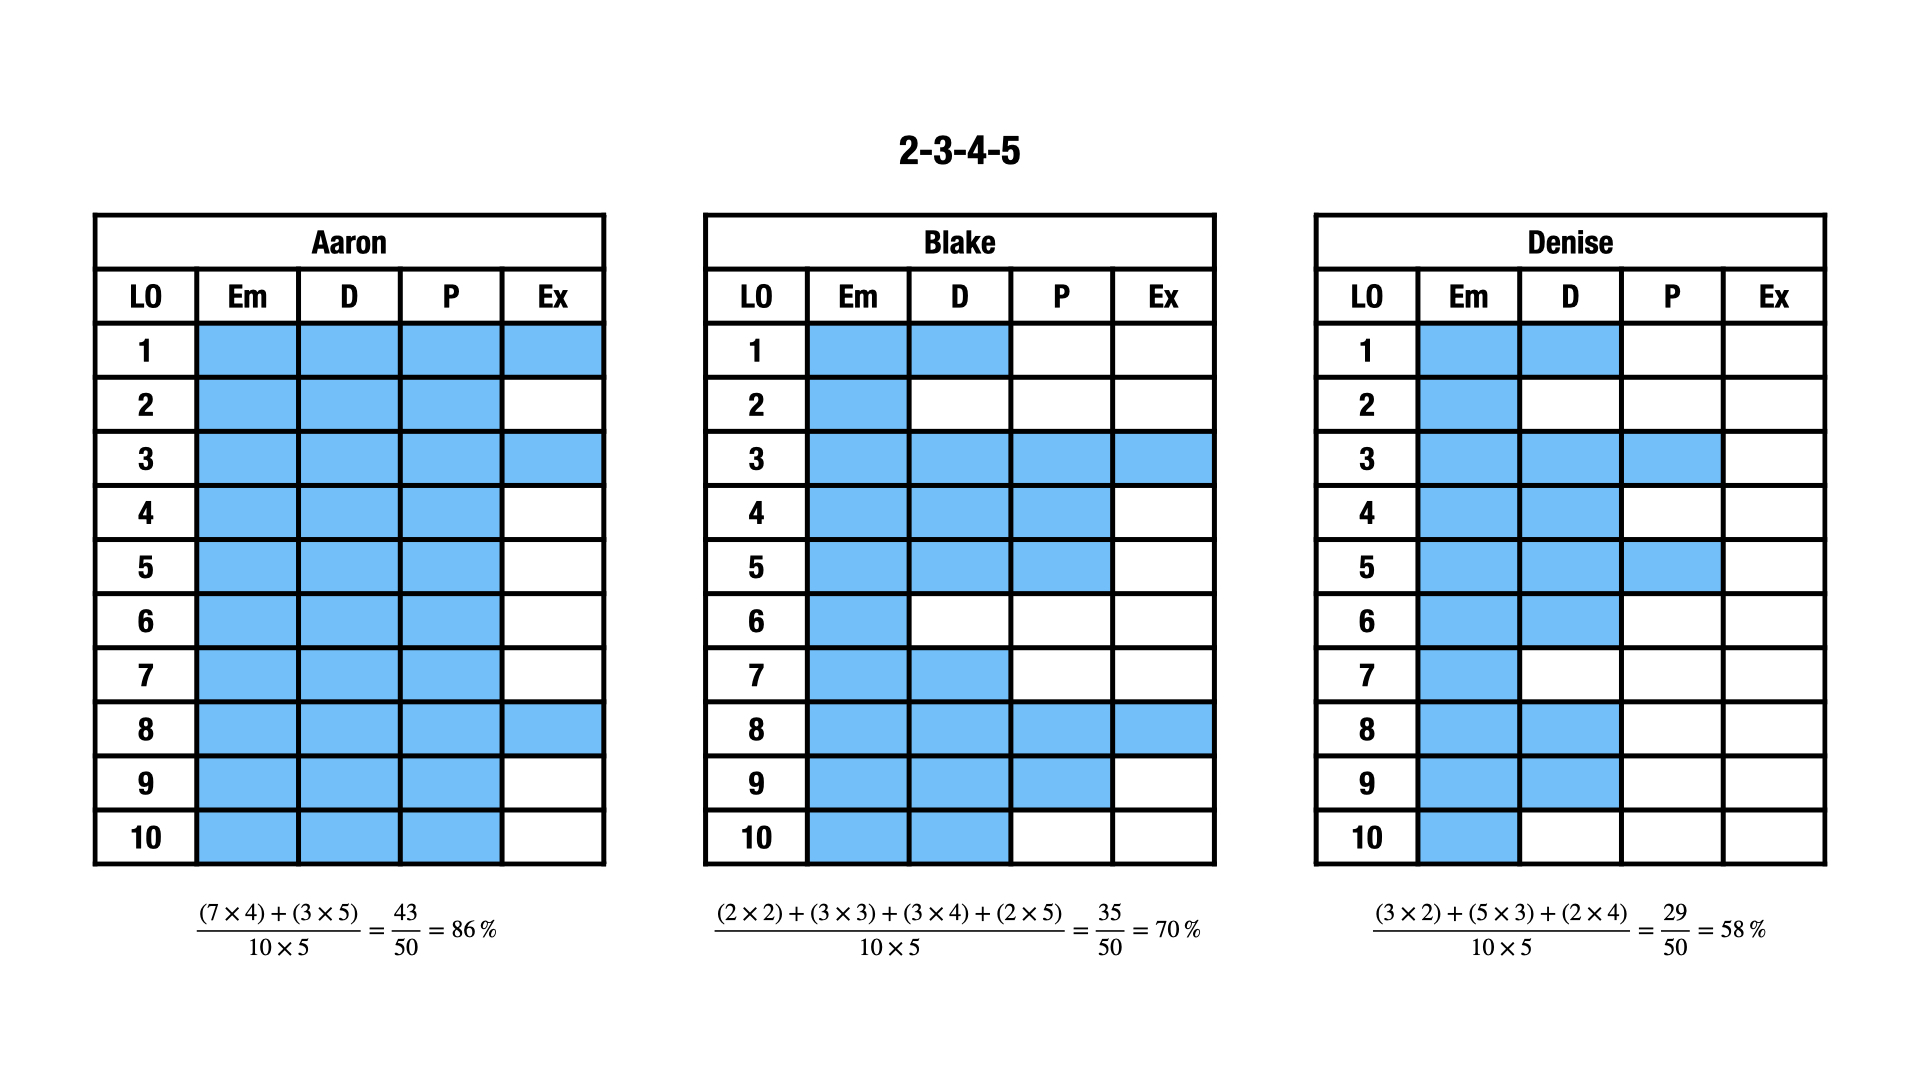
🟡 2-3-4-5
A 2-3-4-5 scale feels more accurate. Aaron, Blake, and Denise now receive 86% (A), 70% (C+), and 58% (C-), respectively.
Student Navigation Tool
Note that Denise is now passing. I really like the example of Aaron since it illustrates that Extending is not “the new A.” To achieve an A, Aaron demonstrated Proficient in all, Extending in (just) a few. Further, Blake’s C+ feels fair. To “award” Blake a B, I’d want to see additional evidence of their proficiency (i.e., new data points at Developing in outcomes 2 or 6 or Proficient in outcomes 1, 7, or 10).
If 2-3-4-5 doesn’t work, play with 3-4-5-6. Or 46-64-85-100. And if you want to give some outcomes more weight than others, do so. For example, you can double values from solve systems algebraically.
Averaging
Conversations about averaging do not always offer nuance. The takeaway can be that averaging is just… wait for it… mean. Averaging across different outcomes–see above–is more than okay. It’s averaging within the same outcome that can be punitive. Let’s revisit the gradebook:
Gradebook at time of first Learning Update
For the sake of simplicity, I skipped a crucial step. These letters are not single data points. For example, prior to “it’s time to report out,” Denise’s “P” on the third learning outcome might have been “Em, Em, D, P, P.” Averaging would drag Denise down to Developing; she’d be stuck to her initial struggles. In the end, Denise demonstrated–successively–a Proficient level of understanding in relation to this learning outcome. That’s what matters, that’s what counts.
The fact that she didn’t know how to do something in the beginning is expected–she is learning, not learned, and she shouldn’t be punished for her early-not-knowing.
There is a sentiment in BC that using tests and quizzes is an outdated assessment practice. However, these are straightforward tools for finding out what students know and can do. So long as students face learning standards like solve systems of linear equations algebraically, test items like “Solve: ; ” are authentic. Rather than eliminate unit tests, teachers can look at them through different lenses; a points-gathering perspective shifts to a data-gathering one. Evidence of student learning can take multiple forms (i.e., products, observations, conversations). In this post I will focus on products, specifically unit tests, in part to push back against the sentiment above.
In the previous post, I constructed proficiency scales that describe what students know at each level. These instruments direct the next standards-based assessment practice: designing assessment items. Items can (1) target what students know at each proficiency level or (2) allow for responses at all levels.
Target What Students Know at Each Level
Recall that I attached specific questions to my descriptors to help students understand the proficiency scales:
This helps teachers too. Teachers can populate a test with similar questions that reflect a correct amount of complexity at each level of a proficiency scale. Keep in mind that these instruments are intended to be descriptive, not prescriptive. Sticking too close to sample questions can emphasize answer-getting over sense-making. Questions that look different but require the same depth of knowledge are “fair game.” For example:
Prompts like “How do you know?” and “Convince me!” also prioritize conceptual understanding.
Allow For Responses at All Levels
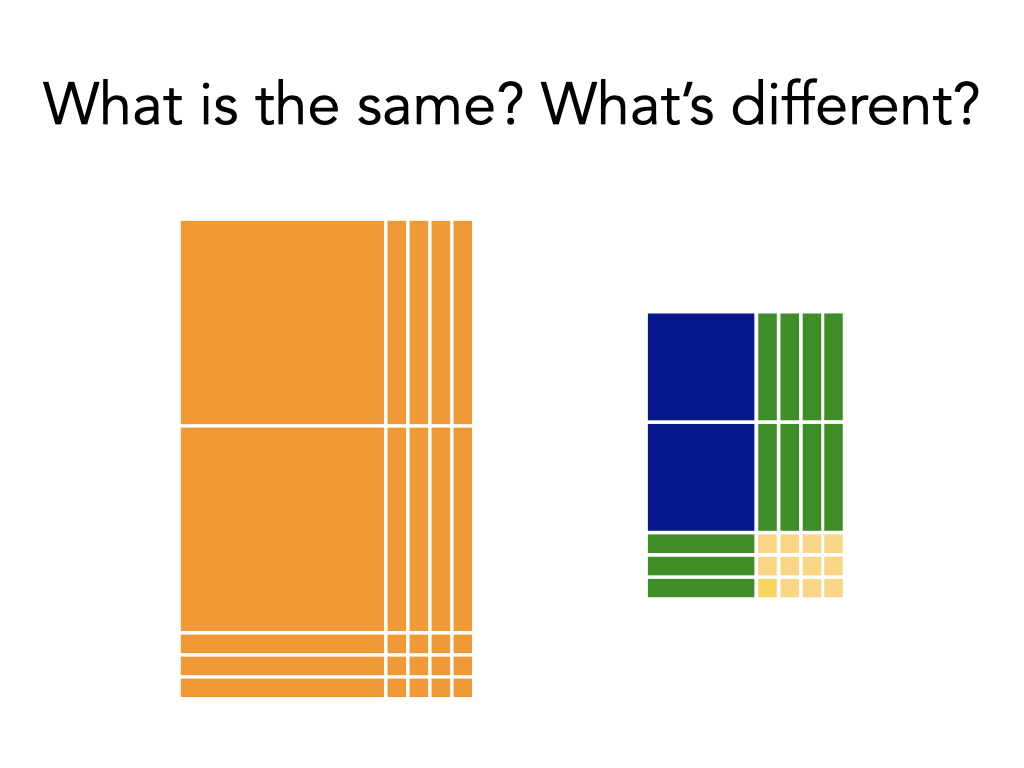
Students can demonstrate what they know through questions that allow for responses at all levels. For example, a single open question such as “How are 23 × 14 and (2x + 3)(x + 4) the same? How are they different?” can elicit evidence of student learning from Emerging to Extending.
Nat Banting’s Menu Math task from the first post in this series is an example of a non-traditional assessment item that provides both access (i.e., a “low-threshold” of building a different quadratic function to satisfy each constraint) and challenge (i.e., a “high-ceiling” of using as few quadratic functions as possible). A student who knows that two negative x-intercepts pairs nicely with vertex in quadrant II but not with never enters quadrant III demonstrates a sophisticated knowledge of quadratic functions. These items blur the line between assessment and instruction.
Note that both of these items combine content (“operations with fractions” and “quadratic functions”) and competencies (i.e., “connect mathematical concepts to one another” and “analyze and apply mathematical ideas using reason”). Assessing content is my focus in this series. Still, I wanted to point out the potential to assess competencies.
Unit Tests
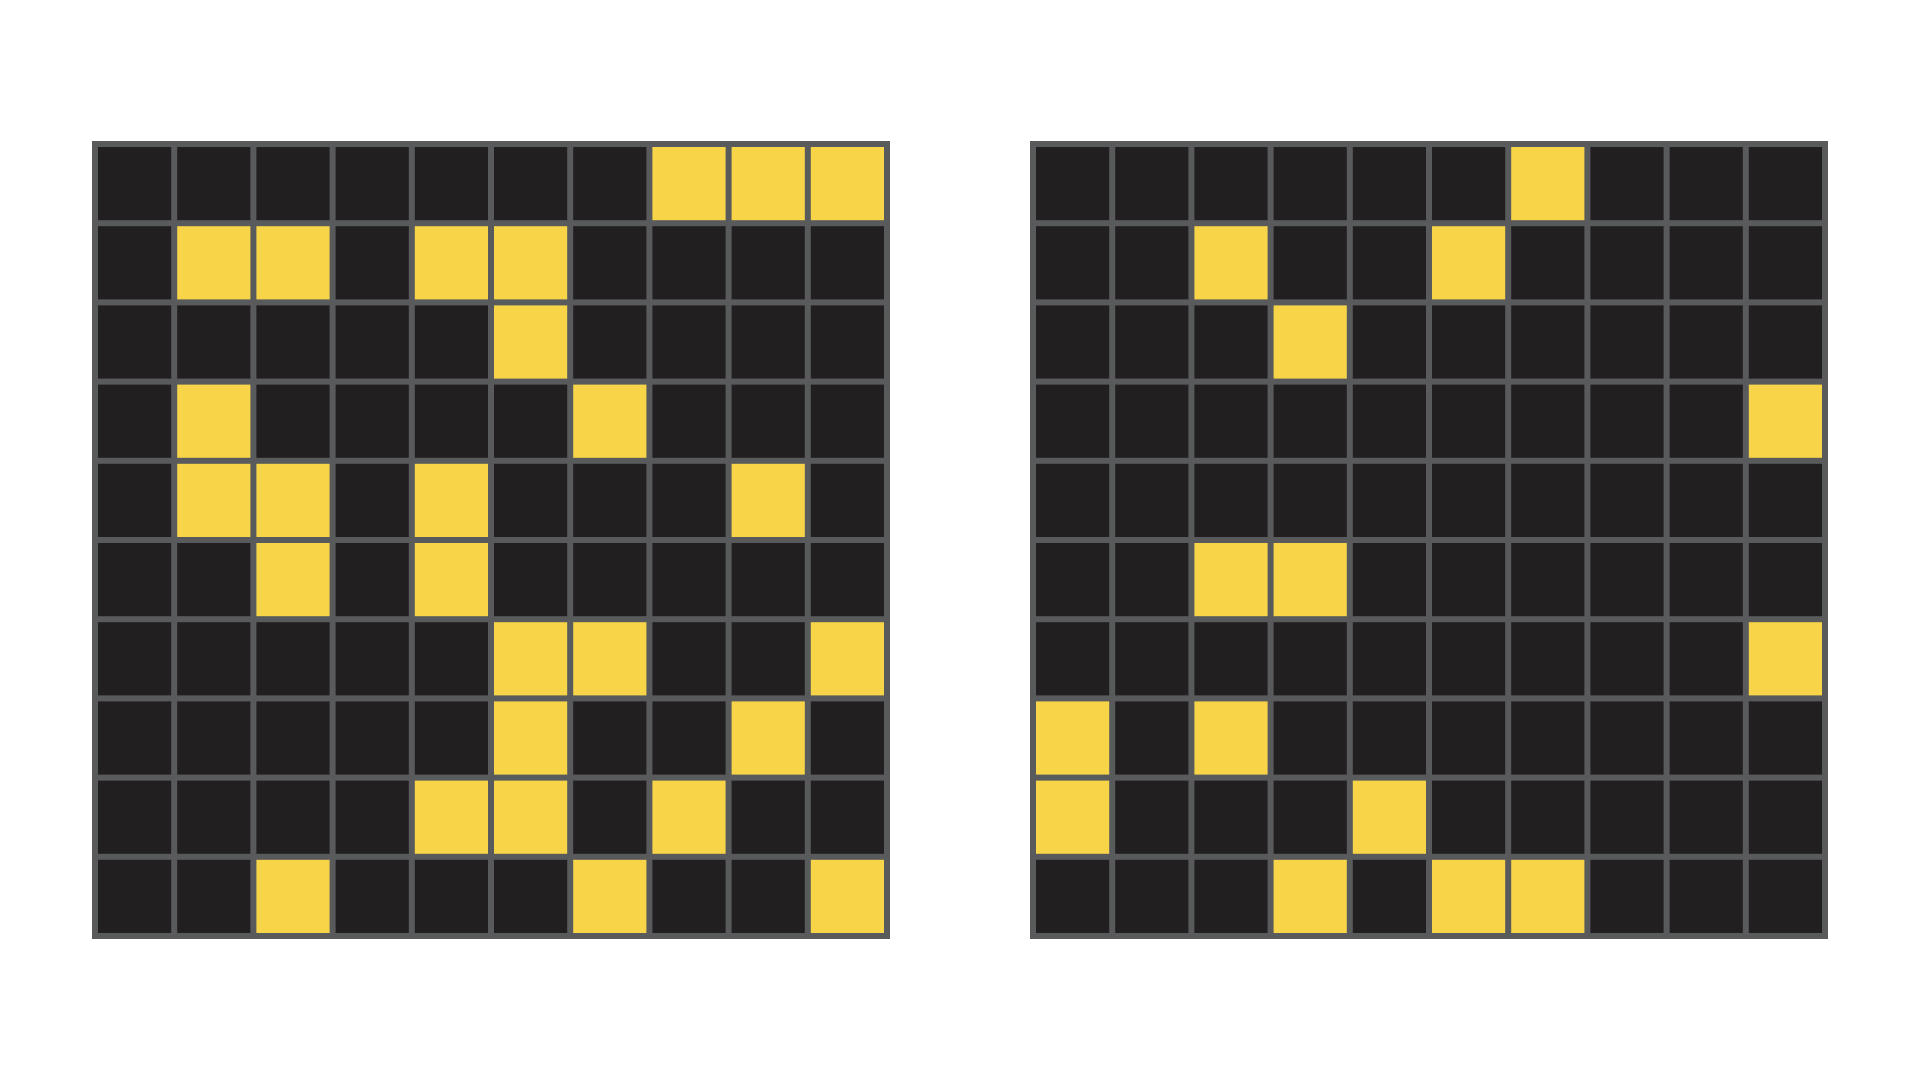
Teachers can arrange these items in two ways: (1) by proficiency level then learning outcome or (2) by learning outcome then proficiency level. A side-by-side comparison of the two arrangements:
Teachers prefer the second layout–the one that places the learning outcome above the proficiency levels. I do too. Evidence of learning relevant to a specific standard is right there on single page–no page flipping is required to reach a decision. An open question can come before or after this set. The proficiency-level-above-learning-outcome layout works if students demonstrate the same proficiency level across different learning outcomes. They don’t. And shouldn’t.
There’s room to include a separate page to assess competency learning standards. Take a moment to think about the following task:
What could equations ① and ② have been? What else? How do you know?
Initially, I designed this task to elicit Extending-level knowledge of solve systems of linear equations algebraically. In order to successfully “go backwards,” a student must recognize what happened: equivalent equations having opposite terms were made. The p-terms could have been built from 5p and 2p. This gives for ① and for ②. (I’m second-guessing that this targets only Extending; for ① and for ② works too.) This task also elicits evidence of students’ capacities to reason and to communicate–two of the curricular competencies.
Teacher Reflections
Many of the teachers who I work with experimented with providing choice. Students self-assessed their level of understanding and decided what evidence to provide. Most of these teachers asked students to demonstrate two proficiency levels (e.g., the most recent level achieved and one higher). Blank responses no longer stood for lost points.
Teachers analyzed their past unit tests. They discovered that progressions from Emerging to Proficient (and sometimes Extending) were already in place. Standards-based assessment just made them visible to students. Some shortened their summative assessments (e.g., Why ask a dozen Developing-level solve-by-elimination questions when two will do?).
The shift from grading based on data, not points, empowered teachers to consider multiple forms (i.e., conversations, observations, products) and sources (e.g., individual interviews, collaborative problem solving, performance tasks) of evidence.
In my next post, I’ll describe the last practice: Determining Grades (and Percentages). Again, a sneak peek:
Update
Here’s a sample unit test populated with questions similar to those from a sample proficiency scale:
Note that Question 18 addresses two content learning standards: (1) solve systems of linear equations graphically and (2) solve systems of linear equations algebraically. Further, this question addresses competency learning standards such as Reasoning (“analyze and apply mathematical ideas using reason”) and Communicating (“explain and justify mathematical ideas and decisions”). The learning standard cells are intentionally left blank; teachers have the flexibility to fill them in for themselves.
Note that Question 19 also addresses competencies. The unfamiliar context can make it a problematic problem that calls for (Problem) Solving. “Which window has been given an incorrect price?” is a novel prompt that requires Reasoning.
These two questions also set up the possibility of a unit test containing a collaborative portion.
[E]valuation is a double edged sword. When we evaluate our students, they evaluate us–for what we choose to evaluate tells our students what we value. So, if we value perseverance, we need to find a way to evaluate it. If we value collaboration, we need to find a way to evaluate it. No amount of talking about how important and valuable these competencies are is going to convince students about our conviction around them if we choose only to evaluate their abilities to individually answer closed skill math questions. We need to put our evaluation where our mouth is. We need to start evaluating what we value.
Liljedahl, P. (2021). Building thinking classrooms in mathematics, grades K-12: 14 teaching practices for enhancing learning. Corwin.
BC’s reporting order requires teachers of Grades K-9 to use proficiency scales with four levels: Emerging, Developing, Proficient, and Extending. Teachers of Grades 10-12 may use proficiency scales but must provide letter grades and percentages. Proficiency scales help communicate to students where they are and where they are going in their learning. But many don’t. When constructing these instruments, I keep three qualities in mind…
Descriptive, Positive, Progressive and Additive
Descriptive
BC’s Ministry of Education defines Emerging, Developing, Proficient, and Extending as demonstrating initial, partial, complete, and sophisticated knowledge, respectively. Great. A set of synonyms. It is proficiency scales that describe these depths with respect to specific learning standards; they answer “No, really, what does Emerging, or initial, knowledge of operations with fractions look like?” Populating each category with examples of questions can help students–and teachers–make sense of the descriptors.
Positive
Most scales or rubrics are single-point posing as four. Their authors describe Proficient, that’s it. The text for Proficient is copied and pasted to the Emerging and Developing (or Novice and Apprentice) columns. Then, words such as support, some, and seldom are added. Errors, minor (Developing) and major (Emerging), too. These phrases convey to students how they come up short of Proficient; they do not tell students what they know and can do at the Emerging and Developing levels.
Progressive and Additive
BC’s Ministry of Education uses this phrase to describe profiles of core competencies: “[Profiles] are progressive and additive, and they emphasize the concept of expanding and growing. As students move through the profiles, they maintain and enhance competencies from previous profiles while developing new skills.”
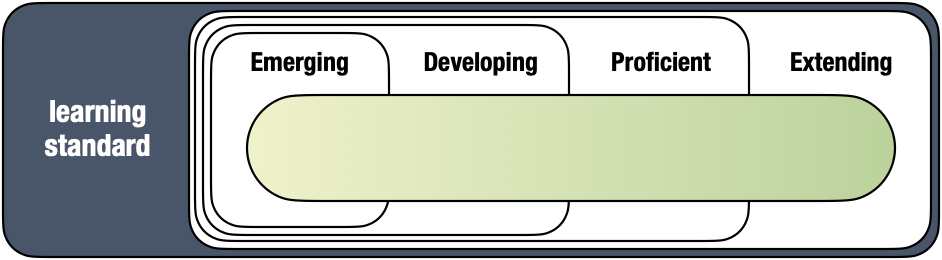
I have borrowed this idea and applied it to content learning standards. It was foreshadowed by the graphic organizer at the end of my previous post: Extending contains Proficient, Proficient contains Developing, and Developing contains Emerging. (Peter Liljedahl calls this backward compatible.) For example, if a student can determine whole number percents of a number (Proficient), then it is assumed that they can also determine benchmark percents (i.e., 50%, 10%) of a number (Emerging). A move from Emerging to Proficient reflects new, more complex, knowledge, not greater independence or fewer mistakes. Students level up against a learning standard.
Emerging and Extending
The meanings of two levels–Emerging to the left and Extending to the right–are open to debate. Emerging is ambiguous, Extending less so. Some interpretations of Extending require rethinking.
Emerging
“Is Emerging a pass?” Some see Emerging as a minimal pass; others interpret “initial understanding” as not yet passing. The MoE equivocates: “Every student needs to find a place on the scale. As such, the Emerging indicator includes both students at the lower end of grade level expectations, as well as those before grade level expectations. […] Students who are not yet passing a given course or learning area can be placed in the Emerging category.” Before teachers can construct proficiency scales that describe Emerging performance, they must land on a meaning of Emerging for themselves. This decision impacts, in turn, the third practice of a standards-based approach, designing assessment items.
Extending
A flawed framing of Extending persists: above and beyond. Above and beyond can refer to a teacher’s expectations. The result: I-know-it-when-I-see-it rubrics. “Wow me!” isn’t descriptive.
Above and beyond can also refer to a student’s grade level. Take a closer look at the MoE’s definition of Extending: “The student demonstrates a sophisticated understanding of the concepts and competencies relevant to the expected learning [emphasis added].” It is Math 6 standards, not Math 8 standards, that set forth the expected learning in Math 6. When reaching a decision about proficiency in relation to a Math 6 outcome, it is unreasonable–and nonsensical–to expect knowledge of Math 8 content.
Characterizing Extending as I can teach others is also problematic. Explaining does not ensure depth; it doesn’t raise a complete understanding of a concept to a sophisticated understanding. Further, I can teach others is not limited to one level. A student may teach others at a basic complexity level. For example, a student demonstrates an initial understanding of add and subtract fractions when they explain how to add proper fractions with the same denominator.
Example: Systems of Linear Equations
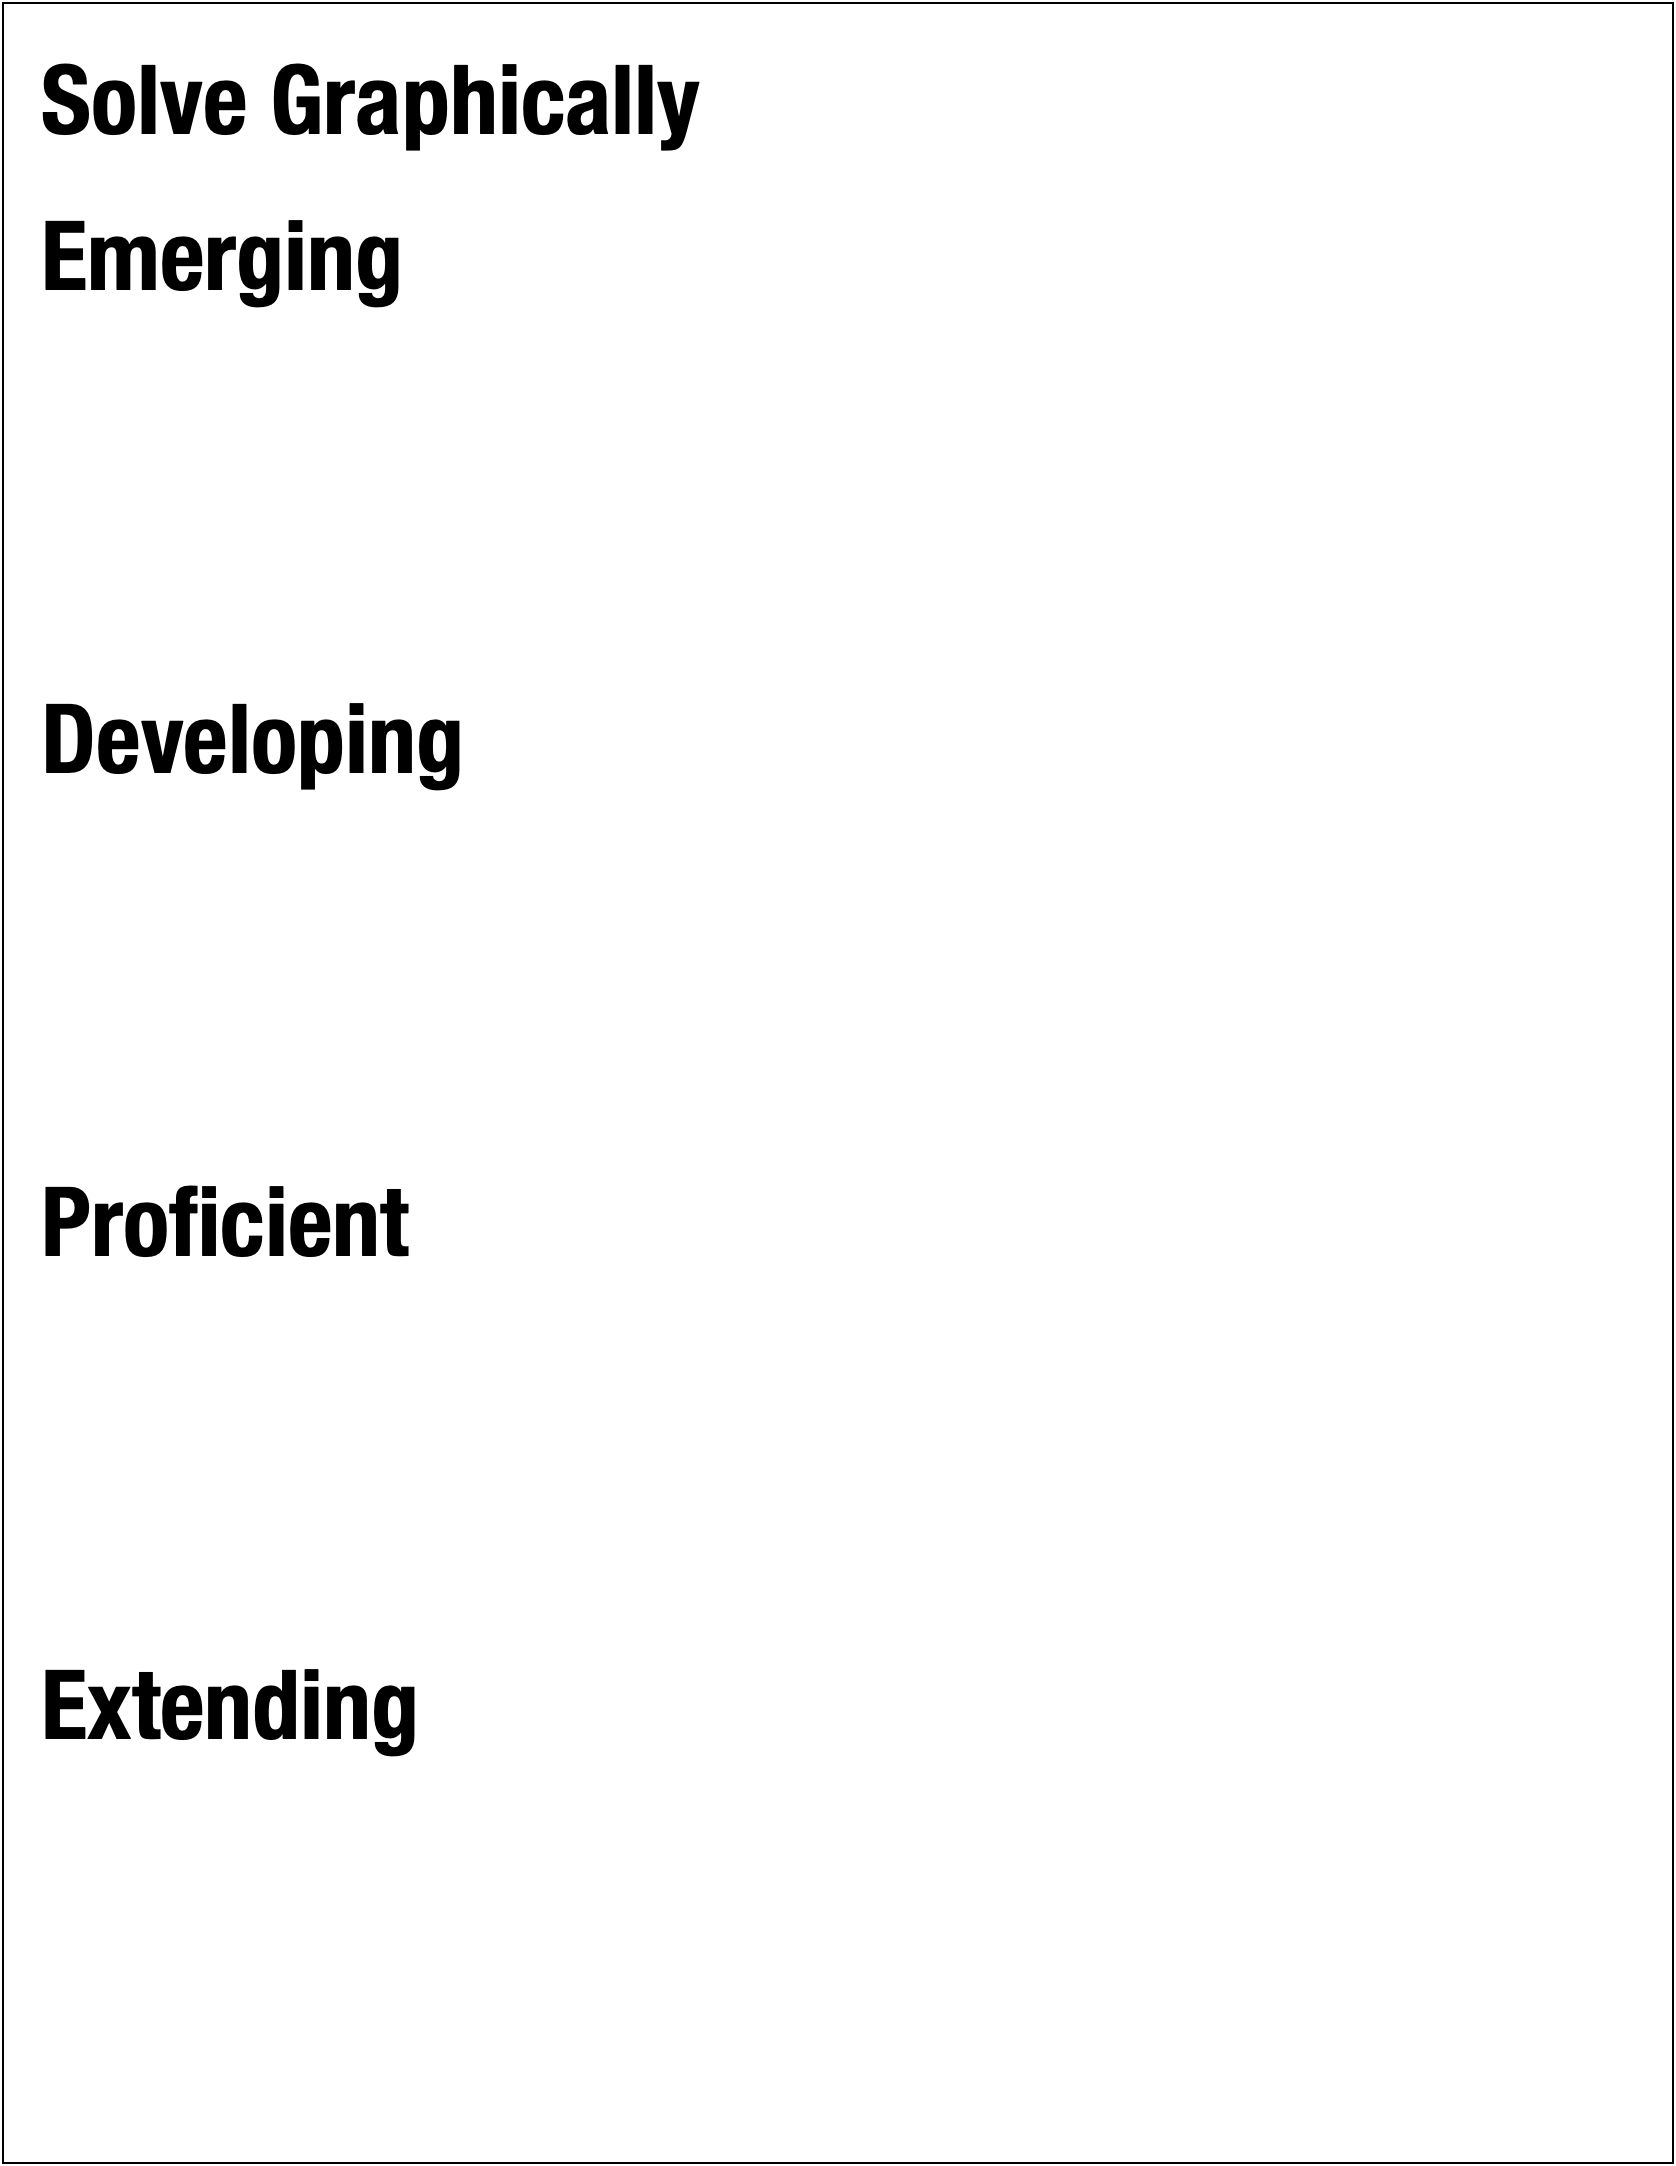
In my previous post, I delineated systems of linear equations as solve graphically, solve algebraically, and model and solve contextual problems. Below, I will construct a proficiency scale for each subtopic.
Note that I’ve attached specific questions to my descriptors. My text makes sense to me; it needs to make sense to students. Linear, systems, model, slope-intercept form, general form, substitution, elimination–all of these terms are clear to teachers but may be hazy to the intended audience. (Both logarithmic and sinusoidal appear alongside panendermic and ambifacient in the description of the turbo-encabulator. Substitute nofer trunnions for trigonometric identities in your Math 12 course outline and see if a student calls you on it on Day 1.) The sample questions help students understand the proficiency scales: “Oh yeah, I got this!”
Some of these terms may not make sense to my colleagues. Combination, parts-whole, catch-up, and mixture are my made-up categories of applications of systems. Tees and hoodies are representative of hamburgers and hot dogs or number of wafers and layers of stuf. Adult and child tickets can be swapped out for dimes and quarters or movie sales and rentals. The total cost of a gas vehicle surpassing that of an electric vehicle is similar to the total cost of one gym membership or (dated) cell phone plan overtaking another. Of course, runner, racing car and candle problems fall into the catch-up category, too. Textbooks are chock full o’ mixed nut, alloy, and investment problems. I can’t list every context that students might come across; I can ask “What does this remind you of?”
My descriptors are positive; they describe what students know, not what they don’t know, at each level. They are progressive and additive. Take a moment to look at my solve-by-elimination questions. They are akin to adding and subtracting quarters and quarters, then halves and quarters, then quarters and thirds (or fifths and eighths) in Math 8. Knowing implies knowing .
Emerging is always the most difficult category for me to describe. My Emerging, like the Ministry’s, includes not yet passing. I would welcome your feedback!
Describing the Extending category can be challenging, too. I’m happy with my solve graphically description and questions. I often lean on create–or create alongside constraints–for this level. I’m leery of verb taxonomies; these pyramids and wheels can oversimplify complexity levels. Go backwards might be better. Open Middle problems populate my Extending columns across all grades and topics.
My solve algebraically… am I assessing content (i.e., systems of linear equations) or competency (i.e., “Explain and justify mathematical ideas and decisions”)? By the way, selecting and defending an approach is behind my choice to not split (👋, Marc!) substitution and elimination. I want to emphasize similarities among methods that derive equivalent systems versus differences between step-by-step procedures. I want to bring in procedural fluency:
Procedural fluency is the ability to apply procedures accurately, efficiently, and flexibly; to transfer procedures to different problems and contexts; to build or modify procedures from other procedures; and to recognize when one strategy or procedure is more appropriate to apply than another.
Note that my model and solve contextual problems is described at all levels. Apply does not guarantee depth of knowledge. Separating problem solving–and listing it last–might suggest that problem solving follows building substitution and elimination methods. It doesn’t. They are interweaved. To see my problem-based approach, watch my Systems of Linear Equations videos from Surrey School’s video series for parents.
Next up, designing assessment items… and constructing proficiency scales has done a lot of the heavy lifting!
For several years, standards-based assessment (SBA) has been the focus of much of my work with Surrey teachers. Simply put, SBA connects evidence of student learning with learning standards (e.g., “use ratios and rates to make comparisons between quantities”) rather than events (“Quiz 2.3”). The change from gathering points to gathering data represents a paradigm shift.
In this traditional system, experience has trained students to play the game of school. Schools dangle the carrot (the academic grade) in front of their faces and encourage students to chase it. With these practices, schools have created a culture of compliance. Becoming standards based is about changing to a culture of learning. “Complete this assignment to get these points” changes to “Complete this assignment to improve your learning.” […] Educators have trained learners to focus on the academic grade; they can coach them out of this assumption.
In BC, content learning standards describe what students know and curricular competency learning standards describe what students can do. Describe is generous–more like list. In any mathematical experience a student might “bump into” both content and competency learning standards. Consider Nat Banting’s Quadratic FunctionsMenu Math task:
Think about the following ten “design specifications” of quadratic functions:
A.
Two negative x-intercepts
B.
Vertex in quadrant II
C.
Never enters quadrant III
D.
Vertex on the y-axis
E.
Positive y-intercept
F.
No x-intercepts
G.
Never enters quadrant I
H.
Has a minimum value
I.
Horizontally stretched
J.
Line of symmetry enters quadrant IV
You could build ten different quadratic functions to satisfy these ten different constraints.
Instead, build a set of as few quadratic functions as possible to satisfy each constraint at least once. Write your functions in the form y = a(x − p)2 + q.
Which constraints pair nicely? Which constraints cannot be paired?
Is it possible to satisfy all ten constraints using four, three, or two functions?
Describe how and why you built each function. Be sure to identify which functions satisfy which constraints.
Students activate their knowledge of quadratic functions. In addition, they engage in several curricular competencies: “analyze and apply mathematical ideas using reason” and “explain and justify mathematical ideas and decisions,” among others. Since the two are interwoven, combining competencies and content (i.e., “reason about characteristics of quadratic functions”) is natural when thinking about a task as a learning activity. However, from an assessment standpoint, it might be helpful to separate the two. In this series, I will focus on assessing content.
The content learning standard quadratic functions and equations is too broad to inform learning. Quadratic functions–nevermind functions and equations–is still too big. A student might demonstrate Extending knowledge of quadratic functions in the form y = a(x − p)2 + q but Emerging knowledge of completing the square, attain Proficient when graphing parabolas but Developing when writing equations.
Operations with fractions names an entire unit in Mathematics 8. Such standards need to be divided into subtopics, or outcomes. For example, operations with fractions might become:
add and subtract fractions
multiply and divide fractions
evaluate expressions with two or more operations on fractions
solve contextual problems involving fractions
Teachers can get carried away breaking down learning standards, differentiating proper from improper fractions, same from different denominators, and so on. These differences point to proficiency levels, not new outcomes. Having too many subtopics risks atomizing curriculum. Further, having as many standards as days in the course is incompatible with gathering data over time. I aim for two to four (content) outcomes per unit.
In Foundations of Mathematics and Pre-calculus 10, systems of linear equations can be delineated as:
solve graphically
solve algebraically
model and solve contextual problems
My solve algebraically includes both substitution and elimination. Some of my colleagues object to this. No worries, separate them.
In my next post, I’ll describe constructing proficiency scales to differentiate complexity levels within these learning standards. Here’s a sneak peek:
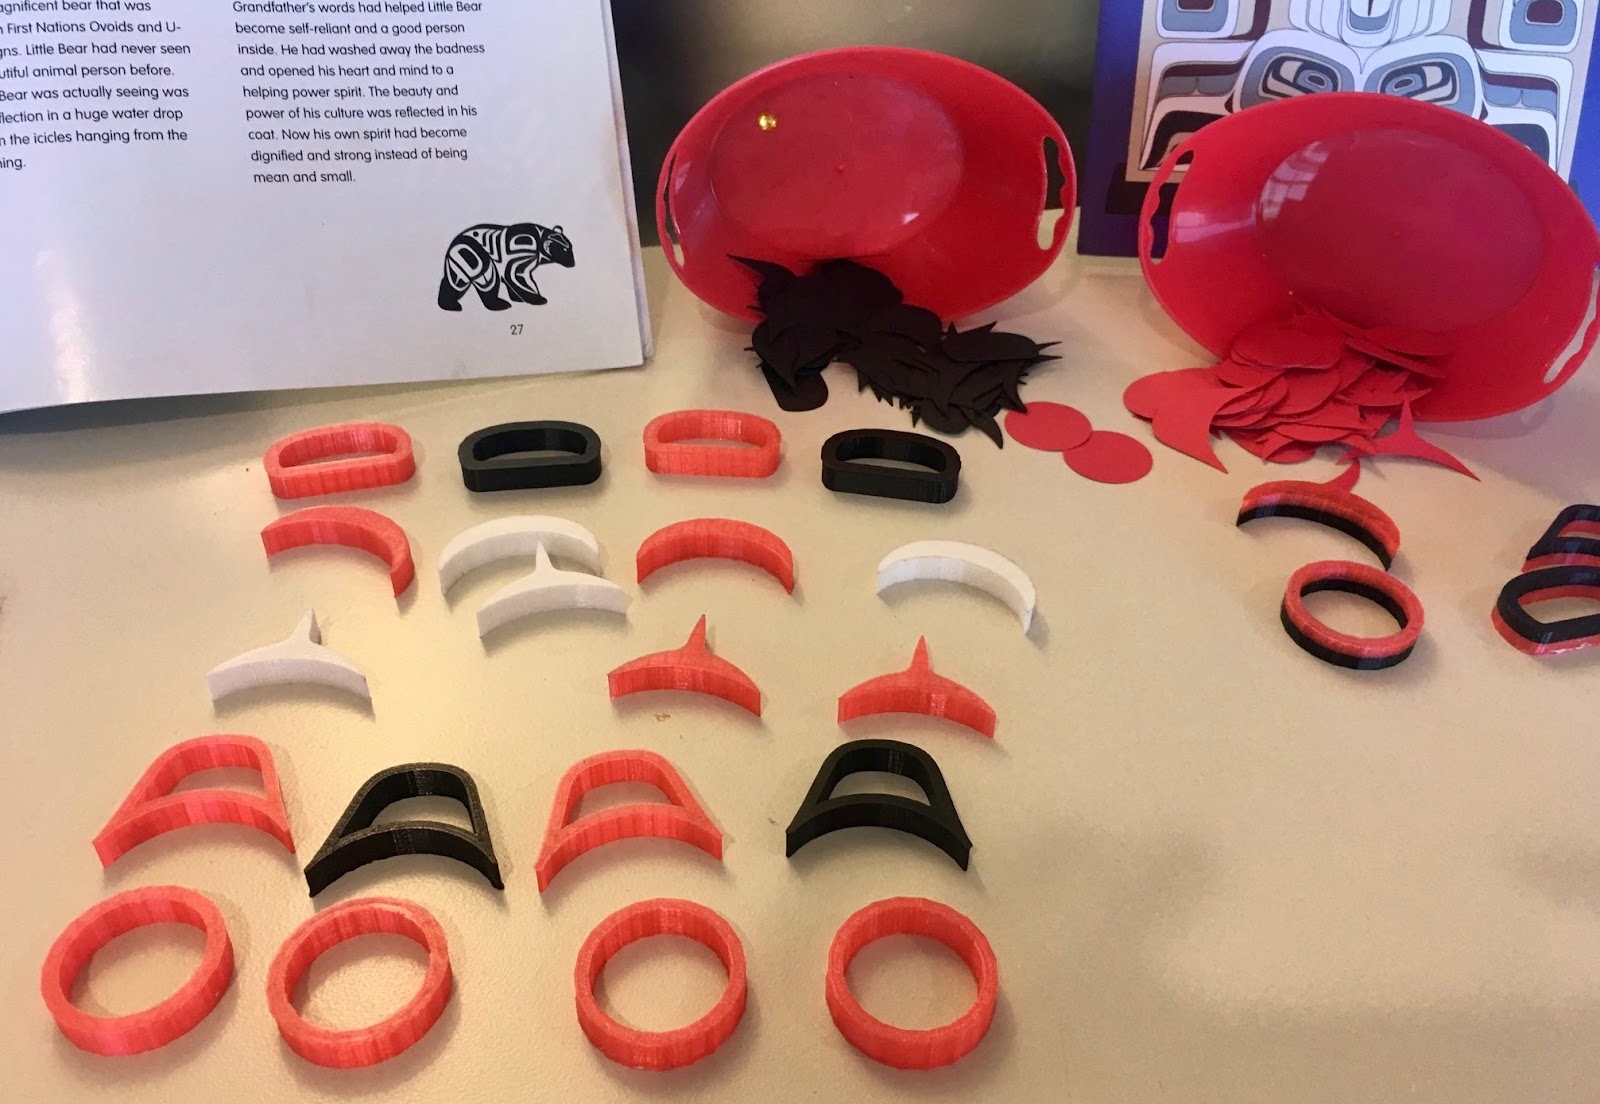
Back when we were all together, I’d often stop on my way in or out of DEC to play with the 3-D printed First Nation shapes on display. These manipulatives were a collaboration between Nadine McSpadden (Aboriginal Helping Teacher), Eric Bankes (ADST Helping Teacher), and the Bothwell Elementary community (Bea Sayson, Principal). Like others who passed by, I just had to rearrange them to create repeating patterns or symmetric designs.
Photo: Nadine McSpadden
Before having students explore mathematics using these materials, it’s important to first teach the cultural significance of Indigenous works of art. In Surrey, we work and learn on the unceded shared territories of the Coast Salish. We acknowledge the Katzie, Semiahmoo, and Kwantlen First Nations who have been stewards of this land since time immemorial.
Students should understand that, although there are similarities, not all First Nation art is the same. Both Coast Salish and Northwest Coast art reflect a worldview of connection to the land and environment. There are differences in design: Coast Salish artists use three geometric elements — the circle (or oval), crescent, and trigon — whereas Northwest Coast artists use formline — the ovoid and U-shape. The use of circles, crescents, and trigons is unique to the Coast Salish! These elements suggest movement and make use of positive and negative space. In his video covering Coast Salish design, Shaun Peterson invites viewers to “imagine a calm body of water enclosed by two borders and dropping a pebble in to create ripples that carry the elements away from the centre.” Just as there is diversity within both Coast Salish and Northwest Coast peoples, there is diversity within both Coast Salish and Northwest Coast art (e.g., compare the Northwest Coast styles of the Haida and the Tsimshian).
Patterns play an important role in aboriginal art and technology. Coast Salish art could provide opportunities for students’ across the grades (and into Pre-calculus 12!) to expand their ideas about “what repeats.” Dylan Thomas is a Coast Salish artist from the Lyackson First Nation whose work in silkscreen prints, paintings, and gold and silver jewelry is influenced by Buddhist imagery and M.C. Escher’s tessellations (see Mandala or The Union of Night and Day or Salmon Spirits or Ripples or Swans or…). Share this video in which Dylan Thomas talks about connections between geometry, nature, and art as well as the importance of noticing and wondering (4:00-4:40) with your students. In Mandala, Pythagoras — or a ruler — tells us that the ratios of successive diameters of circles or side lengths of squares is √2:1. Have your students investigate this relationship. This illustrates that sometimes it’s the repetition of a rule that makes a pattern a pattern. To learn more about the artist’s interest in mathematics, I recommend reading his essay on the topic. Now is a perfect time to remind students of protocols: students should not replicate a specific piece but can instead create their own piece that is “inspired by…” or “in the style of…”; if displayed, an information card acknowledging the artist, their Nation, and their story should be included.
I’m really interested in geometry and the reason I think I am is geometry is nature’s way of producing really intricate and beautiful things. I hope that when someone sees one of my pieces they see the correlation between what I designed and what you see in nature, these sacred geometries that have shown up in nature since life evolved. And I’m hoping that when they can look at my piece they can take that wonder into their everyday life and start noticing the things that I notice and the things that inspire me.
Dylan Thomas
My numeracy colleague, Jess Kyle, recently created a lesson around the 3-D shapes above to teach students about Coast Salish culture and repeating patterns with multiple attributes (shape, colour, orientation). I wanted to expand on this lesson and zoom out from these shapes to the animal forms seen in Coast Salish art. These animals — two-legged, four-legged, winged, and finned — are connected to the land. I’m imagining these math investigations within a classroom where learners understand that animals were and continue to be an important part of the lives (and art) of First Peoples. For example, see Maynard Johnny Jr., Coast Salish, Kwakwaka’wakw, talk about his work Ate Salmon, its past-tense play-on-words title displaying humour while addressing the effects of overfishing and stock depletion on Indigenous communities (3:00-4:00). In many First Nations, certain animals are significant or sacred to the teachings, histories, and beliefs of that Nation. Each will have their own protocols around ways in which these animals are portrayed. In some parts of British Columbia animals appear on crests and regalia while in other parts of Canada animals are sacred gifts from the ancestors.
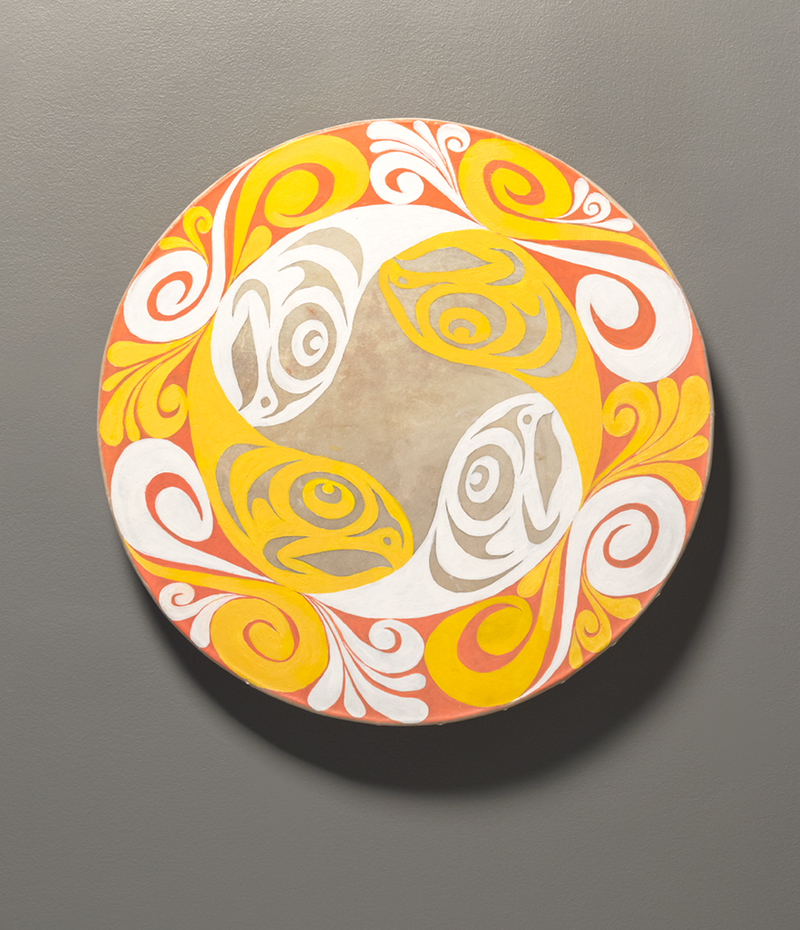
The City of Surrey has commissioned several public Indigenous works of art. Four Seasons, by Brandon Gabriel and Melinda Bige, Kwantlen First Nation, is located in the Chuck Bailey Recreation Centre.
Photo: City of Surrey
I have some mathematical noticings and wonderings but, again, it’s important to first teach the cultural context and meaning.
Throughout this cancellation of in-class learning due to COVID-19, Surrey’s cultural facilitators have been creating and sharing videos to show and discuss with your students. Chandra Antone, Squamish First Nation, shares her teachings about drumming with us in the videos “Honour Song” and “Animal Hides.” As well, Surrey’s Aboriginal Learning Helping Teachers have generated sets of questions to ask your students about each of these videos.
Display images (below) of the four drums and ask “What do you notice? What do you wonder?”
Winter: Time of the Winter Dance; Spring: Time of the Murky Water; Summer: Time of the Sockeye; Fall: Time of the Leaves Falling Photos: City of Surrey
Students might notice the blues, greens, yellows/whites, and reds/oranges; they might wonder if these colours represent winter, spring, summer, and fall. They might notice the moons (“Why just two?”), two wolves, four salmon, and trees/leaves and wonder how they tell the story of the four seasons. They might also wonder “How big are they?” (30”), “What are the drums made of?” (buffalo hide) or “Who is the artist?” Introduce your students to Mr. Gabriel through this video:
We wanted to make sure that we captured the essence of the space that we were in, that Surrey didn’t begin as Surrey, that its beginnings are much more ancient and go back many more years than the current incarnation of it. This place is very special for Indigenous people — it was also home to multiple Indigenous communities that were established here for thousands of years — so we wanted to make sure that we were honouring those people in a way that was respectful and dignifying to them. We thought, what can we use as part of the narrative that we’re going to tell with these drums that not only speaks to the Indigenous community that’s always been here but to the people who now call this place home?
Brandon Gabriel
Students may also make many mathematical observations. For example:
in the winter drum, there is line symmetry
in the summer and fall drums, there is rotational symmetry
in the spring drum, there is line symmetry in (just) the moon and rotational symmetry in (just) the surrounding running water design
in the summer drum, there are two repeating yellow-white patterns (salmon and border)
Line SymmetryRotational Symmetry
Again, students should not replicate Four Seasons but can instead draw their own symmetric piece that is “inspired by/in the style of Brandon Gabriel and Melinda Bige, Kwantlen First Nation.” Challenge students to use pattern blocks to build designs that satisfy mathematical constraints such as:
has more than three lines of symmetry
has rotational but not line symmetry
has oblique — not horizontal or vertical — lines of symmetry
order of rotation is three/angle of rotation is 120°
inspired by Four Seasons, Brandon Gabriel and Melinda Bige, Kwantlen First Nation
For more symmetry in Surrey Public Indigenous Art, seek out and visit:
Like night following day (or moon following sun), the cyclical changing of the seasons is something that young children can connect to when introduced to the concept of patterns. With changes in the seasons comes changes in their own lives. This is an opportunity for students to learn how seasonal and environmental changes impacted the village of qəyqə́yt (now known as Bridgeview) and continue to impact the lives of First Nations peoples today.
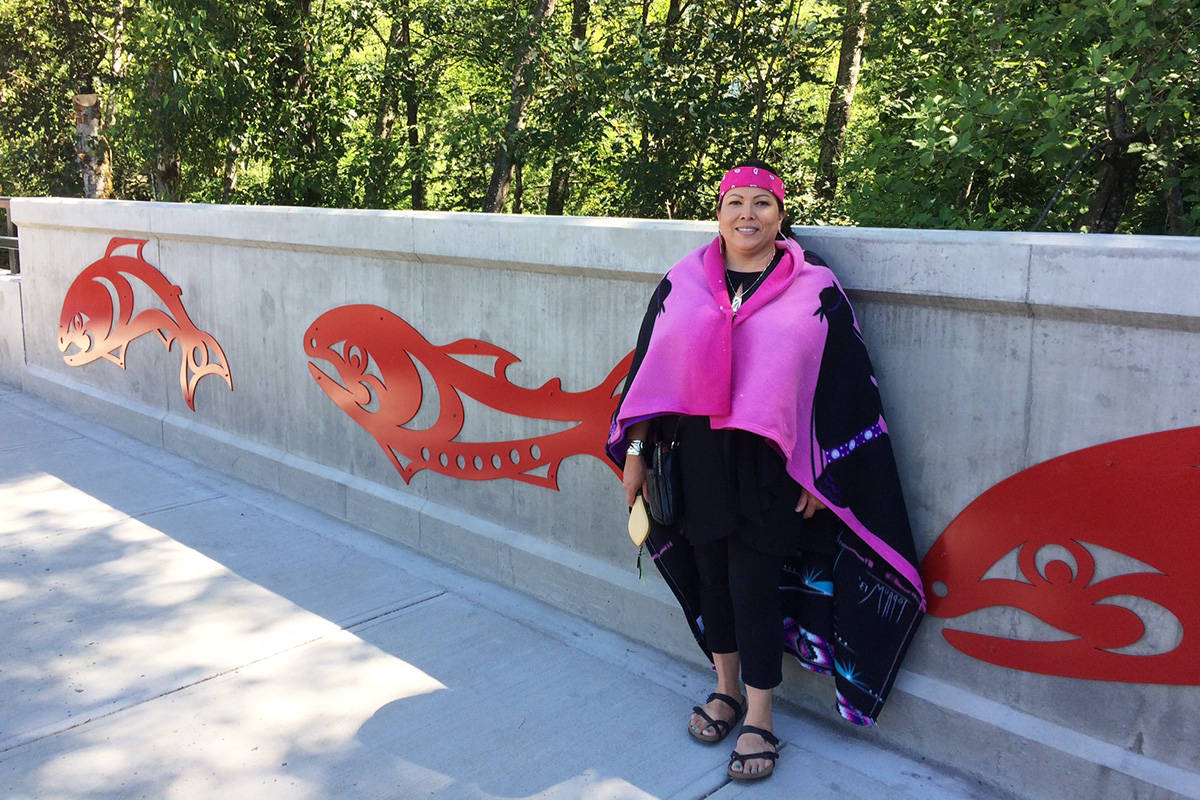
We Are All Connected to This Land by Phyllis Atkins, Kwantlen First Nation, is installed on a small bridge on King George Highway spanning Bear Creek. The design features three salmon (one male, one female, one two-spirited), a sun, an eagle, a moon, and a wolf, cut from powder-coated red aluminum and mirrored on both sides of the bridge.
Phyllis Atkins at blessing ceremony for We Are All Connected to This Land Photo: Surrey Now-LeaderPhoto: City of Surrey
The animals are described on the artwork’s page on the City of Surrey website:
“Salmon are resilient creatures that make an arduous journey to return to their freshwater spawning grounds, such as Bear Creek, to give new life and sustain eagles, bears, wolves, and people. The wolf represents the teacher and guide of the Kwantlen People while the eagle flying closest to the sun is carrying prayers to the Creator. The inclusion of Grandfather Sun and Grandmother Moon contrast day and night and indicate the passage of time.”
Teachers should avoid giving “meaning” to each animal as it often leads to appropriating spirit animals. Instead, ask “Can you think of characteristics of each animal that might be important?”
What if these figures were the core of a pattern? What if, like Nadine’s 3-D shapes at the top of this post, we could pick up and play with these figures? We could create repeating patterns like salmon-eagle-wolf or finned-winged-4legged. We’re not limited to left-to-right patterns arranged in a line. Different displays of patterns will bring to light different patterns. For example:
AB
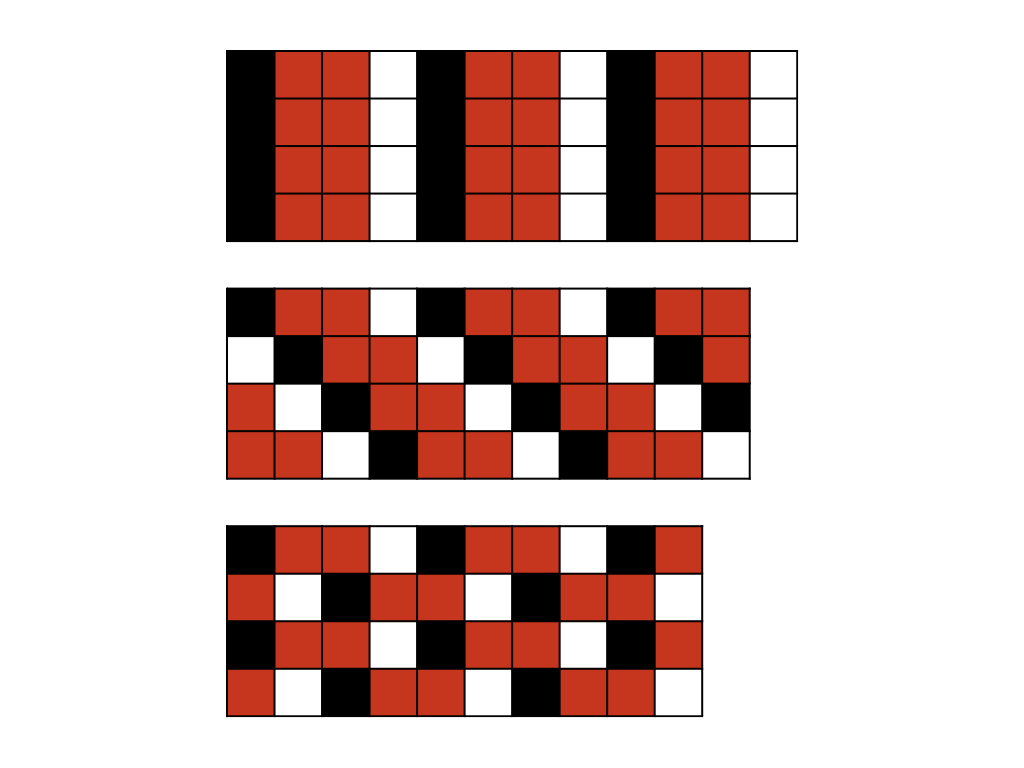
Maybe this example better illustrates this idea:
ABBC three ways
In the second and third arrangements I interrupted the black-red-red-white pattern core in the first row to offset the pattern in subsequent rows. What (new) patterns can you find? What would the fourth arrangement look like? What’s the pattern in the patterns? Like the idea of patterns as “ripples that carry the elements away from the centre” above this structure provides us with new ways of thinking about the core of a pattern: we can think in terms of repeating vertical columns just as we would if we were bead looming. (To learn more about bead looming, please register for Nelson’s Culturally Responsive Math webinar series. It’s free!)
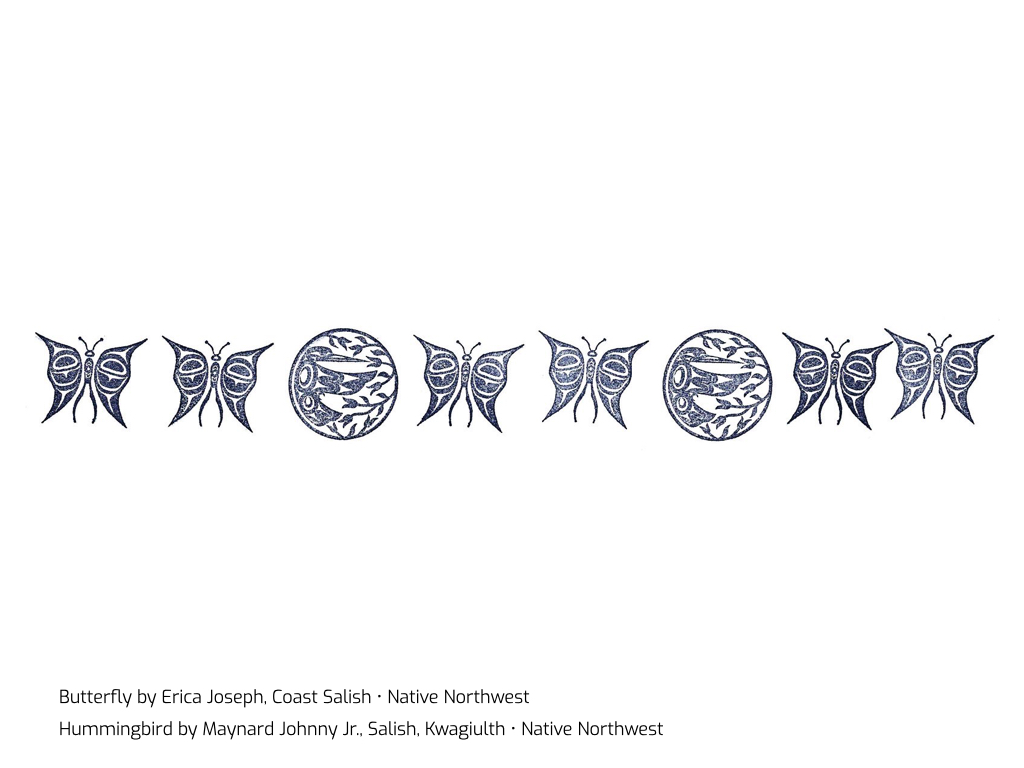
Teachers can use First Nation rubber stamps — available from Strong Nations — to explore repeating patterns of animal images. While we strive to embed local content, this is not always possible so we may blend Coast Salish and Northwest Coast art.
AAB
A playful approach is to begin a pattern — say wolf, raven, … — and ask “What comes next?” Some students will suspect an AB pattern and predict wolf. Others will suspect that you’re trying to trick them by not revealing the entire pattern core; they might predict raven (ABB) or orca (ABC). Ask “How confident are you?” Repeat this a few times. Suppose that you’ve revealed wolf, raven, wolf, raven, wolf, raven. By now, students will be very confident that wolf will come next. Mess with them: add bear instead. Ask students “What’s my pattern rule? Would you like to revise your thinking?” and have them share their conjectures. Next, add eagle. Can students identify the pattern as 4legged-winged? And what if we throw colour or orientation into the mix? Multiple attributes can add ambiguity to pattern tasks. Invite students to use these stamps to create their own repeating patterns.
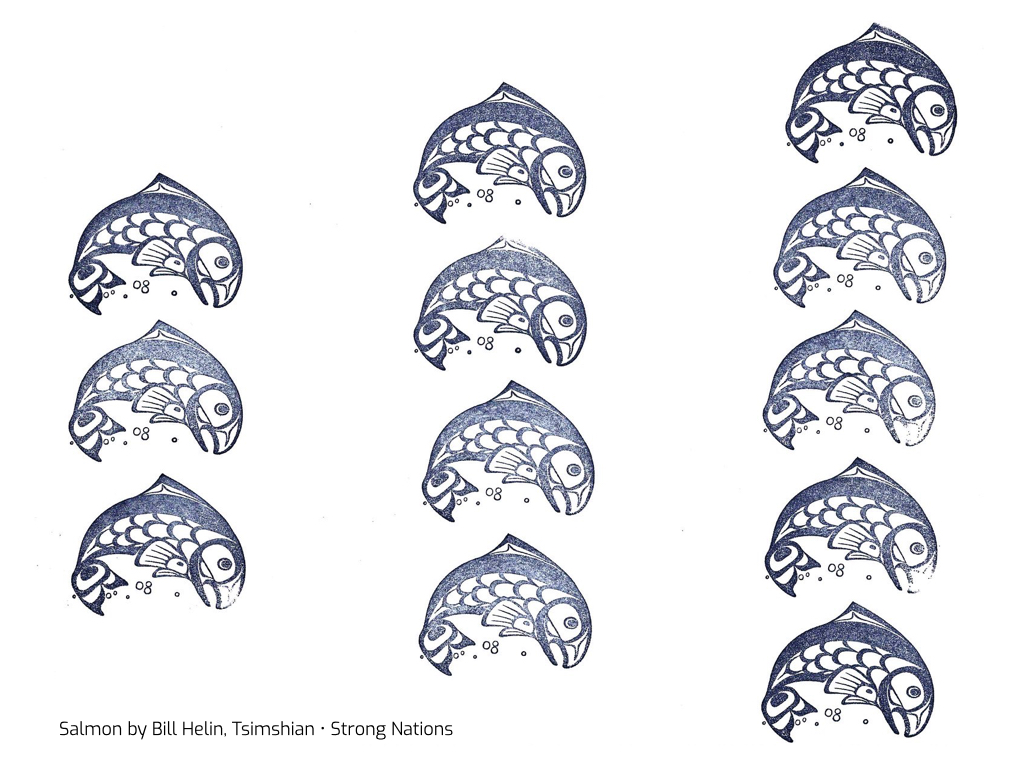
Beginning in Grade 2 (and continuing into Grade 10), students learn about increasing patterns. In Grade 2, it is expected that students describe the salmon pattern below as “start at 3 and add 1 each time”; in the upper intermediate grades, students describe the pattern as n + 2; and in Foundations of Math and Pre-Calculus 10, this is formalized as slope (or rate of change) and y-intercept (or constant).
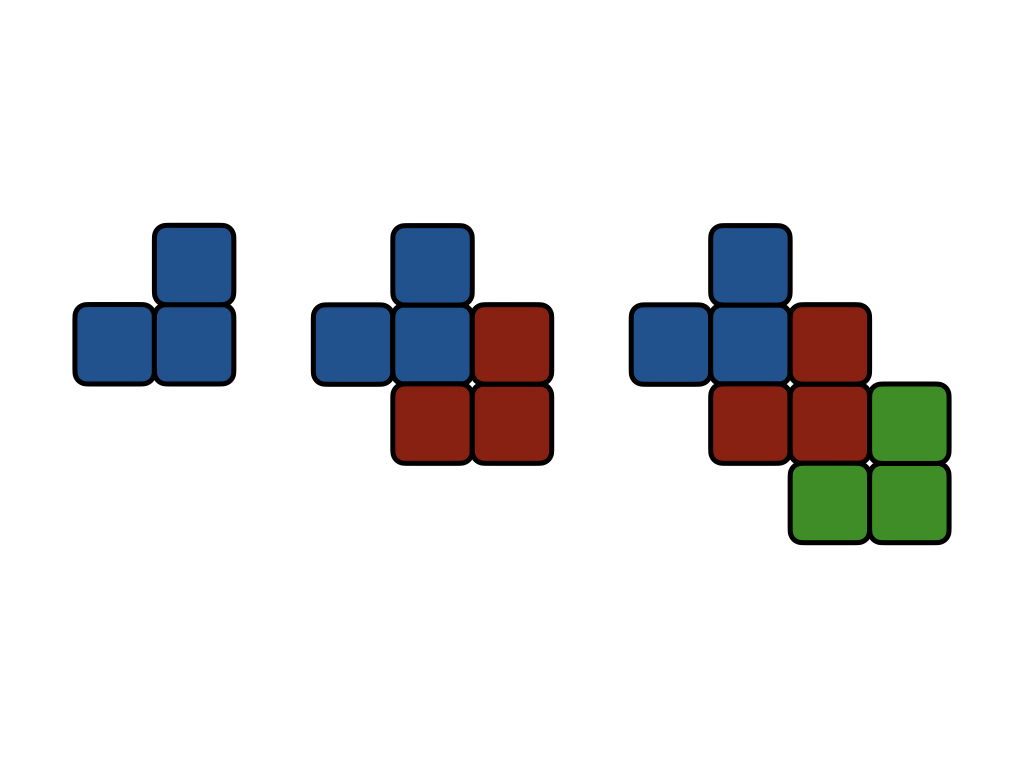
You might have noticed that three tiles were added and imagined a linear pattern — 3n as either n groups of three or three groups of n:
You might have saw this as doubling and visualized an exponential pattern — 3(2)ⁿ ⁻ ¹:
Or you might have spotted squares and pictured a quadratic pattern — n² + 2:
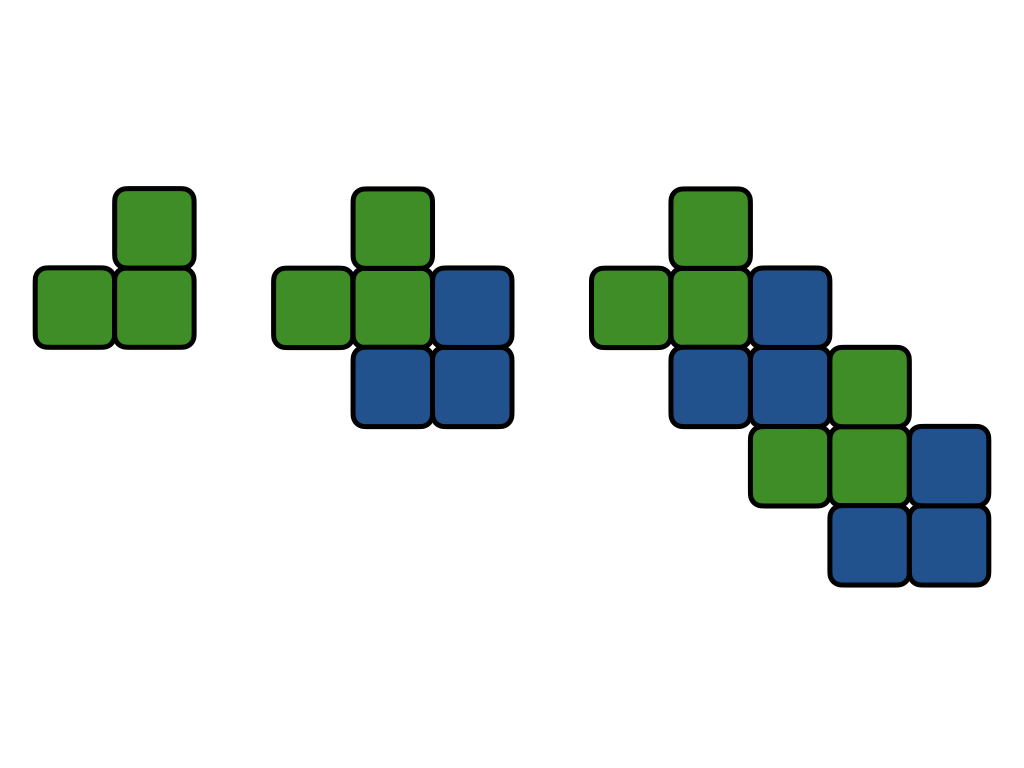
In later grades, these more complex patterns (quadratic, exponential, triangular numbers, Fibonacci) can be introduced. Again, there’s a chance to spotlight First Nations art. Here’s a different arrangement of 3, 6, …
What comes next? What else might come next?
(If there’s a way to see a quadratic pattern in this arrangement, I can’t make it out.)
I’m more than a bit apprehensive about sharing these last two examples. They feel inauthentic: swap in dots for the images of animals above and the task remains the same. However, in using these images and first teaching their cultural significance, I’m hopeful that this communicates my respect for First Nations culture, especially to Indigenous learners (and outweighs my concerns about curriculum design).
Huy ch q’u Nadine McSpadden and Heidi Wood for continuing to help me make connections between the cultural practices and perspectives of First Peoples and the teaching and learning of mathematics.
A few years ago, I completed a questionnaire to determine my personal operating style. I’m green. Creativity. At first, I questioned the validity of the assessment. I didn’t see myself as creative. I’m not… artsy.
But taking a closer look, the results made sense. I scored very highly in the four strategies that made up creative thinking in this system: brainstorm ideas, challenge assumptions, reframe problems into opportunities, and envision possibilities. To be clear, this was an assessment of preferences, not proficiencies.Also, there are trade-offs; to choose one thing is to reject another. For example, my 98 in reframe and 91 in envision meant zero — zero! — in tune-in to feelings and ten in empathize with others. These results did not suggest that I can’t tune-in and empathize; they did suggest that I don’t want to. Preferences, not proficiencies.
More important to this post, this assessment tool offered a different definition of creativity: “the generation of a wide variety of options, ideas, alternatives and fresh ways of approaching difficult situations and everyday challenges.” BC’s Ministry of Education defines creative thinking, one of the core competencies, as “the generation of new ideas and concepts that have value to the individual or others, and the development of these ideas and concepts from thought to reality.” There are similarities between these two definitions: both talk of the generation of novel ideas; neither talk of art.
Broccoli with Cheese Sauce
The MoE also has this to say: “Core competencies are evident in every area of learning; however, they manifest themselves uniquely in each discipline.”
Over the last few years, I’ve sat through many presentations where examples of creative thinking across subject areas have been shared. The examples from mathematics almost always make me cringe. The math song is a common offender. (Usually the topic tips towards the procedural — BEDMAS, the quadratic formula, etc. — but that’s a different post.) Here, creative thinking manifests itself outside of mathematics. It happens in language/fine arts. (Maybe. Talk to a language/fine arts teacher.) You can substitute provincial capitals for divisibility rules and the nature of creative thinking within the task remains unchanged. Math is merely the context.
Worse, the message is that math is unappetizing in and of itself. Broccoli. The cheese sauce that is the math song (or poster, or skit, or diorama, or …) comes at a cost. Limited time means tension — time spent on products versus time spent solving interesting problems and having interesting conversations. Note: in my mind, the opportunity cost isn’t coverage of content; it is engaging students in the “doing” of mathematics.
Yesterday, I attended a meeting where the MoE repeated the message: “By doing the curricular competencies, students will be developing their core competencies.” The math song attempts to have students develop a core competency without doing the curricular competencies.
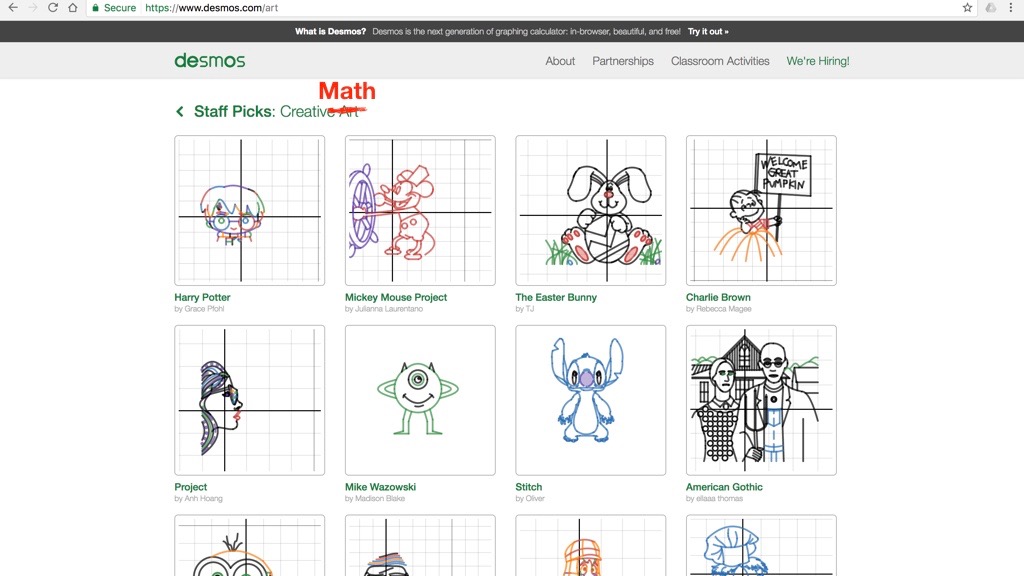
Et tu, Desmos?
The connection between creativity and art is strong:
I’d like to suggest a better title:
Creative Math is clearly evident. Just click on one of the staff picks and look to the left. Focus not on the equations themselves, but on the thinking behind them. Not on “front mathematics,” but on “mathematics in back.” (A lovely metaphor from Reuben Hersh that I first came across in Tracy Zager’s Becoming The Math Teacher You Wish You’d Had.)
To most math teachers, this title makes no difference. Just me nitpicking. But it matters where teaching includes designing curriculum/learning experiences. If teachers think of creativity in terms of art, they may look to Pinterest when planning; if they think of creativity in terms of ideas, they may dive deeper into Desmos.
Last year, one of my highlights was being invited into a classroom to observe Marbleslides: Lines in action.
I observed students experimenting with new ideas by changing the variables one at a time. They asked “what if…” questions. They made — and checked — predictions. “New ideas” here means new to the students themselves. These new ideas had value, evident in cheers and high fives. “Right here, right now” value, not “real-world,” career, or “when you take Calculus” value.
(The Desmos Teaching Faculty designed the activity with students in mind who were familiar with equations for lines in slope-intercept form and the idea of domain. In the classroom that I visited, the students were not. We worried that introducing restrictions on the domain at the same time as slope-intercept form would overcomplicate things. It didn’t.)
I don’t fault my fellow educators for associating creativity with art. It’s a natural thing to do. We in mathematics education need to articulate better what creative thinking looks like in mathematics. I’ve had some success in asking teachers to sort curricular competencies by core competency. (Here they are, in random order. Venn diagrams work nicely; I let that idea come from teachers themselves.)
There’s still the leap required to go from making these connections to designing curriculum/planning learning experiences with these connections in mind. Rather than listing activities that elicit creativity, like Marbleslides above, it may be helpful to think about the attributes of these tasks.
Marbleslides is immediately accessible and highly extendable (“low floor, high ceiling”). It invites a wide range of responses (multiple solutions). (The teacher can view novel solutions at a glance on the dashboard.) Open questions, like Which one doesn’t belong?, share these attributes, as does Quarter the Cross.
A rich task can have a single solution, but invite a wide range of approaches (multiple strategies). To me, this has less to do with the task/problem itself and more to do with pedagogy. A curriculum that values creative thinking has pedagogical implications. Consider a typical What’s the best deal? task. A step-by-step-worked-examples-now-you-try-one approach to teaching leaves little room for creativity. The strategy — calculate and compare unit prices — is predetermined. What if students were presented with the problem before the strategy? The class would generate several different ways to solve the same problem. They’d see and discuss a wide range of ideas. Note: this doesn’t preclude the teacher from later bringing a particular strategy (e.g., compare unit prices) to the conversation, if necessary. Ask “Why does this strategy make sense?” or “What’s the best strategy?” and students develop another core competency: critical thinking.
Mathematics is creative. Is math class?
In her ShadowCon talk, Tracy Zager shared a word cloud generated from the language mathematicians use to describe their work. Creative sticks out. And invent, curiosity, play, imagination, wonder, etc. The image generated from the language society/teachers use to describe math… not so much.
But I know that there are places where school math is creative. In Surrey Schools (#sd36learn), in the “MathTwitterBlogoSphere” (#MTBoS), and beyond. When I wrote “We in mathematics education need to articulate better what creative thinking looks like in mathematics” above, I really meant “I need to articulate better…” So, I need your help. Did I get it right in this post? Artsy or not, what does mathematical creativity look like in your classroom?
Sometime last year, this question, or some variation on the theme, leapfrogged “Where can we find good problems?” as the most frequently asked FAQ asked of me. Below, my answers, as of today.
“Formatively.”
“You clarify and share learning intentions and success criteria. You implement rich tasks that elicit evidence of student thinking. You pose questions that cause thinking.”
I presented teachers with four sample student responses to the following question:
A store sells a box of nine 200 g bags of chips for $12. How much should the store charge for twenty-four 200 g bags?
I asked teachers to consider (1) Where is the learner going? (2) Where is the learner right now? and (3) How can the learner get to where she needs to go?
This sparked some interesting conversations. The students in the top left and top right know that a unit price is an equivalent rate where one term–number of bags in TL, dollars in TR–is one. The student in the bottom left also knows that proportion problems can be solved by looking for a scale factor–albeit an inaccurate one–between ratios. What’s going on with the student in the bottom right? What’s the learning goal in terms of content? What’s the learning goal in terms of curricular competency? This activity was preceded by a conversation about the KDU model, so teachers were thinking “use multiple strategies” and “communicate mathematical thinking.” Is it fair to consider “use multiple strategies” using this–or any single–task as evidence? (A good time to bring up triangulation–products, observations, conversations with students.) What does “good” communication look like in mathematics? Do the bottom two responses need words? Would a ratio table help answer what’s going on in the bottom right?
While this was a worthwhile exercise, this answer was “not yet meeting expectations.” One reason for this is that assess is often a euphemism for evaluate. Or grade. Or report. As a student teacher, my school associate once asked me how I planned to assess. I began to tell him about upcoming quizzes. “That’s all well and good, but that’s evaluation. Minute-by-minute, day-by-day, how will you know they know?” This has been helpful for me as I’ve navigated through assessment by preposition (assessment of, for, or as learning) and “Is this formative or summative?”
“Assess what?”
Answering with another question is probably unsatisfactory, but, to me, what is a much more important consideration than how.
The Ministry of Education released the following in the summer:
At the end of the school year or semester, Boards must provide a written summative report to parents that address the student’s progress in relation to the learning standards of the curriculum in all areas of learning as set out in the Required Areas of Study Ministerial Order.
(Emphasis added.)
Learning standards in BC’s curriculum are made up of curricular competencies (“what students are expected to do“) and content (“what students are expected to know“). (#MTBoS, think practice and content CCSS-M standards.) As late as June, some teachers were still wondering if there would be a requirement to assess–or evaluate? or report on?–the curricular competencies. To me, the MoE’s choice of “learning standards” makes this clear.
At the same time, there’s another message out there: learning standards and curricular competencies are synonymous. The gist of this idea is that content is interchangeable. And maybe that’s more true in other areas of learning. (I still take issue with “If you enjoy teaching ancient Egypt and ancient Egypt has moved, then you can still teach ancient Egypt” but social studies isn’t the hill I’ll die on.) And I’m all in favour of a greater emphasis on students doing mathematics. Helping teachers make this happen is my work–it’s what I (try to) do. Still, I’m baffled.
Of course, nobody argues that process and content exist without one another other. In the classroom, “I can use multiple strategies to solve problems involving ratios and rates” or “I can communicate my thinking when solving proportional problems” work as learning intentions. I can design learning experiences around these. My question is about evaluating: together or separately? Consider the student in the bottom right above. If she “fully meets expectations,” or is “proficient,” or is a “Jedi Knight,” it’s easy–the learning intentions above still work. But if she, as most agreed, isn’t, then why is that? My take is that she is proficient with respect to content (proportional reasoning)–or, at least, here’s one piece of supporting evidence–but not quite there yet with respect to competency (communicate thinking). What are some implications surrounding reassessment? And is it possible to fully meet with respect to competency without also possessing a deep level of content knowledge?
I’m beginning to enter the Land of the Gradebook, which, nine times out of ten, is at the heart of teachers’ “How do we assess it?” Standards-based grading, depth of knowledge, learning maps, rubrics, portfolios, etc. will be part of part two.
This year, BC teachers (K-9) implement a new curriculum. For the past two years, much of my focus has been on helping teachers–in all subjects–make sense of the framework of this “concept-based, competency-driven” curriculum. This will be the topic of these next few posts.
In this series on curriculum, I’ll do my best not to use curriculum. There is no agreed upon definition. I imagine that if any educator in the “MathTwitterBlogoSphere” (#MTBoS) followed the link above, she’d be shouting “Those are standards, not curriculum!” Similarly, when #MTBoS folks talk about adopting curriculum, I’m shouting “That’s a resource, not curriculum!”
My union makes the following distinction: “Pedagogy is how we teach. Curriculum is what we teach.”Curriculum as standards. For the most part, this jibes with how curriculum is used in conversations with colleagues and is echoed in this Ministry of Education document. But Dylan Wiliam doesn’t make this distinction: “Because the real curriculum – sometimes called the ‘enacted’ or ‘achieved’ curriculum – is the lived daily experience of young people in classrooms, curriculum is pedagogy.” Curriculum as experiences. Or pedagogy.
Rather than curriculum, I’ll try to stick with learning standards, learning resources, or learning experiences.
Three elements–Content, Curricular Competencies, and Big Ideas–make up the “what” in each subject and at each grade level. Last summer, the Ministry of Education simplified this as the “Know-Do-Understand” (“KDU”) model. The video below describes how content (what students will know), curricular competencies (what students will do), and big ideas (what students will understand) can be combined to direct the design of learning activities in the classroom.
I imagined planning a proportional reasoning unit in Mathematics 8 using the KDU model and shared my thinking throughout this process.
This slideshow requires JavaScript.
Teachers can start with any of the three elements; I started by identifying content. (It’s a math teacher thing.) Then, I paired this content with a big idea. In English Language Arts and Social Studies, it makes sense to talk about you, as the teacher, making decisions about these combinations. In Mathematics and Science, this mapping is straightforward: algebra content pairs with a big idea in algebra, not statistics; biology content pairs with a big idea in biology, not Earth sciences. (BC math teachers may notice that the big idea above is different than the one currently posted on the Ministry of Education website. It may reflect a big idea from a previous draft. I can’t bring myself to make that change.)
Identifying curricular competencies to combine with content and big ideas is where it gets interesting. Here, my rationale for choosing these two curricular competencies was simple: problems involving ratios, rates, and percent lend themselves to multiple strategies… we should talk about them. The video makes the point that I could go in the opposite direction; if I had started with “use multiple strategies,” I likely would have landed at proportional reasoning. Of course, other curricular competencies will come into play, but they won’t be a focus of this unit. This raises questions about assessment. (More on assessment in an upcoming post.)
Note that “represent” is missing from my chosen curricular competencies. Why is that? My informed decision? Professional autonomy for the win? Or my blindspot? A teacher who sees proportional reasoning as “cross-multiply and divide,” who is unfamiliar with bar models, or double number lines, or ratio tables, or who sees graphs as belonging to a separate and disconnected linear relations chapter wouldn’t think of connecting this content to “represent.” Making connections between these representations is an important part of making sense of proportional reasoning. Will this build-a-standard approach mean missed learning opportunities for students? This speaks to the importance of collaboration, coaching, and curriculum, er, I mean quality learning resources.
In early talks, having these three elements fit on one page was seen as a crucial design feature. Imagine an elementary school teacher being able to view–all at once!–the standards for nine different subjects, spread out across her desk. As a consequence, the learning standards are brief. Some embraced the openness; others railed at the vagueness. In some circles, previous prescribed learning outcomes are described using the pejorative “checklist”; in others, there is a clamouring for “limiting examples.” (Math teachers, compare these content standards with similar Common Core content standards.)
I wonder if the KDU model oversimplifies things. If you believe that there is a difference between to know and to understand, then you probably want your students to understand ratios, rates, proportions, and percent. For a “concept-based” curriculum, it’s light on concepts. Under content, a (check)list of topics. To that end, I fleshed out each of the three elements (below). But I have the standards I have, not the standards I wish I had. (Free advice if you give this a try: don’t lose the that in that stem below.)
I wonder if the KDU model overcomplicates things. Again, U is for what students will understand. But “understanding” is one of the headers within the D, what students will do.
Despite this, I have found the KDU model to be helpful. In particular, it’s been helpful when discussing what it means to do mathematics. The math verbs that we’re talking about are visualize, model, justify, problem-solve, etc., not factor, graph, simplify, or solveforx. Similar discussions take place around doing science (scientific inquiry) and social studies (historical thinking).
More broadly, the model has been helpful in making sense of the framework of our new curriculum, or standards. It’s a useful exercise to have to think about specific combinations–far more useful than:
Q: “Which competencies did we engage in?”
A: “All of ’em!”
We’re still some distance from “the lived daily experience of young people in classrooms” but it isn’t difficult to imagine learning experiences in which this specific combination of the three elements come together.


 ;
;  ” are authentic. Rather than eliminate unit tests, teachers can look at them through different lenses; a points-gathering perspective shifts to a data-gathering one. Evidence of student learning can take multiple forms (i.e., products, observations, conversations). In this post I will focus on products, specifically unit tests, in part to push back against the sentiment above.


 for ① and
  for ②. (I’m second-guessing that this targets only Extending;
  for ① and
  for ② works too.) This task also elicits evidence of students’ capacities to reason and to communicate–two of the curricular competencies.
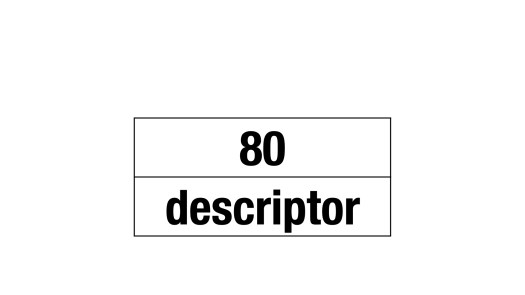


 implies knowing
  .
.
 ?
?


