Wanted Parabola

As much as I love mathematical modelling, so much of Math 10 to 12 is contextless stuff like this:

Determine an equation of a quadratic function with vertex at (-5, 3), passing through the point (-7, 15).

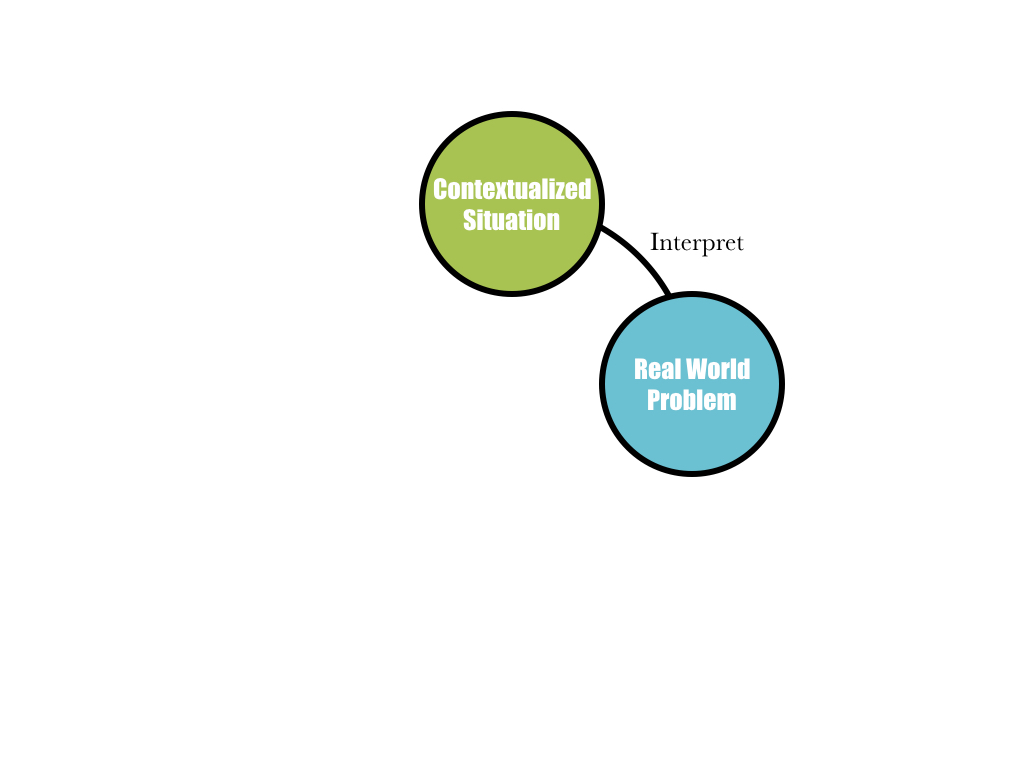
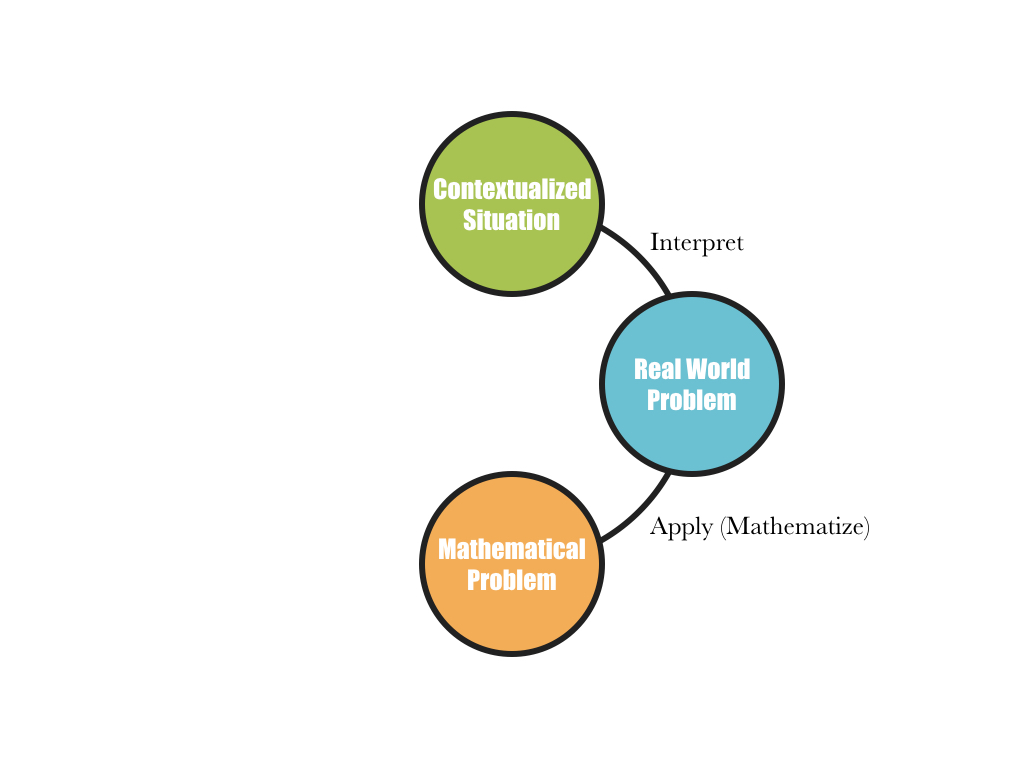
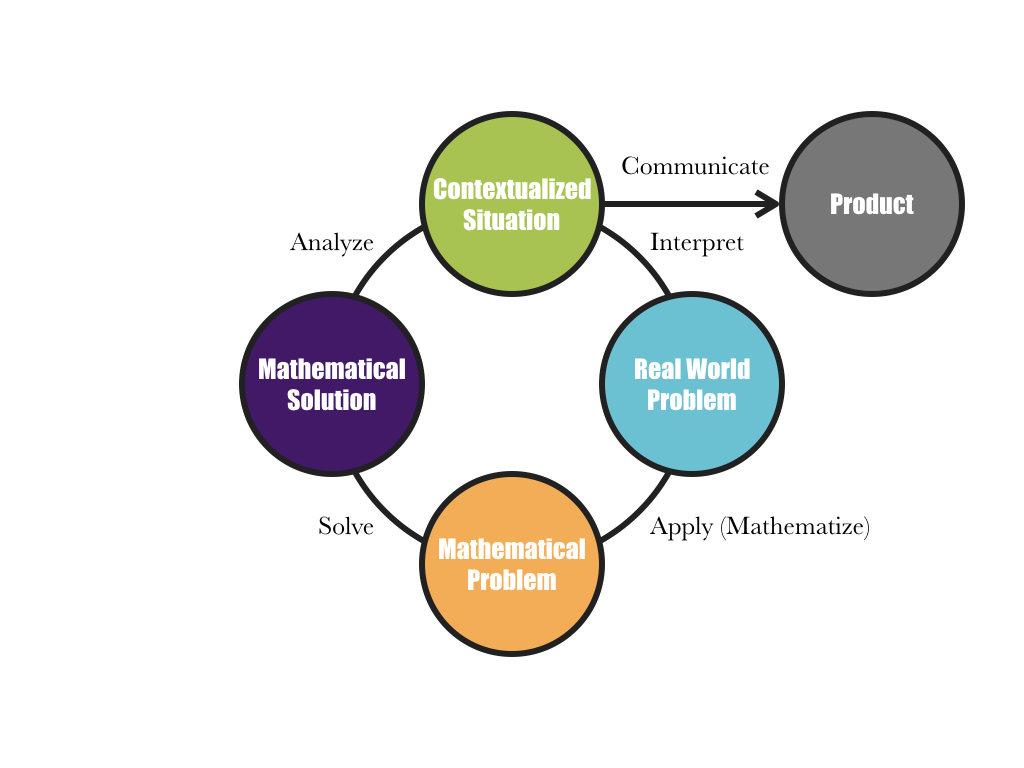
Lately I’ve been looking for activities that address this sort of naked math yet engage learners in processes similar to those in a mathematical modelling cycle.

Consider the exercise above. What questions could you ask? If I were to ask a student about their equation, I’m likely to hear play-by-play, not colour commentary: “… and then I plugged -7 and 15 in y = a(x + 5)² + 3. Negative seven plus five is two…”

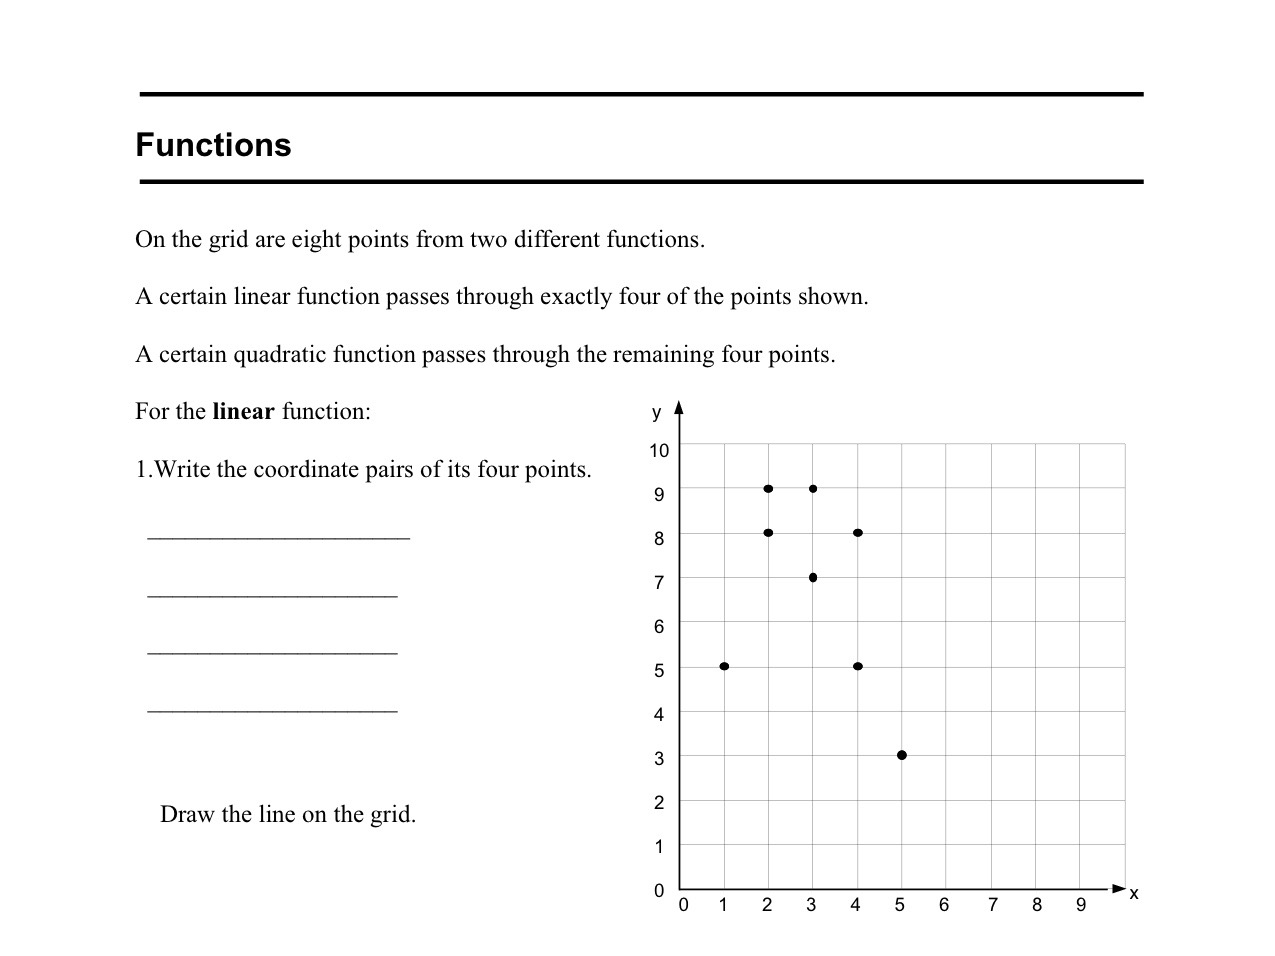
Instead, I could have students try to figure out a quadratic function that satisfies a set of criteria, gradually revealed to them as “clues.” Throughout, students would check their quadratic functions and make changes when necessary. This is the gist of Wanted Parabola, my adaptation of Cathy Marks Krpan’s Wanted Number:

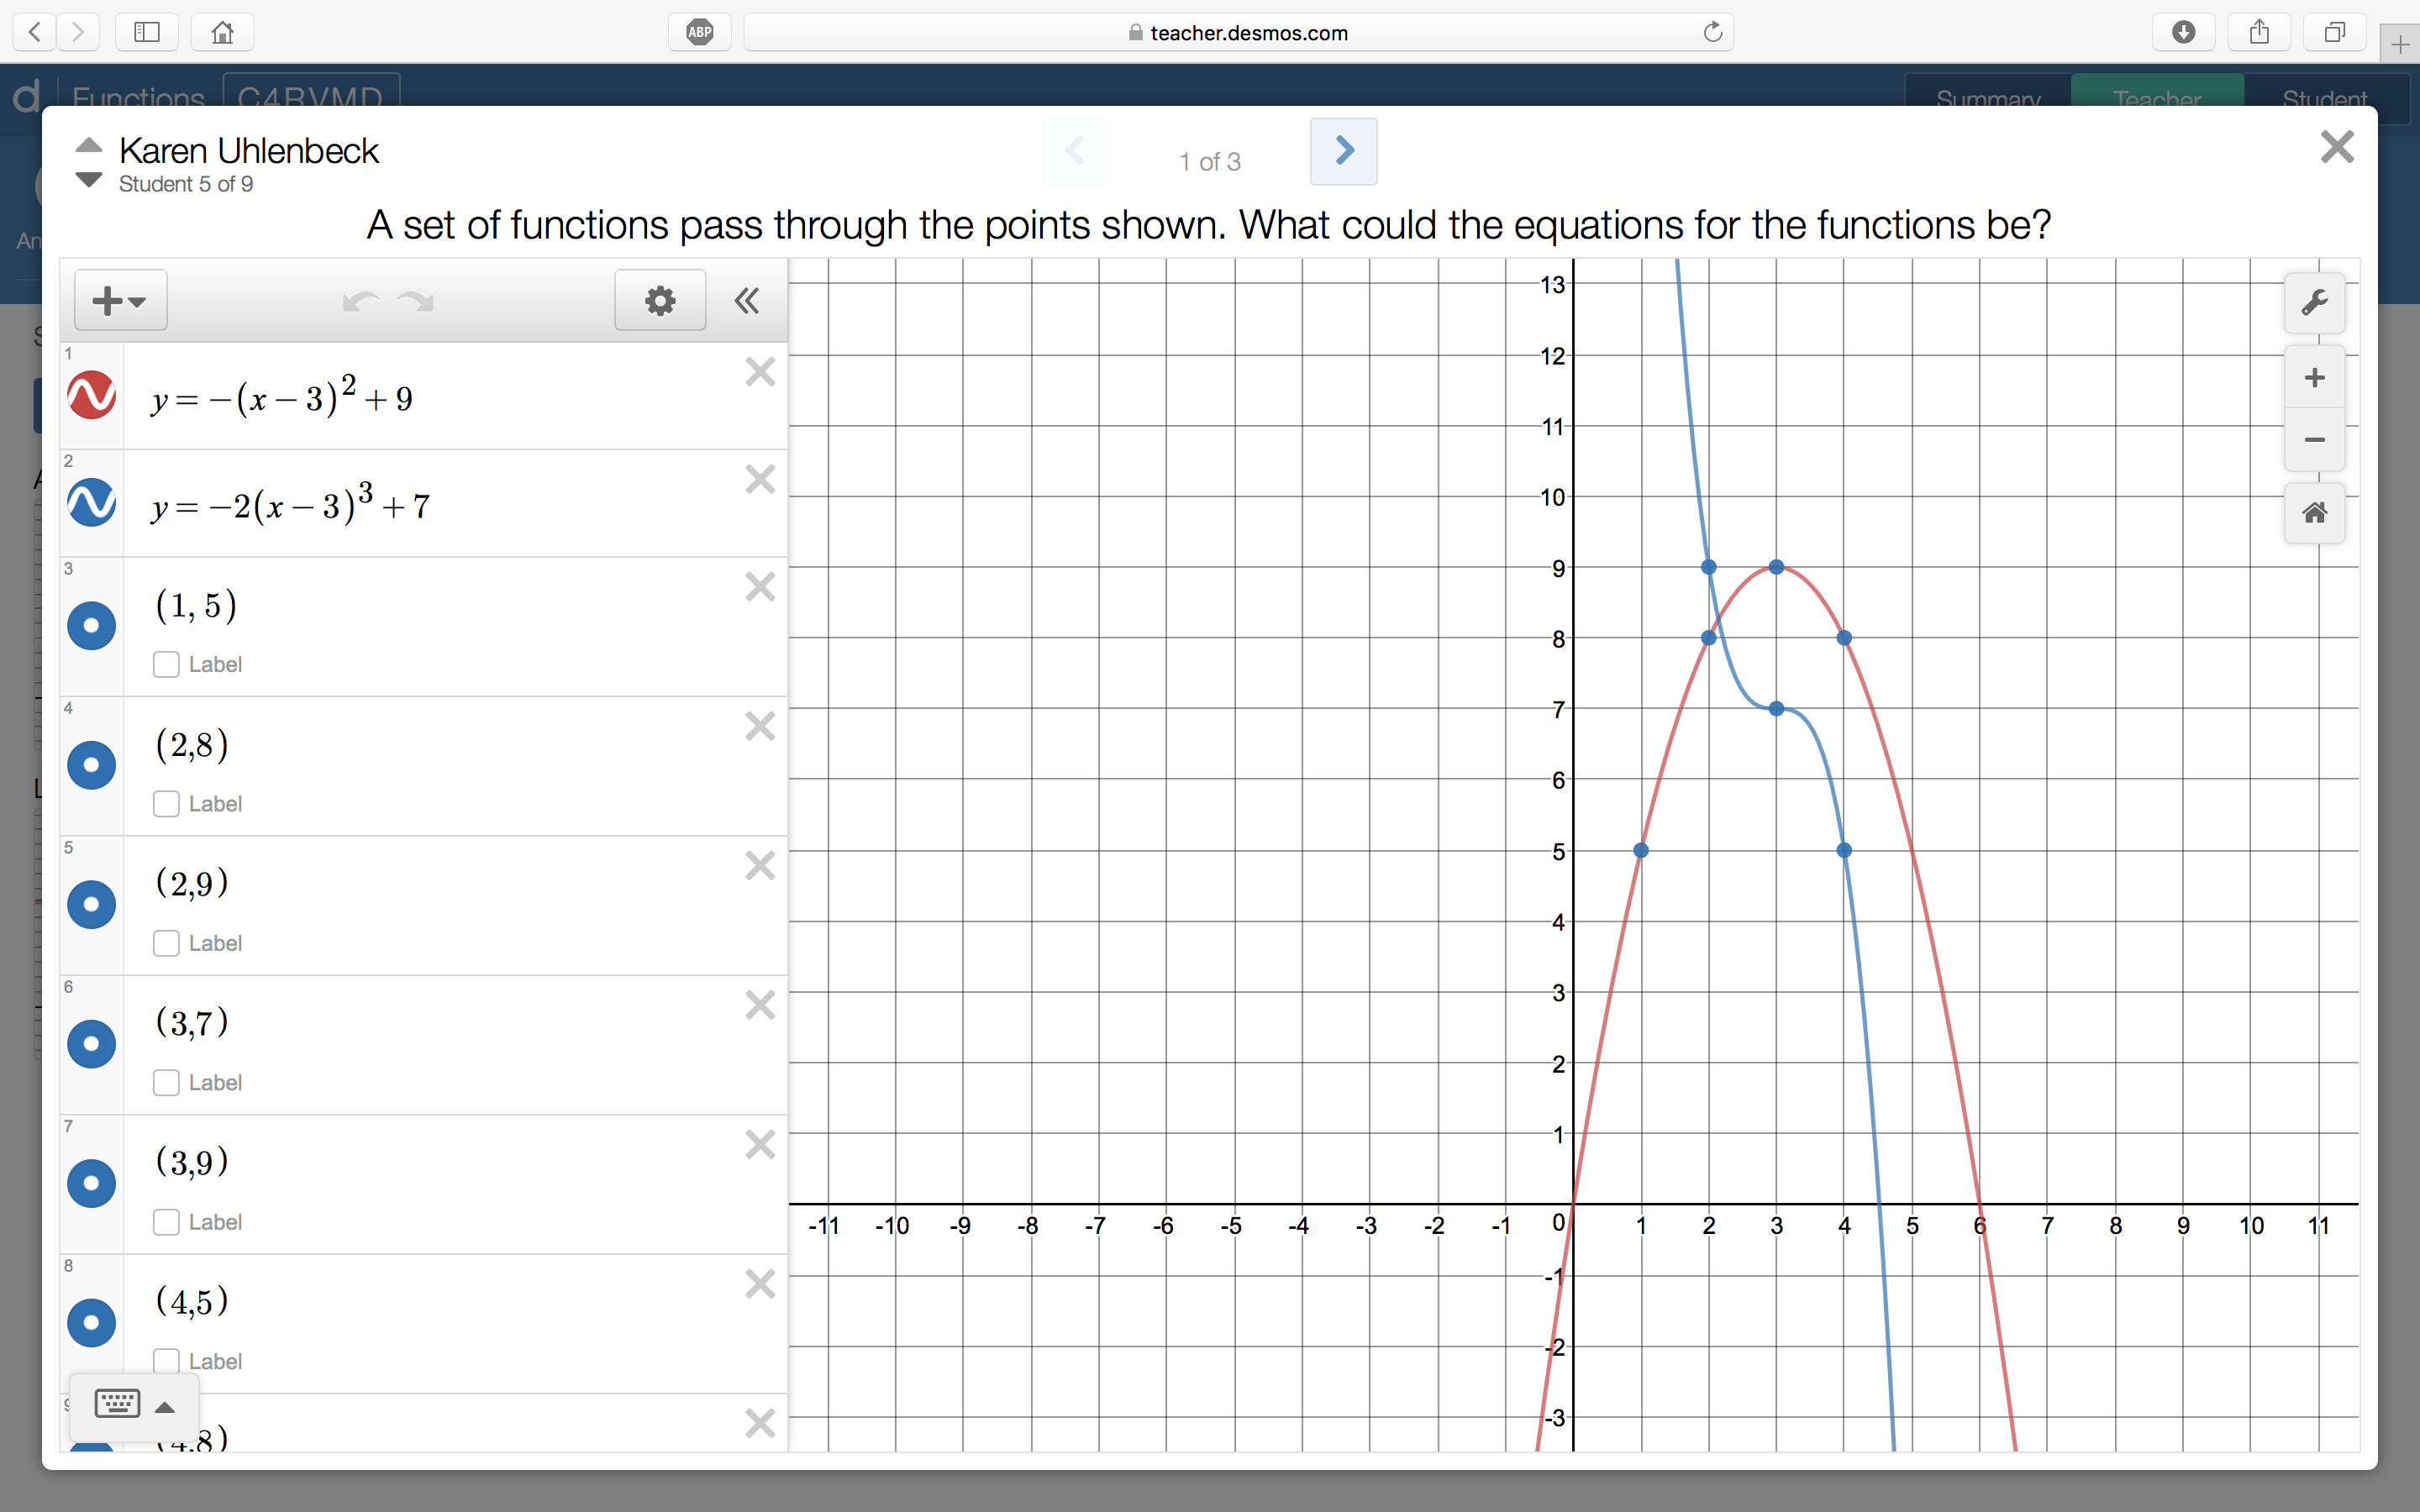
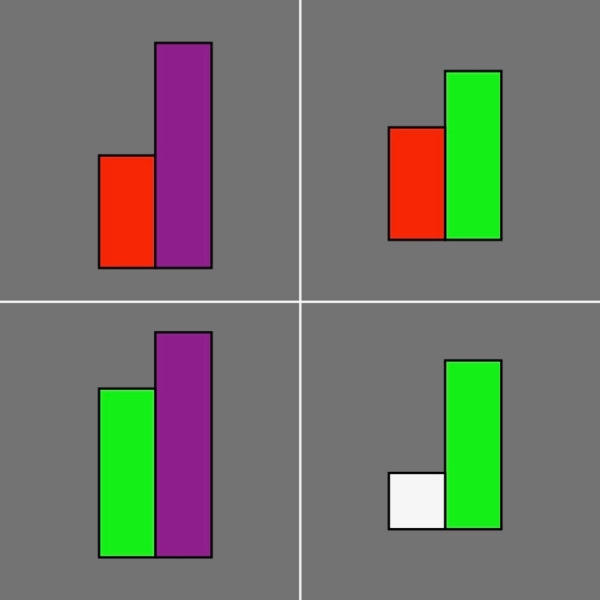
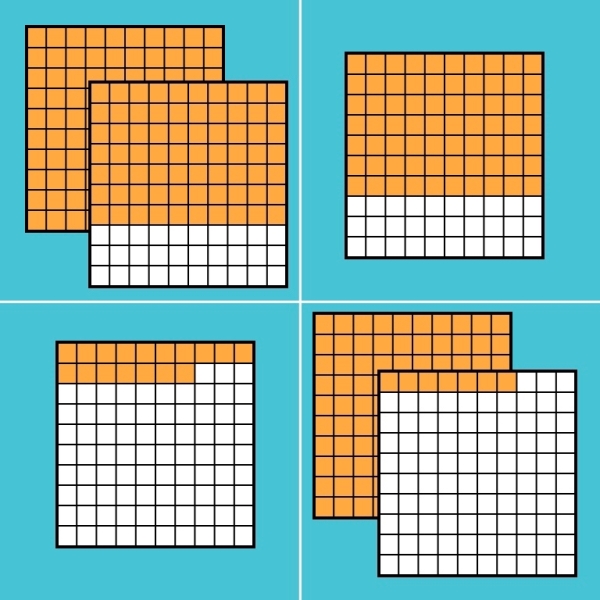
I started with a very general clue: the direction of opening. I anticipated a variety of parabolas, which I got when I tried this activity out with math teachers in my district. When I tried this activity out in the MathTwitterBlogoSphere (#MTBoS), I got a bunch of y = x²s. The biggest difference was that my colleagues were invited to draw a parabola (on whiteboards) whereas my tweeps were asked to write an equation (in a Desmos activity). It’s interesting to think about this activity in terms of freedom and constraints. When I revealed the next clue, it pushed my colleagues’ thinking together. However, from my tweeps, it triggered new and diverse ideas, simulated here:

I like this as a blank-page (or whiteboard) activity but a Desmos activity (1, 2, 3) does provide the opportunity to talk about some interesting overlays. If using vertical non-permanent surfaces (#VNPS), I’d stop partway through to hold a “board meeting” where students would share possible parabolas.

In general, I progressed from providing more general to more specific clues. For example, “vertex in QII” divulges p < 0 before “axis of symmetry x = -5″ gives away p = -5. Most clues add new information and move students closer to the Wanted Parabola. Some confirm earlier decisions. For example, “vertex (-5, 3)” before “axis of symmetry x = -5″ and “minimum value of 3.” This last clue is anticlimactic. An earlier clue, “never enters QIII,” is much more interesting. It might feel like new information. But it must be true given preceding clues; a parabola that opens up and has no x-intercepts cannot contain points in QIII (or QIV).

You can play with the order of the clues. A second Wanted Parabola:

Here, the direction of opening clue is revealed midway through the set. It doesn’t add new information but is reasoned to through “two x-intercepts” and “vertex in QI.” I meant to delay students determining the direction of opening a bit, hoping to surprise them after a few clues. In a third Wanted Parabola, “passes through” is the first clue; I anticipate that some students will place the vertex at this point.

Instead of “How did you find a?” you could ask “Which clues were helpful? Which clues were necessary?” In my mind, helpful ≠ necessary. A clue might be helpful if it pushes students in the direction of the Wanted Parabola despite not providing the values of a, p, or q. Or a clue might be helpful if it tells students that they’re on the right track. In the way that the first Wanted Parabola plays out, three pieces of information are necessary (to determine three unknowns): “minimum value of 3,” “axis of symmetry x = -5,” and “passes through (-7, 15).” If some students don’t argue that only two clues are necessary — “vertex (-5, 3)” and “passes through (-7, 15)” — you could ask “What is the fewest number of clues you need?”

This activity helps students develop an understanding of the different attributes parabolas can have. It provides an opportunity for students to solve problems, reason, explain, justify, and connect mathematical ideas in ways that “Determine an equation…” does not.

Wanted Parabola (.pptx) (.pdf)

References

Marks Krpan, Cathy (2013). Math expressions: developing student thinking and problem solving through communication. Toronto, ON: Pearson Canada.

Update

A Function of Freedom and Constraints

In June, a colleague invited me into his classroom to teach a Desmos modelling task — Predicting Movie Ticket Prices — in his Math 12 class. Students experienced exponential functions earlier in the course. We were curious about whether his students would apply what they knew about exponential functions to a task situated outside of an exponential functions unit — a task not having to do with textbook contexts of half-life, bacteria, or compound interest. They did. And they deepened their understanding of how change by a common ratio appears in exponential equations (vs. change by a common difference in linear equations). They did this within 45 minutes of a 75-minute class. So my colleague let me try out another, less sexy, task — one adapted from MARS. This task, like much of Math 12, is about naked functions; no real-world context here. Nat Banting’s closing keynote at #NWmath reminded me of it. Watch Nat’s talk; view his slides.

functions

The original MARS task above is closed: two functions, one linear and one quadratic, each passing through four points. I wanted to open it up so I changed the prompt: “A set of functions pass through the points shown. What could the equations for the functions be?” Also, I removed one of the points — (5, 3) — to allow for different solutions of two functions. The thinking is that open questions encourage a variety of approaches. And then, from fifteen pairs of students:

fA

I anticipated this. The points scream linear and quadratic. They are sources of coherence. I had lowered the floor but no Rileys entered y = 5, y = 7, y = 8, y = 9. The problem wasn’t problematic. I had raised the ceiling but no one wrestled with equations for sinusoidal or polynomial or radical or rational functions. The freedom within my open question didn’t bring about new and diverse ideas. To support creativity — mathematical creativity! — I had to introduce a source of disruption, a constraint“A set of nonlinear functions pass through the points shown. What could the equations for the functions be?”

A student could have used the linear nature of absolute value functions to get around my nonlinear constraint — a bit of a Riley move? — but no one did.

fC

Instead, some students picked up on the symmetry of two new possible parabolas:

fB

Writing the equation of the second parabola — finding the parameters a and q — presented more of a problem.

Others bent the line; they saw the middle of its three points as the vertex of a cubic function that had been vertically stretched and reflected:

fE

Some saw four compass points and wrote an equation of a circle. This led to a function vs. not a function conversation: “Does that count?” Others saw a sine function that passed through three of these four points. There were “close enough” solutions — great for Coin Capture but not quite passing through the given points:

I didn’t anticipate this. Students weren’t as constrained by “pass through” as I was. Also, they were motivated to capture the points using only two functions, as before.

With more time, I could have shifted constraints again: “A set of functions pass through the points shown. What could the equations for the functions be? (P.S. The graph of at least one of them has an asymptote.)” This would have triggered exponential and logarithmic or rational functions. (Even without introducing this constraint, we noticed at least one student playing with rational functions at the end of class.)

Above, there’s evidence to support Nat’s #NWmath conjecture: “Shifting constraints triggered new mathematical possibilities.” My (more) open question didn’t cut it. The student thinking — and conversations — that I had hoped for only emerged when freedom “sloshed against” constraints.

Desmos activity

Update

Edited & published in BCAMT’s Vector 62(2).

Howard Stern Loves to Show How He Does the Math

My Next Guest Howard Stern

About six and a half minutes into the latest episode of My Next Guest Needs No Introduction, host David Letterman asks guest Howard Stern how long they’ve known one another. Viewers are treated to a number talk. The transcript:

David: You know how long you and I have known one another?

Howard: How long?

David: Well, it’s pretty much to the month since 1984.

Howard: Wow. Now I’m gonna do some quick math and figure out how long that is, if you don’t mind. Now math happens to be… I’m good at it. This is how I do it. This is 2018. Right?

David: It’s 34.

Howard: Oh, you gave it away.

David: It’s 34 years.

Howard: Let me check your math.

David: Yeah.

Howard: The way I get to it is, you say 1984 and I add ten immediately.

David: Yeah.

Howard: That brings us to 1994.

David: That’s right.

Howard: That’s ten.

David: Yeah.

Howard: 1994, then 2004 is 20.

David: Yeah.

Howard: Now here’s tricky ’cause I get confused. 2004 to 2014 is another 10. That’s 30. You’re absolutely right. That’s 34 years. Good for you.

David: Now…

Howard: I love to show how I do the math.

David: Speaking of which, you realize that all of that will be subtracted from the show?

Howard: Wow. But really for you… I guess the premise of this show, although who knows what this show is… you know, I don’t even know what I’m doing here, but I thought the premise was that… you’re choosing six people… and I’m way more fun than Obama already, I’m sure. I mean, this is fun.

David: Really?

Howard: Oh, for God’s sake, yeah.

Lucky for us, Letterman didn’t subtract all of this from the show. Some observations…

Despite David giving away the solution, Howard continues to share his strategy. David is not the ultimate authority; Howard is eager to prove this solution. Howard, at least, is interested in Howard’s reasoning. He’s focused on sense-making, not answer-getting; how?, not what? All of this is typical of a classroom number talk.

Howard uses an adding up (or add instead) strategy for 2018 − 1984. He moves forward from 1984 to reach 2018. The context implies distance–not removal–which lends itself to this strategy. Stern’s jumping by tens gives us an opportunity to discuss efficiency, e.g., one jump of thirty rather than three jumps of ten. For what it’s worth, I used an adding up strategy too. First I added 16 to 1984 to get to 2000 (or six and ten to get to 1990 and 2000), then I added 18 to get to 2018.

David, of course, does not record Howard’s thinking. I might use this video clip to have teachers anticipate possible strategies for 2018 − 1984 and consider how they would record them. I chose an open number line to model Howard’s adding up strategy:

.pdf

Howard is confident: “Now math happens to be… I’m good at it.” He is enthusiastic: “I love to show how I do the math.” He is joyful: “I mean, this is fun.” Over the last two years, it has been my privilege to work alongside Surrey teachers Alex Sabell and Jonathan Vervaet (and others) as they’ve incorporated number talks in their classrooms. These same positive attitudes towards mathematics come through in their students’ interviews (see Alex & Jonathan).

What did you notice in this clip? What did I miss?

I’m Not The Finger Man

Keira, Grade 4, asked me to show her “the nines trick” one morning last week before school.

If you don’t know it, watch Jaime Escalante/Edward James Olmos:

I did not show my daughter this trick. I am not the Finger Man. It’s like she doesn’t even know me!

Instead, we had a quick conversation. No time for manipulatives. Five minutes to brush her hair and pack her lunch before we had to hop in the car.

Me: You remember what a ten-frame looks like?

Keira: Yeah. Ten dots. Five and five. Array!

Me: Ok, what about nine? What does it look like?

Keira: One missing.

Me: What if there were two nines? How many?

Keira: Don’t ask me that one. I already know it’s eighteen.

Me: Ha! Ok, what about seven times nine?

Keira: I knew that you were going to ask me that one!

Me: What if you had seven ten-frames, each with nine dots? How many dots altogether?

Keira: Sixty… three?

Me: Why?

Keira: You start with seventy but you take seven away.

We did a few more together. Success!

Then she asked me to show her the nines trick.

james corden face palm GIF by The Late Late Show with James Corden

For the purpose of this post, I quickly put together this slide (and video):

7*9.jpeg

In the car, Keira asked me “Can you multiply decimals? Like seven times nine point five?” This reminded me of “I’m wondering if fractions only work with circles” from Annie Fetter’s #NoticeWonder Ignite talk. (We showed it at a workshop the night before.) This also reminded me of what I take for granted. Her sister and I did some explaining, but I’m wondering about a better (?) approach:

7*9.5
How many do you see? How do you see them?

(Not my normal approach to multiplying decimals — the photo below probably had something to do with that.)

Would You Rather: Board Games BOGO

A few weeks ago, I took my daughter to the mall. Later, she complained that “Dad spent half the time taking math photos!” Five of one hundred twenty minutes is not half!¹

One of those photos:

Board Game BOGO.JPG

I thought that this would make a great “Would You Rather…?” math task. I considered a few approaches. My preference is probably to just display the offer and have students make up their own prices and riff on “What if…?” That might be a tall order. I created a few combinations. (More on these in a sec.) But I wanted something more open.

Here’s where I landed:

wyr -- board games.pdf

The idea is that students would mix & match specific combinations of board games to justify their decisions.

For example, consider Carcassonne ($43) and Blokus ($40). With “buy one, get a second 25% off” the discount is $10 (25% of $40). Add Othello ($35) and with “buy two, get a third 50% off” the discount is $17.50 (50% of $35). It looks like the second option is the clear winner. But if we think about the (total) percent discounts, we get about 12% ($10/$83) and 15% ($17.50/$118), respectively. Proportionally, the gap shrinks.

What if we replace Othello above with Spot it! ($20)? Again, the discount is $10 (50% of $20). But it’s not a tie. Saving $10 on $83 is better than saving $10 on $103 (about 12% vs. 10%).

There are a couple of combinations where we can’t justify the second option. For example, consider Catan ($63) and Pandemic ($60). With “buy one, get a second 25% off” the discount is $15. Add Rock Paper Scissors ($6) and with “buy two, get a third 50% off” the discount sinks to $3.

Beyond making and justifying a decision using mathematics, I’d push students to generalize: When would you rather…?

A couple more photos from the mall:

3*5

3*6

“Dad, stop taking photos of arrays! Are these like the paint splatter thing?” Yep. Partially covered arrays in the wild. Lack of fraction sense aside, it’s nice to know that she’s paying attention. And making connections.

¹BTW, I use Microsoft Office Lens to quickly crop, clean up, and colour these photos on the fly. An essential app for teachers using vertical non-permanent surfaces (#VNPS on twitter). Check it out.

March 2023

A few WYR…? prompts involving discounts (and more):

Okay, So, Um, Mathematical Modelling, You Know

“Okay, so, um, square both sides of…”

At that moment, three students jumped to their feet and cheered. High fives may have even been shared. I asked them what was up. They asked if we could talk about it later. (Never press here, by the way. Rookie mistake. If kids give you an out, take it.) So we did. Each student had estimated how many times I would say “Okay, so, um…” during the lesson. Their earlier excitement? I hit the highest of the three estimates.

I had completely forgotten about this episode until last spring when Canucks rookie Brock Boeser’s first ever NHL postgame interview made it into my Twitter timeline. At that time, I was helping teachers make sense of the Ministry of Education’s (MoE’s) “Process for Solving Numeracy Tasks” (a/k/a a mathematical modelling cycle). This post is a collision between the two.

Interpret

Mathematical Modeling.002

The Interpret process in this mathematical modelling cycle involves reading contextualized situations in order to identify real-world problems.

In this task, we can start with the following clip and ask “What do you notice?”

I noticed the sports clichés (NSFW). Brock Boeser’s “I just want to come here and help the team get a win” is damn close to “Nuke” Laloosh’s “I’m just happy to be here, hope I can help the ball club.” I also noticed that Boeser says “you know.” A lot. I wasn’t alone.

From here, we can develop a real-world problem by asking “What do you wonder?” or “What’s the first question that comes to mind?” My question: How many times does Brock Boeser say “you know” in the postgame interview?

Note: the starting point — in the diagram and in the video — is a situation, not a problem.

Apply (Mathematize)

Mathematical Modeling.003

The next process involves identifying and activating mathematical understanding in order to translate real-world problems into mathematical problems. The MoE calls this Apply, a misused and abused term in mathematics education. Thankfully, Mathematize immediately follows in brackets throughout the documents.

We can ask “What information would be helpful to know here?” Students might want to know:

  • the number of times that Boeser says “you know” in the clip (12)
  • the length, in seconds, of the clip (44)
  • the length of the entire interview (2:58)
  • the rate at which Boeser says “you know” (?)
  • the fraction of the time in which Boeser is speaking (?)

This process also involves — among other things — creating relationships to represent the real-world problems. Here, a proportional relationship. A simple approach might involve setting up 12/44 = x/178. A math problem.

Solve

Mathematical Modeling.004

At first glance, this looks trivial: simply cross-multiply and divide. But the Solve process involves using a variety of approaches and representations. For example, students might use scale factors or unit rates; bar models or ratio tables. Or, not proportions, but linear relations. Tables, equations, graphs. Does the solution make mathematical sense?

Analyze

Mathematical Modeling.005

Does the mathematical solution (x = 48.545454…) make sense within the contextualized situation? The Analyze process involves identifying possible limitations and improvements. Brock Boeser says “you know” 12 times in the 44 second Act 2 video. But he reaches this count at 33 seconds and finishes answering the reporter’s question at 40 seconds. Does any of this matter? Is my simple proportional approach still useful?

Communicate

Mathematical Modeling.006

Students communicate throughout the Interpret, Mathematize, Solve, and Analyze processes. This communication happens within their groups. The Communicate process in this mathematical modelling cycle involves clearly and logically defending, explaining, and presenting their thinking and solutions outside of their groups.

There are better tasks that I could have picked to illustrate this mathematical modelling cycle. In fact, last year — in the absence of sample numeracy tasks from the MoE — my go-to here was Michael Fenton’s Charge. BC’s Graduation Numeracy Assessment aside, mathematical modelling with three-act math tasks (and the pedagogy around these tasks) has played an important role in my work with Surrey math teachers for several years. The MoE did release a sample numeracy assessment in late September; I am now able to include a Reasoned Estimates, Plan and Design, Fair Share, and Model task in these conversations with colleagues. For more numeracy tasks, see Peter Liljedahl’s site.

Okay, so, um, if I didn’t pick this Brock Boeser task because it, you know, epitomizes the mathematical modelling cycle, then why did I share it? Coming full circle to the story of my three students at the beginning of this post, there’s a missing piece. Yeah, we shared a laugh and I was more self-conscious of my verbal fillers for the rest of the year (2005 ± 3). But the most embarrassing part is that I have no idea how my students came up with their estimates. Because I didn’t ask. I mean, three girls spontaneously engaged in mathematical modelling — I promise there was more mathematical thinking here than in the task at hand — and not a single question from their math teacher! In my defence, it would be several years before mathematical modelling was on my radar — an unknown unknown. Still, what a complete lack of curiosity!

Alike & Different: Which One Doesn’t Belong? & More

I have no idea what I was going for here:

WODB? Cuisenaire Rods

At that time, I was creating Which One Doesn’t Belong? sets. Cuisenaire rods didn’t make the cut. Nor did hundreds/hundredths grids:

WODB? Hundreds Grids

I probably painted myself into a corner. Adding a fourth shape/graph/number/etc. to a set often knocks down the reason why one of the other three doesn’t belong. Not all two-by-two arrays make good WODB? sets (i.e., a mathematical property that sets each element apart).

Still, there are similarities and differences among the four numbers above that are worth talking about. For example, the top right and bottom right are close to 100 (or 1); the top left and bottom right are greater than 100 (or 1); top left and top right have seven parts, or rods, of tens (or tenths); all involve seven parts in some way. There is an assumed answer to the question, “Which one is 1?,” in these noticings — a flat is 100 if we’re talking whole numbers and 1 if we’re talking decimals. But what if 1 is a flat in the top left and a rod in the bottom left? Now both represent 1.7. (This flexibility was front and centre in my mind when I created this set. The ten-frame sets, too.)

Last spring, Marc and I offered a series of workshops on instructional routines. “Alike and Different: Which One Doesn’t Belong? and More” was one of them. WODB? was a big part of this but the bigger theme was same and different (and justifying, communicating, arguing, etc.).

So rather than scrap the hundreds/hundredths grids, I can simplify them:

Alike&Different.006

Another that elicits equivalent fractions and place value:

Alike&Different.007

For more, see Brian Bushart’s Same or Different?, another single-serving #MTBoS (“Math-Twitter-Blog-o-Sphere”) site.

Another question that I like — from Marian Small — is “Which two __________ are most alike?” I like it because the focus is on sameness and, like WODB?, students must make and defend a decision. Also, this “solves” my painted-into-a-corner problem; there are three, not six, relationships between elements to consider.

Alike&Different.009

The numbers in the left and right images are less than 100 (if a dot is 1); the numbers in the centre and right can be expressed with 3 in the tens place; the left and centre image can both represent 43, depending on how we define 1.

At the 2017 Northwest Mathematics Conference in Portland, my session was on operations across the grades. The big idea that ran through the workshop:

“The operations of addition, subtraction, multiplication, and division hold the same fundamental meanings no matter the domain in which they are applied.”
– Marian Small

That big idea underlies the following slide:

Alike&Different.013

At first glance, the second and third are most alike: because decimals. But the quotient in both the first and second is 20; in fact, if we multiply both 6 and 0.3 by 10 in the second, we get the first. The first and third involve a partitive (or sharing) interpretation of division: 3 groups, not groups of 3. (Likely. Context can determine meaning. My claim here is that for each of these two purposefully crafted combinations of naked numbers, division as sharing is the more intuitive meaning.)

Similar connections can be made here:

Alike&Different.015

This time, the first and second involve a quotative (or measurement) interpretation of division: groups of (−3) or 3x, not (−3) or 3x groups. (What’s the reason for the second and third? Maybe this isn’t a good “Which two are most alike?”?)

I created a few more of these in the style of Brian’s Same or Different?, including several variations on 5 âˆ’ 2.

Alike&Different.017
Alike&Different.023

Note: this doesn’t work in classrooms where the focus is on “just invert and multiply” (or butterflies or “keep-change-change” or…).

And I still have no idea what I was going for with the Cuisenaire rods.

The slides:

Updates:

An edited version of this post appeared in Vector.

Paint Splatter Arrays

This isn’t Splat!

Paint Splatter Arrays (.key)
Paint Splatter Arrays (.pdf)

In Steve Wyborney’s Splat!, the total number of dots is given and the number of dots under each splat is unknown. In my Paint Splatter Arrays, the total number of dots is unknown. My paint splatters do cover some dots but how many is beside the point. Also, Steve’s dots are scattered; mine are arranged in arrays. (More on that below.) Steve’s splats splat. My splatters are there from the get-go. See? Not the same.

h/t Andrew Stadel

Here’s why I created this activity…

Number Talks -- Dot Cards

T: “How many do you see?”

S: “Twenty-five.”

T: “How do you see them?”

S: “Two, four, six, …”

Every. Single. Time.

Not all students. Most students do see and use groups or arrays to figure out how many. Those strategies are described in this post. But some students don’t seem to make sense of others’ ideas. That’s a greater challenge than I’ll tackle here. (Recommended: Intentional Talk by Elham Kazemi and Allison Hintz.) Instead, I designed the activity above to (gently) shove students towards looking for and making use of arrays.

The first three are softballs. For example, the second:

Paint Splatter Arrays.004

Students can still see each dot and count all by ones or twos. But a more efficient strategy is to see 3 × 5 (3 rows, 5 columns).

The next several slides completely cover at least one dot, so students can’t count all by counting what they can see. In each, at least one complete row and one complete column is visible. For example:

Paint Splatter Arrays.010
4 × 6

Paint Splatter Arrays.028
6 × 6

I had some fun with the last two. In the next-to-last one, the middle column is completely concealed.

Paint Splatter Arrays.030
3 × 7

In the last one, most of the dots are hidden. A bit of estimation. How many?

Paint Splatter Arrays.032

How confident are you?

Paint Splatter Arrays.033
<shrinks> 6 × 8

What about now?

I test-drove these on my daughters. (Keira likes Booger Math! over Paint Splatter Arrays, by the way. It is catchier.) I’m looking forward to trying this out in Surrey classrooms. Feedback welcome!

And mine goes ding ding ding di di ding ding DING ding ding ding di di ding ding.

Dividing by Decimals & Fractions: Ham & Ribs

I bought a ham. It was touch-and-go there for awhile. As I was picking up and putting down hams of various sizes, I was calculating baking times. My essential question was, can I have this on the table by six? Simultaneously, I was trying to remember if this was partitive or quotative division.

In partitive division problems, a.k.a division as (fair) sharing, the number of groups is known. This type of problem asks how many are in each group. In quotative division problems, a.k.a. division as measurement, the number in each group is known. This type of problem asks how many groups. For example: 6 ÷ 3 = 2 (partitive) means ♦♦  ♦♦  ♦♦; 6 ÷ 3 = 2 (quotative) means ♦♦♦  ♦♦♦. This distinction isn’t limited to collections of objects. Consider 6 ÷ 3 as cutting a 6 m rope into 3 parts (sharing) vs. cutting lengths of 3 m (measurement). Nor are these meanings limited to whole numbers. Which brings me back to my ham…

The directions read “bake approximately 15 minutes per pound (0.454 kg) or until internal temperature reaches whatever.” But here’s the thing:

Ham

Kilograms, not pounds. I could have converted from kilograms to pounds by doubling then adding ten percent of that. Instead, I divided 1.214 by 0.454. I know, I know, this still gives me the weight of my ham in pounds. But at the time, I interpreted 2.67 as the number of repeated additions of 15 minutes in my baking time. Either way, I determined how many 0.454s there are in 1.214. Quotative division. By a decimal.

As a math task, this is clunky. The picture book How Much Does a Ladybug Weigh? by Alison Limentani is a more promising jumping off point for quotative division in the classroom. On each page, the weight of one animal is expressed in terms of a smaller animal.

How Much Does a Ladybug Weigh? Snails &amp; Starling

Using the data at the back of the book, we have 3.2 ÷ 0.53 = 6. We could ask children to make other comparisons (e.g., how many grasshoppers weigh the same as one garden snail?).

How Much Does a Ladybug Weigh? Data

[Insert link to Marc‘s First Peoples beaded necklace task here]

In the past, I have struggled with partitive division by decimals (or fractions). But I found the following example at The Fair this summer:

RibRacks

It’s not intuitive–at least to me–to think of 1/3 in 12 ÷ 1/3 as the number of groups. Take a step back and think about 26 ÷ 1 = 26. The cost, $26, is shared between 1 rack of ribs; the quotient represents the unit price, $26/rack, if the unit is a rack. This result should be… underwhelming.

Before we think about dividing by a fraction here, let’s imagine dividing by a whole number (not equal to one). What if I paid $72 for 3 racks? (Don’t look for these numbers in the photo above–I’m making them up.) In 72 ÷ 3 = 24, the cost, $72, is shared between the number of racks, 3; again, the quotient represents the unit price, $24/rack. Partitive division.

So what about 12 ÷ 1/3? The cost is still distributed across the number of racks; once again, the quotient represents the unit price, $36/(full) rack. The underlying relationship between dividend, divisor, and quotient hasn’t changed because of a fraction; the fundamental meaning (partitive division) remains the same.

We could have solved this problem by asking a parallel question, how many 1/3s in 12? And this quotative interpretation makes sense with naked numbers. But it falls apart in this context–how many 1/3 racks in 12 dollars? Units, man! If dollars were racks, a quotative interpretation would make sense–how many 1/3 racks in 12 full racks?

As a math task, this, too, is clunky. My favourite math tasks for partitive division by fractions are still Andrew Stadel’s estimation jams.

(Looking for a quotative division problem that involves whole numbers? See Graham Fletcher’s Seesaw three-act math task. For partitive, there’s Bean Thirteen.)

The New York Times’ “What’s Going On in This Graph?”

The “Numeracy Helping Teacher” part of my job immerses me in things related to the teaching and learning of mathematics. I’m comfortable in that space. The “Curriculum, Innovation, and Priority Practices Helping Teacher (Guildford/Fleetwood)” part of my job? Not always.

It can be challenging to plan experiences that will be meaningful to English teachers and physical education teachers, to science teachers and French teachers, etc. One approach is to have teachers participate in a math activity, then wave my hands–magic!–and say “Of course, this strategy translates to your social studies classroom.” In fact, swap the two subjects in the previous sentence and you will accurately sum up much of my professional development experiences from early in my career. Turnabout is fair play?

A more promising approach is to find a colleague from another subject and talk pedagogy. Discuss similarities. Discuss differences. Several years ago, my literacy colleague Iain Fisher hipped me to The New York Times‘ “What’s Going On in This Picture?” feature. An evocative image is stripped of its caption and students discuss/write about what they see.

20121009POD-slide-LF4J-superJumbo

Later, the photo’s caption and story are revealed.

A child jumps on the waste products that are used to make poultry feed as she plays in a tannery at Hazaribagh in Dhaka, Bangladesh on Oct. 9, 2012. Luxury leather goods sold across the world are produced in a slum area of Bangladesh’s capital where workers, including children, are exposed to hazardous chemicals and often injured in horrific accidents, according to a study released on Oct. 9. None of the tanneries, packed cheek-by-jowl into Dhaka’s Hazaribagh neighborhood, treat their waste water, which contains animal flesh, sulphuric acid, chromium and lead, leaving it to spew into open gutters and eventually the city’s main river.

I connected this strategy to my teaching with three-act math tasks. In both, subtracting information adds perplexity. Central to this strategy, in English language arts or mathematics classrooms, was the shared belief that our students were, above all, curious. At a workshop for department heads from every department, we invited teachers to look closely at and interpret several photos that we selected from The Times‘ series. We invited them to notice and wonder. This activity was invaluable in tackling the challenge of talking big ideas and inquiry across all subjects. So I was very excited to see the announcement of a new monthly NYT feature: “What’s Going On in This Graph?”

I needed the activity before the first “WGOITGraph?” would be published so I created my own. I modelled the strategy using Dan Meyer’s “Canada Flushed” graph. Only I stripped it naked.

Flushed (Stripped)

I asked “What do you notice?” and recorded their noticings:

  • the blue line is more variable than the green
  • there are two lines: blue and green
  • there are large peaks and valleys

“What else?”:

  • the lines are more similar at the ends
  • the maximum points are evenly spaced (“periodic” even!)
  • the minimum values are decreasing
  • there are small spikes between the dips
  • the blue line is thicker than the green line

I asked “What do you wonder?” and recorded their wonderings:

  • ECG? Stock market?
  • is the scale of the x-axis seconds, minutes, hours, days? (“… because the x-axis is always time.” — Geoff Krall)
  • are the lines related? (Ha! Spurious correlations?)
  • what’s the y-axis?
  • what’s causing the peaks and valleys?

I gradually provided answers to some of their questions. “The lines are related. The green and blue lines represent two successive days, February 27 and 28. The horizontal axis is time of day from noon to six.”

I added a critical piece of information: “February… 2010.” That was enough for some to blurt out “Olympics!” or “Hockey!” I gave them time to talk at their tables. There was a natural transition to “What’s going on?” before I asked the question (just as there’s a natural transition from noticings to wonderings). You can read the graph’s story here.

In the second half, I invited one teacher at each table to try out the strategy. I provided these facilitators with a rough script (anticipated noticings and wonderings, what to reveal and when, the complete graph with all its bits and pieces). They shared the following stripped graph with their colleagues:

WGOITGraph? Sushi (Stripped)

“What do you notice?”

  • junk foods bottom left, healthy foods top right
  • there’s a diagonal line (or y = x)
  • some foods are farther away from this line than others
  • there are arrows pointing to two foods

It is key that participants notice the line as it implies two variables (that are largely similar). If what’s going on is just a measure of the healthiness of foods, a continuum (a.k.a. a number line) is all that is needed. A coordinate system is overkill. There were some related false starts here (e.g., fat, sugar). I encouraged facilitators to let that play out. Groups self-corrected. The arrows indicate where text boxes have been removed. Learners were told that they could choose to revisit the “stories” of these foods later.

“What do you wonder?”

Facilitators gradually provided answers to their group’s questions. For example, if participants were told that the y-axis represents the percent of nutritionists saying a food is healthy, they reasoned that the x-axis represents another group: the public (or all Americans).

“What’s going on in this graph?”

Groups revisited granola bars and quinoa. They discussed possible reasons for differences in opinions between nutritionists and the public. They noticed and wondered some more.

When planning, I considered slowly providing this information in a series of slides. To learn more about this approach, see Brian’s post.

On Monday, I was invited to Fraser Heights Secondary to be part of their professional development day. I chose to lead teachers through this activity. (Last week, I test drove it with Surrey Math Department Heads.) Teachers–from all departments–were engaged in the activity. Not because of the “real-world” context but because “we had to figure out what was going on.” A math activity.

My plan was to connect this activity to core and curricular competencies. Also, I wanted to ask teachers to consider where–in their discipline, in their practice–they could remove (and gradually provide) information. I wanted to ask teachers to consider where they could ask their students “What do you notice? What do you wonder? What’s going on?” I rushed that. “Never skip the close!” I hope that challenge didn’t come across as hand-waving.

Updates

Jenna Laib (@jennalaib) launched slowrevealgraphs.com!

Additional examples, discussed in BCAMT’s Vector 61(1)…